
India Industrial Sensors And Transmitters Market Size and Share
Market Overview
| Study Period | 2020 - 2031 |
|---|---|
| Forecast Data Period | 2026 - 2031 |
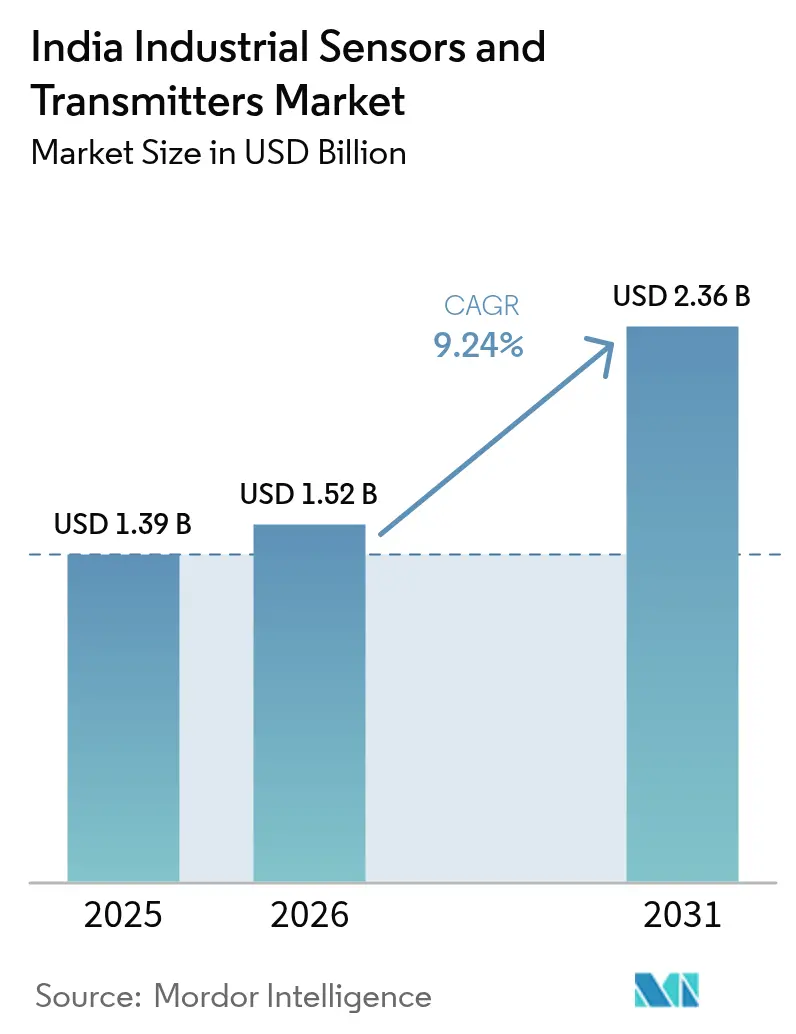
| Base Year Market Size (2025) | USD 1.39 Billion |
| Market Size (2026) | USD 1.52 Billion |
| Market Size (2031) | USD 2.36 Billion |
| Growth Rate (2026 - 2031) | 9.24 % |
| Market Concentration | Medium |
Major Players *Disclaimer: Major Players sorted in no particular order Image © Mordor Intelligence. Reuse requires attribution under CC BY 4.0. | |
India Industrial Sensors And Transmitters Market Analysis by Mordor Intelligence
The India industrial sensors and transmitters market size is expected to grow from USD 1.39 billion in 2025 to USD 1.52 billion in 2026 and is forecast to reach USD 2.36 billion by 2031 at 9.24% CAGR over 2026-2031. This advance mirrors India’s accelerated transition toward digitalized, data-driven production environments, spurred by government incentive programs, widening Industry 4.0 adoption, and greater demand for predictive maintenance solutions. Large capital commitments from multinational firms, such as Schneider Electric’s INR 3,200 crore (USD 384 million) manufacturing expansion, point to deepening localization strategies that reduce import exposure and shorten delivery cycles. Meanwhile, stricter quality regulations in pharmaceuticals and food processing, combined with energy-efficiency mandates for heavy industry, expand the addressable base for pressure, flow, and temperature sensing solutions. Persistent semiconductor import reliance, however, continues to expose the India industrial sensors and transmitters market to global supply disruptions, potentially elongating lead times and inflating costs. Growing data-center capacity in key metros further amplifies demand for precision HVAC sensors capable of meeting stringent uptime requirements, reinforcing momentum across specialty sensor categories.
Key Report Takeaways
- By sensor type, pressure sensors held 27.12% India industrial sensors and transmitters market share in 2025, while vibration and condition-monitoring units are set to post an 10.95% CAGR through 2031.
- By end-user, oil and gas retained a 26.15% share of the India industrial sensors and transmitters market size in 2025, but life sciences is projected to expand at a 11.02% CAGR over the same horizon.
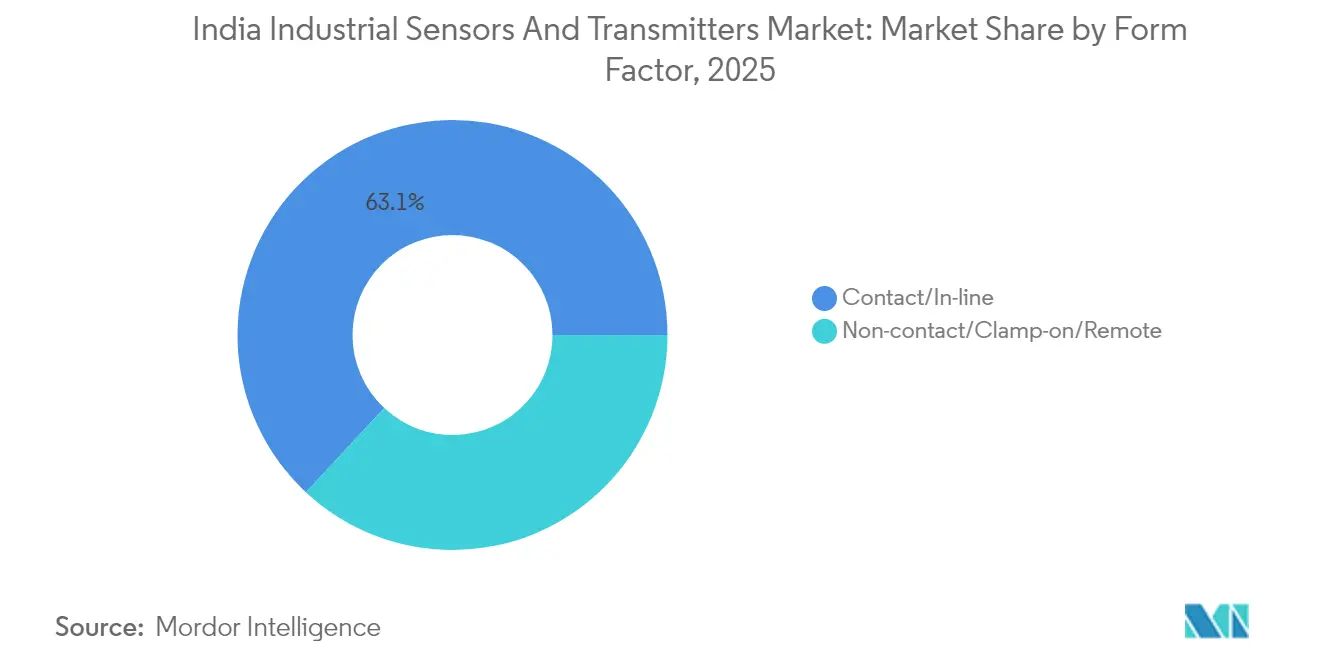
- By form factor, contact sensors accounted for 63.05% of the 2025 India industrial sensors and transmitters market size; non-contact solutions are on track for a 9.88% CAGR to 2031.
- By communication technology, wired systems generated 50.95% revenue in 2025 of the India industrial sensors and transmitters market, whereas wireless platforms are forecast to grow at 10.22% CAGR through 2031.
- By geography, West India led with 38.10% market share of the India industrial sensors and transmitters market in 2025, yet South India is expected to record the fastest 10.76% CAGR to 2031.
Note: Market size and forecast figures in this report are generated using Mordor Intelligence’s proprietary estimation framework, updated with the latest available data and insights as of 2026.
India Industrial Sensors And Transmitters Market Trends and Insights
Drivers Impact Analysis*
| Driver | (~) % Impact on CAGR Forecast | Geographic Relevance | Impact Timeline |
|---|---|---|---|
| Government "Make-in-India" and PLI schemes catalyzing smart factories | +2.1% | National, with early gains in West India, South India | Medium term (2-4 years) |
| Rising Industry 4.0 adoption across discrete manufacturing | +1.8% | West India, South India core, spill-over to North India | Short term (≤ 2 years) |
| Quality-centric regulations in pharma and Food and Beverage sectors | +1.4% | National, concentrated in Maharashtra, Karnataka, Telangana | Long term (≥ 4 years) |
| Energy-efficiency mandates for utilities and process industries | +1.2% | National, with early gains in industrial states | Medium term (2-4 years) |
| Data-center boom demanding precision HVAC sensors | +0.9% | South India, West India, North India metros | Short term (≤ 2 years) |
| Localization of sensor component supply chains | +0.7% | National, manufacturing hub focus | Long term (≥ 4 years) |
| Source: Mordor Intelligence | |||
Government “Make-in-India” and PLI Schemes Catalyzing Smart Factories
Performance-linked incentives worth INR 76,000 crore (USD 9.1 billion) reward manufacturers that demonstrate sustained capital expenditure and output growth, tilting sourcing decisions toward domestically produced sensor components.[1]Press Information Bureau, “Production Linked Incentive Scheme for Large Scale Electronics Manufacturing,” pib.gov.in Multinationals have responded by building vertically integrated plants that reduce logistics costs, compress lead times, and adapt product lines to Indian operating conditions. Larger domestic content also shields buyers in the India industrial sensors and transmitters market from exchange rate volatility. Over the medium term, a denser local vendor ecosystem is likely to compress price premiums for advanced smart sensors, further accelerating adoption across mid-tier manufacturers.
Rising Industry 4.0 Adoption Across Discrete Manufacturing
Automakers transitioning to electric vehicles, electronics assemblers optimizing line changeovers, and capital-goods makers deploying predictive analytics share a common need for real-time condition data. Factory leaders report up to 30% downtime reduction after embedding vibration, thermal, and power-quality sensors into production assets, which translates to notably higher throughput per square foot. Success stories such as Daifuku’s sensor-rich material-handling plant in Hyderabad catalyze copy-cat projects among Tier-2 suppliers keen to preserve OEM rankings. The India industrial sensors and transmitters market will therefore benefit from a virtuous loop: performance gains justify larger sensor budgets, and larger installations yield more data, which in turn feeds higher-value analytics services.
Quality-Centric Regulations in Pharma and Food and Beverage sectors
Revisions to GMP and FSSAI guidelines stipulate uninterrupted logging of pressure, temperature, and humidity conditions during drug formulation, packaging, and cold-chain transit.[2]Central Drug Standard Control Organization, “Good Manufacturing Practice Guidelines,” cdsco.gov.in Non-compliance risks plant shutdowns and export license suspensions, compelling manufacturers to migrate from manual batch checks to networked sensing platforms that feed audit-ready digital records. The India industrial sensors and transmitters market thus finds steady pull from compliance budgets even when capital allocations for broader automation remain tight. Moreover, successful adopters leverage the same sensor backbone to launch real-time process optimization projects, widening the technology’s payback narrative beyond mere regulatory insurance.
Energy-Efficiency Mandates for Utilities and Process Industries
The Perform, Achieve and Trade scheme sets plant-specific energy intensity targets and levies penalties for under-performance, making granular flow, pressure, and temperature measurements economically mandatory.[3]Bureau of Energy Efficiency, “Perform, Achieve and Trade Scheme Guidelines,” beeindia.gov.in Petrochemical complexes and steel mills installing multivariable transmitters and ultrasonic flow meters report double-digit megawatt-hour savings within two years of deployment, often surpassing target obligations. Energy savings certificates earned by over-achievers can be traded, providing an additional revenue stream that further sweetens sensor ROI calculations. The India industrial sensors and transmitters market, therefore, becomes integral to national energy-productivity goals.
Restraints Impact Analysis*
| Restraint | (~) % Impact on CAGR Forecast | Geographic Relevance | Impact Timeline |
|---|---|---|---|
| High CAPEX for smart-sensor retrofits | -1.3% | National; acute in SME clusters | Short term (≤2 years) |
| Interoperability and legacy integration issues | -0.9% | National; mature industrial belts | Medium term (2-4 years) |
| Skilled instrumentation technician shortage | -0.7% | National; fast-growing industrial zones | Long term (≥4 years) |
| Semiconductor import dependence | -0.5% | National; supply chain vulnerability | Short term (≤2 years) |
| Source: Mordor Intelligence | |||
High CAPEX of Advanced Smart-Sensor Retrofits
Smart units with built-in diagnostics and wireless modules often cost triple the price of legacy counterparts, and comprehensive facility conversions can require USD 2–5 million in fresh outlays. SMEs with slim margins hesitate to lock capital into five-year payback horizons, delaying sizable orders that would otherwise lift the India industrial sensors and transmitters market. Government low-interest loans and accelerated depreciation allowances partially offset sticker shock, yet awareness of such schemes remains patchy outside tier-one industrial parks.
Interoperability and Legacy System Integration Issues
Plants that grew organically over decades usually host heterogeneous control architectures. Introducing Ethernet-based or wireless sensors demands protocol converters, bespoke firmware, and extended validation cycles that push integration costs 20-30% above hardware lists. System downtime during switchover further discourages aggressive timelines, softening near-term revenue prospects for the India industrial sensors and transmitters market. Vendor coalitions promoting open standards show promise, but real-world convergence is still several budget cycles away.
*Our forecasts treat driver/restraint impacts as directional, not additive. The impact forecasts reflect baseline growth, mix effects, and variable interactions.
Segment Analysis
By Sensor Type: Pressure Sensors Lead Industrial Modernization
Pressure devices accounted for 27.12% of 2025 shipments, underscoring their foundational role in safe and efficient hydrocarbon processing, chemical synthesis, and power-generation boiler operations. The India industrial sensors and transmitters market size tied to pressure measurement is expected to compound at a steady clip as regulatory bodies enforce tighter safety margins in high-pressure pipelines. Manufacturers continue to widen portfolios with explosion-proof and differential configurations suited to the diverse viscosity and corrosiveness profiles seen in Indian refineries. Meanwhile, vibration and condition-monitoring sensors are set to post an 10.95% CAGR through 2031, propelled by maintenance digitization programs that aim to slash unplanned downtimes across automotive, cement, and steel plants. Suppliers that bundle sensors with predictive analytics dashboards secure annuity-style service revenue streams, strengthening overall value capture within the India industrial sensors and transmitters market.
Beyond the top two categories, temperature probes retain durable demand in pharma sterilization loops and dairy pasteurization lines where precise thermal control guards against batch spoilage. Flow sensors enjoy rising penetration in effluent treatment and desalination projects funded by municipal smart-water schemes. Level sensors migrate from discrete silo monitoring toward integrated inventory-management suites, providing ERP-ready feedstock visibility. Gas and humidity sensing extend from cleanrooms into next-generation data centers, where consistent air quality boosts server lifespan. Across all classes, OEMs increasingly push multi-parameter platforms that condense several sensing modalities into a single housing, lowering installation labor while expanding the India industrial sensors and transmitters market’s average selling price.




By End-user Industry: Oil and Gas Dominance Faces Life Sciences Challenge
Hydrocarbon value-chain participants commanded 26.15% of 2025 revenue, anchored by capital projects such as Indian Oil Corporation’s INR 24,000 crore (USD 2.88 billion) petrochemical expansion. Safety instrumentation ranging from SIL-rated pressure transmitters to combustible-gas detectors forms the bulk of oil-and-gas outlays, with environmental authorities mandating continuous emissions monitoring that further enlarges the India industrial sensors and transmitters market. Over the forecast period, however, pharma and biotech facilities are poised for an 11.02% CAGR, narrowing the share gap as vaccine and biologics plants scale GMP-compliant sensor grids spanning cold-chain storage, lyophilization chambers, and classified cleanrooms.
Utilities deploy smart metering and sub-station automation, driving uptake of power-quality transducers and fiber-optic temperature loops in transformers. Petrochemicals, chemicals, and fertilizers chase throughput optimization via multivariable sensors that monitor cross-linked reaction parameters. Food and beverage processors move beyond HACCP checklists, integrating cloud-linked sensors for real-time traceability from blending to packaging. Water and wastewater operators embrace clamp-on ultrasonic flow meters that eliminate service disruptions during tie-ins. Metals and mining companies adopt ruggedized vibration probes to anticipate drivetrain wear in conveyors and ball mills. Collectively, these verticals diversify the India industrial sensors and transmitters market, reducing over-reliance on any single commodity cycle.
By Form Factor/Installation: Contact Sensors Maintain Dominance Despite Remote Sensing Growth
Traditional in-line configurations represented 63.05% of 2025 shipments due to their proven accuracy, chemical compatibility, and body of calibration best practices. Pharma regulators and quality auditors continue to favor direct-contact thermocouples and diaphragm-sealed pressure transmitters, solidifying the segment’s baseline demand within the India industrial sensors and transmitters market. However, clamp-on and optical methods are growing at a 9.88% CAGR as brownfield operators seek minimal downtime installations. Ultrasonic flow meters that strap onto existing pipes allow capacity upgrades without hot-work permits, while infrared pyrometers find favor in steel rollers and glass furnaces where invasive probes are impractical.
Emerging non-contact platforms now feature self-powered energy harvesting and wireless backhaul, cutting both wiring and maintenance burdens. Pilot studies in dairy chilling plants show 15% faster deployment and 30% lower lifecycle costs compared with wired equivalents, validating the commercial thesis for remote sensing adoption. Yet harsh process conditions, abrasion, fouling, and high-pressure wash-downs still tilt many buyers toward contact devices, ensuring the India industrial sensors and transmitters market retains a healthy product mix over the forecast horizon.
By Communication Technology: Wired Systems Face Wireless Disruption
HART, MODBUS, and PROFIBUS networks delivered 50.95% of 2025 revenue because plant engineers prize deterministic performance and cyber-secure point-to-point topologies. The India industrial sensors and transmitters market size attributed to wired nodes will expand at a measured pace as Industrial Ethernet options such as PROFINET gain currency for high-bandwidth vision and robotics workloads. Operators appreciate Ethernet’s seamless handshake with cloud gateways, facilitating edge-to-cloud data harmonization without protocol converters.
Conversely, wireless shipments are accelerating at a 10.22% CAGR, catalyzed by retrofit friendliness in sprawling refineries, tank farms, and conveyor-heavy mines. ISA100.11a and WirelessHART now offer regulatory-grade reliability, earning acceptance in SIL-rated loops at gas-compression stations. Low-power wide-area networks like NB-IoT underpin battery-powered pressure nodes monitoring remote pipelines, slashing field inspection runs. Still, operational-technology cybersecurity frameworks must mature before wireless can fully erode wired incumbency, keeping the India industrial sensors and transmitters market finely balanced between both architectures.
Geography Analysis
West India generated 38.10% of 2025 revenue, anchored by dense automotive, petrochemical, and pharmaceutical corridors stretching from Pune to Vadodara. The India industrial sensors and transmitters market size in this region benefits from entrenched vendor ecosystems and port-enabled export logistics that shorten replenishment cycles. Multinationals leverage these strengths when allocating incremental capex, as noted by continuous production line upgrades at long-standing plants in the Chakan auto hub.
South India, posting an 10.76% forecast CAGR, has emerged as the nation’s fastest-growing locus for sensor deployment. Karnataka’s electronics clusters, Tamil Nadu’s expanding aerospace parks, and Telangana’s med-tech valley collectively pull advanced instrumentation demand upward. The knowledge-worker density around Bengaluru accelerates proof-of-concept pilots for wireless and AI-driven sensors, injecting innovation velocity into the India industrial sensors and transmitters market. Recent greenfield investments, including EBM-Papst’s fan-system plant and Daifuku’s material-handling facility, further cement the region’s momentum.
North India, East and Northeast, and Central India present sequential catch-up opportunities. Delhi-NCR’s metro expansion and smart-city pumps require distributed pressure and flow meters. Assam’s refinery capacity build-outs drive specialized explosion-proof sensor orders, while Jharkhand’s mineral extraction projects install ruggedized probes for conveyor vibration alerts. Collectively, these corridors will supply consistent incremental volumes, ensuring the India industrial sensors and transmitters market enjoys geographic risk diversification.
Regulatory Landscape
India industrial sensors and transmitters suppliers operate under a multi-layered compliance regime led by the Bureau of Indian Standards (BIS), including certification frameworks under the BIS Certification Regulations and the growing use of Quality Control Orders for regulated industrial components. Standardization work relevant to industrial process measurement and control and industrial automation/robotics is routed through BIS technical committees (including ETD 18 and PGD 18), and Indian standards are widely harmonized with ISO/IEC, shaping product documentation, test methods, and conformity assessment pathways for both domestic and imported devices.
For connected and wireless-enabled sensing, compliance extends beyond product safety and metrology into connectivity certification and system integration requirements. The Telecommunication Engineering Centre (TEC) administers Mandatory Testing and Certification of Telecom Equipments (MTCTE) for applicable network-connected equipment categories, and Industrial IoT deployments also face radio and interoperability considerations tied to India adoption of Industry 4.0 practices. Policy signals from MeitY (Draft National Strategy on Robotics, February 2024) and NITI Aayog (advanced manufacturing roadmap released in 2025) reinforce the push toward Industry 4.0 readiness. A February 2026 Government of India release on an AI-for-manufacturing white paper also underscores the direction of travel toward digitized, compliant, and data-driven operations, which increases the audit burden on sensing and instrumentation stacks.
Value Chain Analysis
The India industrial sensors and transmitters value chain spans imported upstream inputs (precision electronics and sensing elements) and localized midstream activities such as module assembly, calibration, and system integration tailored to Indian process conditions. Dependence on imported specialty subcomponents (for example, MEMS-related inputs and specialized RF/electronics modules for smart and wireless devices) keeps lead times and pricing exposed to global semiconductor and component cycles. Domestic firms and local arms of multinationals add value through customization, ruggedization, and application engineering for oil and gas, utilities, life sciences, and water infrastructure.
Downstream, routes to market are execution-driven, combining direct key-account sales to large process industries with regional distributors and instrumentation service partners that provide commissioning support, spares, and periodic calibration across hubs such as Mumbai-Pune, Chennai, and Ahmedabad. The chain also increasingly includes local competence centers and in-country product development to shorten qualification cycles and reduce integration friction with plant control systems and Industry 4.0 architectures. A 2026 example is Schmersal India inaugurating a new 25,000 sq ft competence center in Pune and launching multiple Make in India products, including a fork sensor, showing how localized engineering, testing, and productization are being added closer to end users to improve responsiveness and lifecycle support.
Competitive Landscape
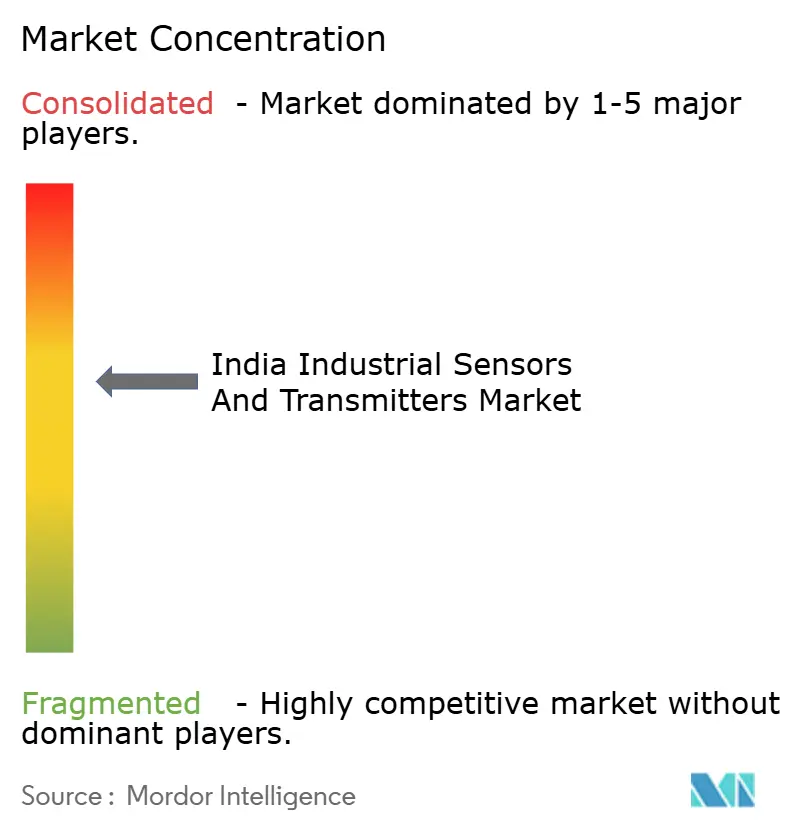
Competition is moderate, with global majors and agile domestic firms vying for a customer base that values reliability, conformity to Indian standards, and price-performance balance. Schneider Electric, ABB, and Emerson have scaled local production to cut tariffs and qualify for PLI incentives, translating into quicker order-to-delivery cycles and controlled cost structures that reinforce brand loyalty. ABB’s threefold jump in data-center orders illustrates how specialization in high-growth verticals can outpace overall market velocity.[4]ABB India Limited, “ABB India Reports Strong Growth in Data Center Business,” abb.com
Most tier-one vendors are shifting from pure hardware plays toward solution stacks bundling gateways, analytics, and lifecycle services. Subscription-based monitoring arrangements convert lump-sum capex into predictable opex, attractive to customers navigating budget constraints. Domestic upstarts differentiate by customizing transmitters for India-specific ambient conditions at price points 15–20% below imported units, capturing opportunities in cost-sensitive municipal and SME projects. Nonetheless, the India industrial sensors and transmitters market remains technology-driven; firms that sustain R&D pipelines in diagnostic algorithms and chip-level integration will secure durable competitive moats.
Partnerships with systems integrators and cloud providers multiply channel reach. Schneider Electric’s tie-ups with hyperscale operators for pre-certified sensor-to-cloud reference designs illustrate cooperative ecosystems that reduce buyer integration pain. Fragmented aftermarket service networks remain a weakness; firms offering nationwide calibration and spares availability gain a decisive edge in maintenance-intensive sectors like oil and gas. Cyber-security accreditations are turning into a gating factor for refinery and pharma tenders, adding a new layer of differentiation within the India industrial sensors and transmitters market.
India Industrial Sensors And Transmitters Industry Leaders
ABB India Limited
Honeywell Automation India Limited
Siemens Limited
Yokogawa India Ltd.
Emerson Process Management (India) Pvt. Ltd.
- *Disclaimer: Major Players sorted in no particular order

Market Opportunities and Future Outlook
White space is expanding in sensor-led digitization projects that sit at the intersection of compliance, energy management, and uptime, especially where buyers need audit-ready data trails and continuous monitoring rather than periodic manual checks. In regulated manufacturing and process operations, tighter operating and quality regimes have lifted demand for networked pressure, temperature, flow, and environmental sensing. Energy-intensity accountability frameworks also increase the economic value of accurate, granular measurement. On the connectivity side, plant retrofits that prioritize minimal downtime continue to create room for wireless and non-contact deployments where cabling and hot-work constraints are prohibitive.
The opportunity set is further shaped by India-based capacity and capability build-outs by automation and electrification majors that tighten local availability of components and application engineering. ABB announced a USD 75 million investment in March 2026 to expand manufacturing and R&D in India across electrification, motion, and automation, which supports faster localization of industrial instrumentation and related control stacks. Schneider Electric increased capital expenditure at its Kolkata facility in July 2026 to raise medium-voltage component output capacity. Hitachi Energy also started an approximately INR 2,000 crore investment in June 2026 for a new large power transformer factory at Karjan (Vadodara). Taken together, these moves broaden the installed base of electrified industrial infrastructure where transmitters and sensors are used for condition monitoring, thermal management, and power-quality-driven reliability programs across utilities, data centers, and process industries.
Recent Industry Developments
- July 2026: Schmersal India inaugurated a new 25,000 sq ft global competence center at AP4 Tech Park, Wagholi (Pune), and launched six Make in India products including a fork sensor. The added local engineering and productization footprint strengthens domestic supply, application support, and faster customization for safety and automation sensor deployments in Indian plants.
- August 2025: Schneider Electric confirmed an INR 3,200 crore manufacturing investment in Karnataka to expand production of automation components, supporting local availability of sensing and related industrial automation hardware. The move reinforces localization programs that reduce import exposure and shorten delivery cycles for industrial customers scaling Industry 4.0 and predictive maintenance initiatives.
- December 2024: Honeywell was selected by Exide Energy to deliver building automation for a lithium-ion gigafactory in India. Large greenfield factories typically embed broad sensor and transmitter layers for environmental monitoring, safety, and utility management, widening demand for industrial-grade sensing across new-energy manufacturing corridors.


Research Methodology Framework and Report Scope
Market Definition and Coverage
For this methodology, the market includes revenue earned in India from industrial sensors and transmitters used to measure and send process signals in factories and process plants, across common measurement points like pressure, temperature, flow, and level.
Scope exclusions: We exclude consumer and office sensors, and we also exclude pure software and services unless they are bundled with the hardware sale.
Segmentation Overview
- By Sensor Type
- Flow
- Temperature
- Pressure
- Level
- Vibration/Condition-Monitoring
- Gas and Humidity
- Other Sensor Types
- By End-user Industry
- Power Generation and Utilities
- Oil and Gas
- Petrochemicals, Chemicals and Fertilizers
- Food and Beverage
- Life Sciences (Pharma, Biotech and Medical Devices)
- Water and Waste-water
- Metals and Mining
- Other Manufacturing (Textile, Pulp and Paper, Auto, etc.)
- By Form Factor/Installation
- Contact/In-line
- Non-contact/Clamp-on/Remote
- By Communication Technology
- Wired (HART, MODBUS, PROFIBUS, etc.)
- Industrial Ethernet (PROFINET, EtherNet/IP, etc.)
- Wireless (ISA100, WirelessHART, Wi-SUN, LPWAN)
- By Region
- North India
- West India
- South India
- East and North-East India
- Central India
Data Sources, Market Sizing, and Validation
Desk Research
Desk research started with mapping demand anchors for industrial instrumentation in India, and then linking them to how sensors and transmitters typically get specified and purchased. We relied on public data series and rules that are easy to trace back, before moving into modeling assumptions like replacement cycles and price movement.
Sources used were a mix of official statistics and industry disclosures, such as Ministry of Statistics and Programme Implementation for industrial output signals, DPIIT for manufacturing investment direction, Directorate General of Commercial Intelligence and Statistics for import export patterns in instrumentation categories, and Bureau of Indian Standards and safety related codes that influence adoption in regulated plants. We also used company annual reports, investor presentations, and reputable press coverage to validate capacity additions and new plant activity, plus a paid subscription for company financials and another for shipment level import export checks where public totals were not granular enough. These examples are not exhaustive, and many other sources were referred to for data collection, validation, and research clarification.
Primary Interviews and Surveys
Primary work was used to stress test the demand pool and pricing logic through expert calls and structured surveys with instrument suppliers, system integrators, plant engineering teams, and procurement contacts. Since this is India focused, we balanced inputs across key industrial corridors and end user clusters, so we could validate adoption intensity, replacement behavior, and the share of wired versus wireless deployments across plant types.
Distribution of primary research fieldwork respondents
| Company type | Respondent position |
|---|---|
| Top tier: 30% | CXOs: 14% |
| Mid tier: 56% | Functional/Unit leaders: 40% |
| Smaller Players: 14% | Managers: 46% |
Market-Sizing & Forecasting
Sizing used a top-down and bottom-up approach in a practical way. From the top-down side, we rebuilt the served opportunity by tying industrial production and capex signals to instrumentation intensity in process industries, and then filtering it through the typical sensor and transmitter mix used per plant area.
To keep the model grounded, we tracked a few inputs closely and updated them, such as greenfield and brownfield project momentum, automation penetration in key end users, replacement demand in installed base sites, the mix shift toward wireless and digital communication, and average selling price movement for core sensor categories. Bottom-up checks were then used selectively, where we rolled up sampled supplier revenues, distributor channel checks, and volume times ASP estimates for common sensor types, and then adjusted totals when gaps showed up.
Forecasting was done using scenario analysis, because adoption can change with project awards and plant uptime cycles, and assumptions were confirmed through primary discussions. Where company level roll ups had missing disclosure, conservative ranges were applied based on observed product mix and typical India realization, and then reconciled back to the demand pool so the final number stayed consistent.
Data Validation & Update Cycle
Outputs were validated through multiple passes, starting with internal logic checks on growth rates, price paths, and penetration assumptions, followed by comparisons with independent signals like project pipelines, import trends for key instrumentation categories, and end user capacity additions. If a segment result looked out of line, we revisited the inputs, rechecked arithmetic, and then recontacted selected experts to confirm whether a real market shift was underway or an assumption was off.
Before sign-off, the model and narrative go through analyst reviews so major variances are explained and traceable. Reports are refreshed annually, and interim updates are made when material events occur, followed by a final freshness check right before delivery so clients receive the latest updated view.
Mordor Intelligence's India Industrial Sensors and Transmitters Market Sizing Compared With Other Published Estimates
Published market numbers for India industrial sensors and transmitters can differ because each publisher chooses its own scope boundaries, price basis, and timing for what counts as the market. Differences also come from how much of the value chain is included, and whether estimates lean more on shipment signals or on end user spending patterns.
Import shipment trends for instrumentation categories, capex direction in process industries, and interview backed replacement cycle checks are the evidence points that keep Mordor Intelligence tied to the served hardware demand pool rather than a broader sensors universe. When another estimate mixes adjacent categories like general purpose sensors used outside industrial automation, or applies aggressive ASP uplift without checking procurement reality, the reported total can move up quickly even if unit demand does not.
Benchmark comparison
| Source | Market Size | Gaps in Research Methodology |
|---|---|---|
| Mordor Intelligence | USD 1.39 B (2025) | |
| Regional Consultancy A | USD 1.59 B (2026) | Uses a later base year and tends to carry forward higher smart sensor pricing without fully separating high value digital nodes from standard analog replacements across process plants. |
| Trade Journal B | USD 2.10 B (2025) | Appears to broaden scope into general industrial automation sensing and adjacent monitoring devices, which inflates totals when the boundary between transmitters and non-instrumentation sensors is not kept tight. |
The spread in published values mostly comes down to what is counted as industrial instrumentation hardware, and how pricing is projected for standard sensors versus higher value smart devices. By keeping scope rules clear and cross-checking totals with multiple demand signals, the estimate stays practical to replicate and easier to use for planning.


Key Questions Answered in the Report
What is the current size of the India industrial sensors and transmitters market?
The market is worth USD 1.52 billion in 2026 and is projected to reach USD 2.36 billion by 2031.
Which sensor category leads in terms of revenue?
Pressure sensors accounted for 27.12% of 2025 shipments, driven by oil, gas, and process-plant safety requirements.
Which end-user vertical is growing fastest?
Life sciences is anticipated to record an 11.02% CAGR through 2031 as GMP mandates intensify real-time monitoring needs.
Why are wireless sensor networks gaining traction?
They lower retrofit costs and enable condition monitoring in hard-to-cable locations while supporting predictive maintenance programs.
Which region is forecast to grow the quickest?
South India is set for an 10.76% CAGR through 2031, fueled by technology-sector expansion and greenfield advanced-manufacturing projects.
What is the main challenge limiting rapid market adoption?
High upfront capital costs for smart-sensor retrofits, especially among SMEs, remain the principal brake on accelerated deployment.
Page last updated on:





