Industrial Wireless Sensor Market Size and Share
Market Overview
| Study Period | 2020 - 2031 |
|---|---|
| Market Size (2026) | USD 9.03 Billion |
| Market Size (2031) | USD 17.04 Billion |
| Growth Rate (2026 - 2031) | 13.48% CAGR |
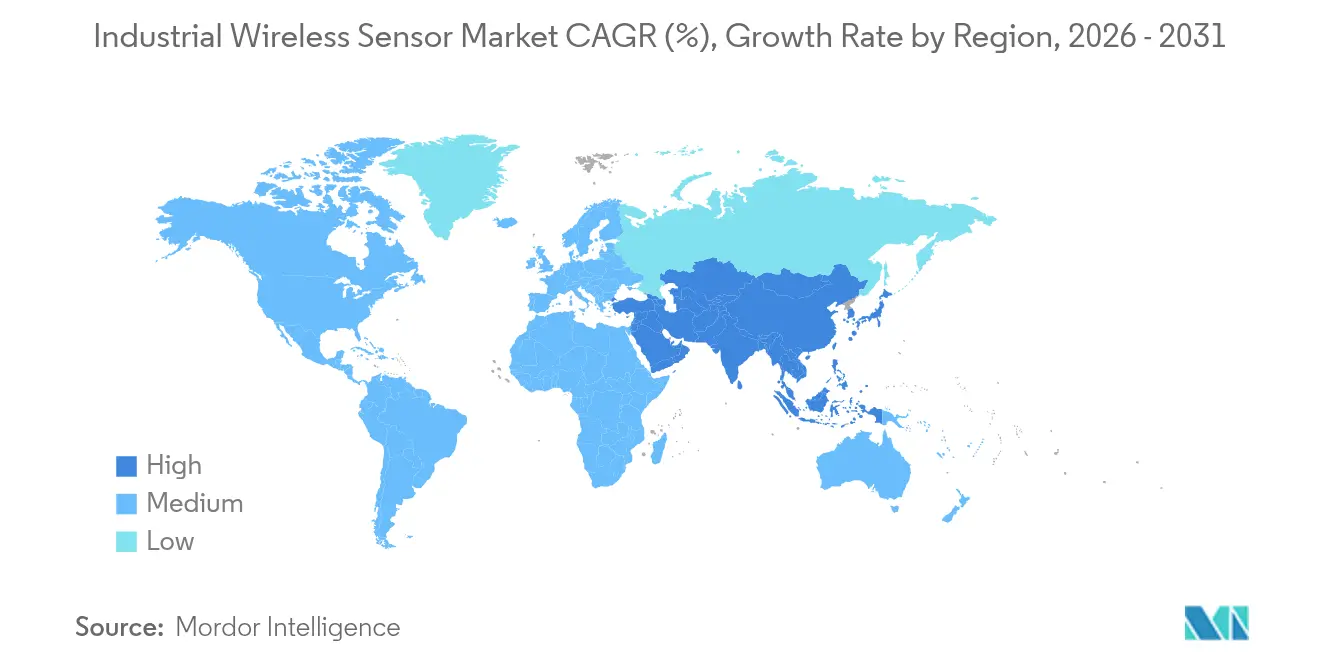
| Fastest Growing Market | Asia Pacific |
| Largest Market | North America |
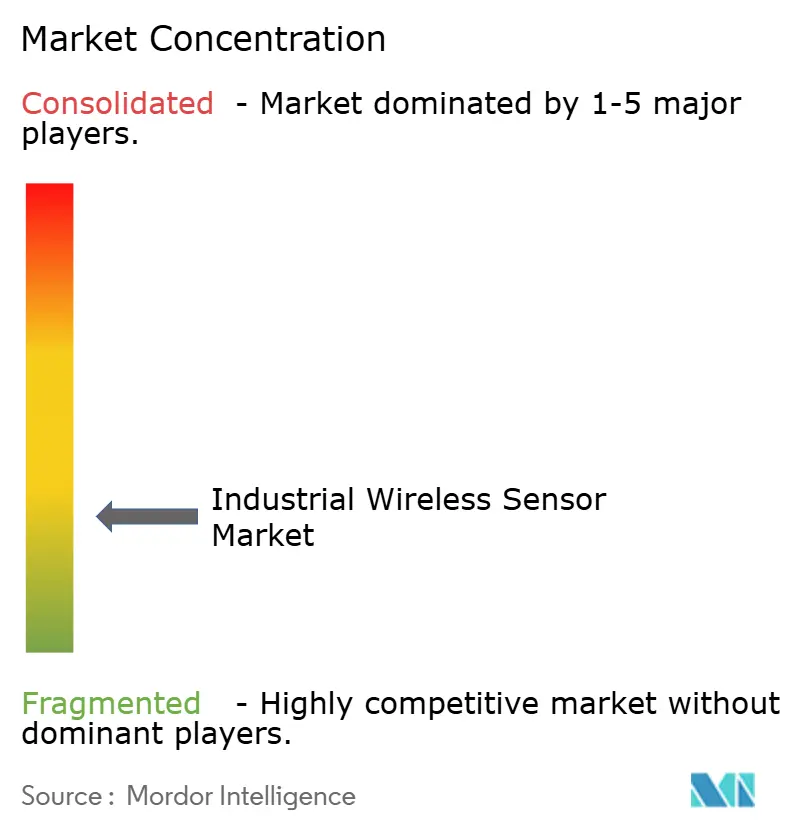
| Market Concentration | Low |
Major Players
*Disclaimer: Major Players sorted in no particular order Image © Mordor Intelligence. Reuse requires attribution under CC BY 4.0. |
|
Industrial Wireless Sensor Market Analysis by Mordor Intelligence
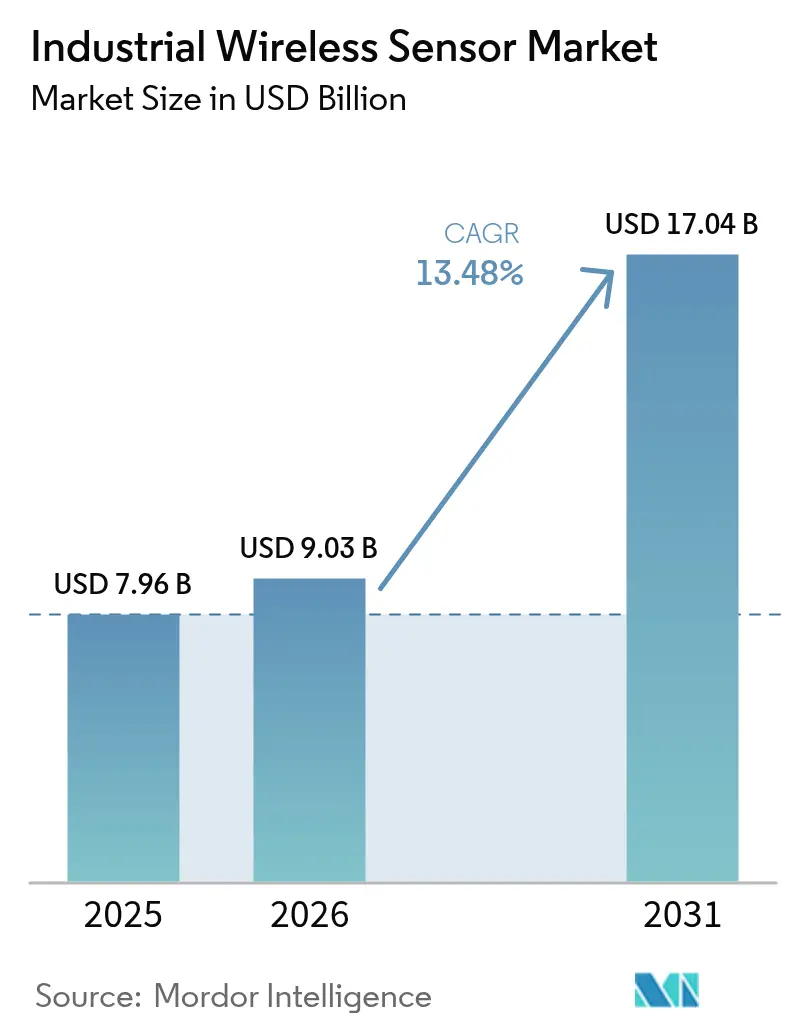
The industrial wireless sensors market size is expected to grow from USD 7.96 billion in 2025 to USD 9.03 billion in 2026 and is forecast to reach USD 17.04 billion by 2031 at 13.48% CAGR over 2026-2031. The expansion signals how digitalization, edge computing, and low-power wide-area networking push wireless sensing from pilot projects into core operational infrastructure. Falling chipset prices lower the total cost of ownership, while protocol innovation reduces integration risk, positioning the industrial wireless sensors market as an attractive investment priority for asset-intensive industries worldwide. Vendors continue to improve cyber-secure, battery-agnostic designs, enabling monitoring in previously inaccessible areas and unlocking data-driven maintenance strategies. This momentum accelerates platform convergence in which sensors, gateways, and analytics merge to create unified edge-to-cloud architectures that shorten decision cycles and raise asset value.[1] Emerson Newsroom, “Emerson’s ‘Project Beyond’ to Modernize and Seamlessly Integrate the Industrial Automation Technology Stack,” emerson.com
Key Report Takeaways
- By product type, pressure sensors led with 26.65% of industrial wireless sensors market share in 2025.
- By communication protocol, Wi-Fi held 44.65% of industrial wireless sensors market size in 2025, while LPWAN posted the fastest 23.55% CAGR through 2031.
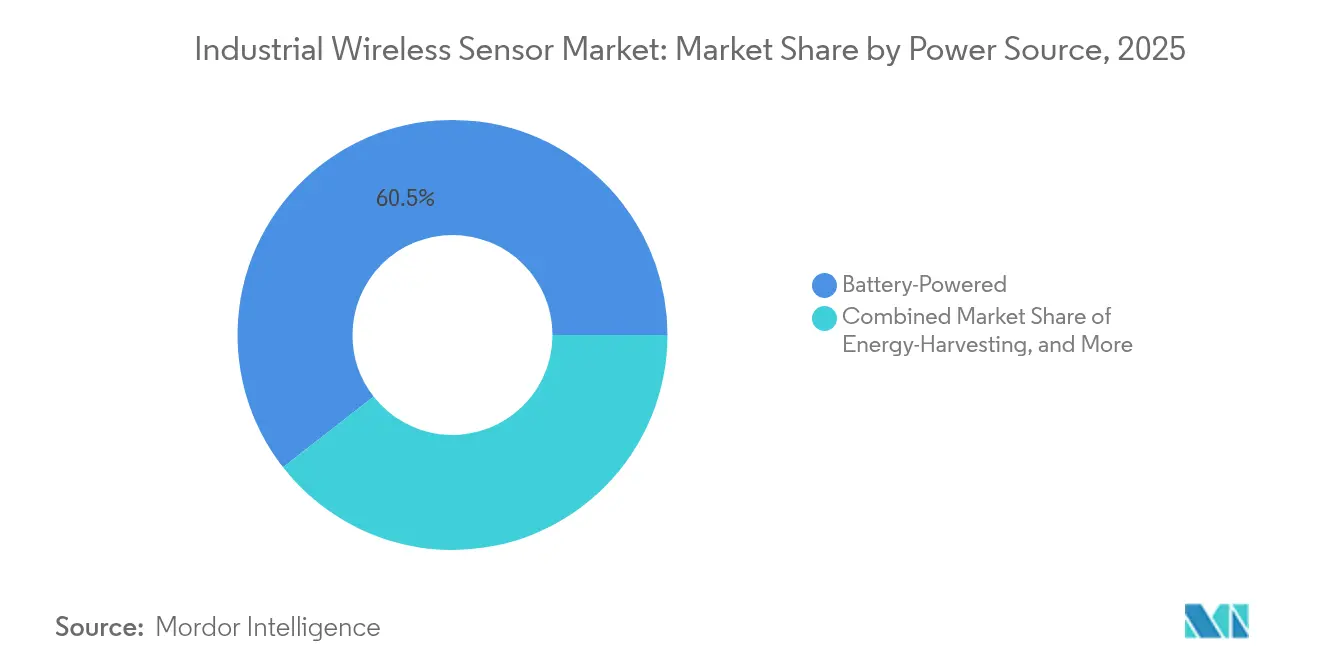
- By power source, battery-powered designs commanded 60.55% of industrial wireless sensors market share in 2025; energy-harvesting solutions will expand at a 15.55% CAGR to 2031.
- By end-user industry, oil & gas accounted for 31.05% revenue in 2025; mining and metals will accelerate at a 15.2% CAGR over the forecast horizon.
- By region, North America retained 34.35% revenue share in 2025; Asia Pacific will outpace all regions at a 13.95% CAGR to 2031.
Note: Market size and forecast figures in this report are generated using Mordor Intelligence’s proprietary estimation framework, updated with the latest available data and insights as of 2026.
Global Industrial Wireless Sensor Market Trends and Insights
Drivers Impact Analysis*
| Driver | (~) % Impact on CAGR Forecast | Geographic Relevance | Impact Timeline |
|---|---|---|---|
| Edge-to-cloud analytics demand surge | +2.8% | Global, early adoption in North America and EU | Medium term (2-4 years) |
| Retrofit digitalization of brown-field plants | +2.1% | North America and EU legacy facilities, expanding to APAC | Long term (≥ 4 years) |
| Low-power wide-area (LPWA) chipset price collapse | +3.2% | Global, strong benefit for APAC cost-sensitive markets | Short term (≤ 2 years) |
| Shift to predictive maintenance service models | +2.5% | Global, led by manufacturing and mining sectors | Medium term (2-4 years) |
| Source: Mordor Intelligence | |||
Edge-to-Cloud Analytics Demand Surge
Industrial operators now send only distilled insights instead of raw data to enterprise platforms, easing bandwidth burdens and cutting latency. Ultracompact sensors with embedded AI algorithms from firms such as TDK run machine-learning routines locally, shrinking transmitted payloads by up to 90%. Private 5G networks pair with edge servers to deliver sub-millisecond responsiveness for motion control, a milestone that broadens industrial wireless sensors market applicability into closed-loop automation. Factories deploying edge-to-cloud frameworks report 20-25% productivity gains through real-time anomaly detection. The capability aligns with sustainability goals by reducing compute energy requirements and enables predictive maintenance strategies that detect failures days in advance.
Retrofit Digitalization of Brown-Field Plants
Legacy facilities avoid disruptive rewiring costs by adding wireless nodes to equipment already running at capacity. ISA data show retrofit projects using wireless instrumentation achieve payback periods 60% shorter than wired equivalents. European chemical producers install vibration nodes on pumps and compressors to extend operating life and satisfy strict emission rules. Wireless attributes are compelling in hazardous zones where replacing or adding cables demands explosion-proof conduits, making wireless sensors a low-risk path to compliance. As brownfield estates outnumber new builds, retrofit activity will sustain double-digit volume growth across the industrial wireless sensors market well into the next decade.
Low-Power Wide-Area (LPWA) Chipset Price Collapse
LoRaWAN chipsets now cost under USD 5 in high-volume orders, down more than 70% from 2024 levels.[2]LoRa Alliance, “Smart Industry,” lora-alliance.org The price shift expands large-area monitoring in mining, utility networks, and agriculture, where previous cellular or mesh solutions were uneconomical. STMicroelectronics integrated sensing, processing, and LPWA connectivity into single MCUs that simplify design and compress the bill-of-materials expenses. Lower entry costs accelerate adoption in emerging markets, lifting the industrial wireless sensors market as labor-intensive industries digitize field operations.
Shift to Predictive Maintenance Service Models
OEMs increasingly sell performance outcomes rather than hardware, charging for guaranteed uptime based on data streams from machine-mounted sensors. Mining firms such as BHP report 75% reductions in unplanned downtime after deploying wireless vibration kits across haul trucks and crushers.[3]BHP Insights, “Artificial Intelligence Is Unearthing a Smarter Future,” bhp.comDigital twins generated from continuous sensor feeds enable virtual scenario testing that reduces maintenance interventions and extends equipment life. The service shift multiplies sensor node counts per asset, deepening penetration across the industrial wireless sensors market as capital-intensive sectors prioritize resilience and safety.
Restraints Impact Analysis*
| Restraint | (~) % Impact on CAGR Forecast | Geographic Relevance | Impact Timeline |
|---|---|---|---|
| Reliability concerns in RF-noisy industrial sites | -1.8% | Global, especially heavy manufacturing and steel production | Medium term (2-4 years) |
| Scarcity of OT-centric cybersecurity talent | -1.2% | North America and EU, emerging in APAC | Long term (≥ 4 years) |
| Source: Mordor Intelligence | |||
Reliability Concerns in RF-Noisy Industrial Sites
Variable-frequency drives, welding lines, and power converters emit electromagnetic interference that degrades packet success rates beyond 90% reliability thresholds in some factories. Operators resort to redundant networks or revert to wired links for safety-critical loops. Mesh topologies, frequency hopping, and advanced antennas mitigate disruptions yet add cost and complexity. As interference remains prevalent in metals and automotive plants, operators apply strict qualification tests before approving wireless for real-time control, a cautionary stance that tempers portions of the industrial wireless sensors market expansion.
Scarcity of OT-Centric Cybersecurity Talent
IEC 62443 compliance demands skills that blend network security with process control expertise, a combination still rare in most labor pools. The U.S. Department of Homeland Security flagged the shortage as a critical infrastructure vulnerability and launched workforce initiatives to bridge the gap. Hiring challenges prolong project cycles and inflate integration costs, particularly in small-to-mid-size enterprises without dedicated security resources. Universities and vendors now partner on specialized curricula, yet talent pipelines will take years to satisfy growing demand as the industrial wireless sensors market proliferates.
*Our forecasts treat driver/restraint impacts as directional, not additive. The impact forecasts reflect baseline growth, mix effects, and variable interactions.
Segment Analysis
By Product Type: Pressure Sensors Anchor Market Leadership
Pressure devices secured 26.65% industrial wireless sensors market share in 2025, reflecting their mandatory use for pipeline integrity and safety across process industries. Continuous pressure tracking avoids catastrophic leaks and satisfies stringent regulatory audits, justifying accelerated wireless retrofits where cabling through Class I Div 1 zones is cost-prohibitive. Vibration nodes grow fastest at 18.92% CAGR as predictive maintenance evolves from early pilots to corporate-wide standards, driving multi-sensor installations on rotating assets.
Temperature, flow, and gas categories secure broad adoption for environmental and quality control, while humidity and level units address niche but rising regulatory mandates in food, pharma, and tank storage. Imaging and biosensing remain nascent yet illustrate how edge AI will broaden sensing modalities within the industrial wireless sensors industry over the coming decade. Industrial buyers favor modular form factors and intrinsically safe housings that slash installation labor by up to 40%. Vendors now embed edge analytics to rank alarm severity, reducing false positives and maintenance tickets.


By Communication Protocol: Wi-Fi Scale Meets LPWAN Reach
Wi-Fi retained a 44.65% share due to its ubiquity in enterprise networks and alignment with IT security controls. Plants often deploy Wi-Fi in control rooms and indoor process areas where bandwidth enables high-definition video or advanced analytics streams. Yet LPWAN’s 23.55% CAGR indicates shifting preferences toward kilometer-scale coverage with multi-year battery life, critical for mines and pipeline corridors.
WirelessHART stays entrenched in petrochemical sites because it overlays existing HART loops, safeguarding decades of capital investment. ISA100.11a appeals to deterministic control scenarios despite higher engineering expense. Bluetooth and Zigbee service short-range mobile worker and building automation use cases. 5G NR industrial slices debut in ultra-low latency motion control, yet ecosystem maturity will dictate adoption pace.
By Power Source: Batteries Dominate, Harvesting Gains Momentum
Battery-Powered designs comprised 60.55% of 2025 shipments due to proven lithium chemistries that guarantee a 10-year operating life. However, energy harvesting grows at highest 15.55% CAGR as solar, vibration, and thermoelectric options eliminate truck rolls for remote nodes. Operators view harvesting as a pathway to net-zero maintenance in deserts, offshore platforms, and high-temperature furnaces, cutting lifetime ownership costs by double digits.
Hybrid architectures that juggle battery and harvested inputs extend deployment cycles, a feature increasingly standard in next-generation platforms. Gateways and routers remain wired for power and backhaul redundancy, creating anchor points for star-and-mesh topologies within the industrial wireless sensors market.
By End-User Industry: Oil & Gas Retains Demand Crown, Mining Accelerates
Oil & gas contributed 31.05% of 2025 revenue due to large-scale monitoring needs across pipelines, wellheads, and refineries, where hazardous zones complicate wired installs. Regulations obligate continuous leak detection, and wireless solutions prevent multimillion-dollar cabling projects, cementing oil & gas as the largest revenue base in the industrial wireless sensors market. Mining’s 15.2% CAGR reflects automation programs that rely on sensor-fed autonomy for haul trucks and drilling rigs.
Manufacturing verticals—automotive, food, chemical, pharma, and electronics—deploy wireless nodes for condition monitoring, quality assurance, and cleanroom integrity. Power utilities embed sensors in substations and renewable assets for real-time status checks. Healthcare and smart-building segments emerge as adjacent arenas as facility managers chase energy savings and occupant safety.
Geography Analysis
North America preserved a 34.35% revenue share in 2025, supported by sprawling oil pipelines, shale assets, and established brown-field factories embracing Industry 4.0 retrofits. U.S. policy spurs private 5G networks, and federal tax incentives for digital infrastructure accelerate deployments. Canadian miners deploy LoRaWAN over thousands of square kilometers to supervise autonomous haulage fleets, while Mexican maquiladoras adopt wireless nodes to enhance production traceability under nearshoring contracts.
Asia Pacific records the fastest 13.95% CAGR and will surpass North America before 2029. China targets 10,000 fully connected factories by 2027, requiring millions of sensors for process, environmental, and predictive functions. Local OEMs offer cost-optimized LPWAN devices, lowering entry barriers for tier-two manufacturers. Japanese automotive and electronics giants refine just-in-time workflows through edge-enabled sensors that spot quality drifts early.
Europe grows steadily as Industrie 4.0 policies and the EU Green Deal compel factories to audit energy and emissions. German process plants integrate WirelessHART with OPC UA gateways for holistic visibility. Nordic wind and solar farms blanket turbines with vibration and strain sensors to pre-empt mechanical faults under harsh climate loads. The continent maintains stringent cybersecurity mandates, elevating demand for IEC 62443-validated devices.

Competitive Landscape
Incumbent automation majors—ABB, Siemens, and Rockwell Automation—bundle sensing, control, and analytics in vertically integrated stacks, raising customer switching costs. Siemens’ AI foundation models and virtual PLCs expand addressable use cases, while ABB’s Margo initiative seeks open edge application layers. Competition remains moderate as top players collectively hold less than 50% revenue, leaving room for semiconductor challengers and specialized connectivity firms to grow.
Chipmakers such as STMicroelectronics, NXP, and Texas Instruments push system-on-chip innovations that shrink board area, lower power, and integrate secure elements. STMicroelectronics’ SESIP-3 certified STM32WBA6 MCU exemplifies how built-in crypto and multi-protocol radios serve rising cybersecurity and flexibility needs.[4]IoT Now, "STMicroelectronics' new integrated STM32WBA6 wireless microcontrollers combine extra features and performance with power efficiency.", iot-now.com Qualcomm collaborates with Honeywell to fuse AI inference engines with proprietary sensing technologies, aiming to shorten edge decision loops and open cross-licensing revenue streams. These alliances illustrate convergence between IT silicon roadmaps and operational technology requirements, reshaping supplier power within the industrial wireless sensors market.
Niche specialists address protocol interoperability and energy harvesting. Firms developing Matter-compliant gateways position for standardization tailwinds, while energy harvesting pioneers co-design sensors with battery manufacturers to deliver maintenance-free nodes. Competitive intensity fuels rapid feature cycles but also drives consolidation prospects as larger players acquire niche IP to complete portfolios.
Industrial Wireless Sensor Industry Leaders
-
ABB Ltd.
-
Rockwell Automation Inc.
-
Honeywell International Inc.
-
Siemens AG
-
Schneider Electric SE
- *Disclaimer: Major Players sorted in no particular order

Recent Industry Developments
- May 2025: Emerson launched Project Beyond, a software-defined operations platform integrating AI orchestration and zero-trust security to unify legacy automation islands, positioning Emerson as an end-to-end digital integrator.
- March 2025: Siemens revealed virtual PLCs and an industrial AI foundation model with Microsoft Azure to move control logic to the cloud, sharpening its edge-to-cloud value proposition and reinforcing recurring software revenue.
- March 2025: STMicroelectronics introduced SESIP-3 certified STM32WBA6 MCUs that embed multi-protocol radios and hardware root of trust, strengthening its cyber-secure IoT portfolio aimed at battery-sensitive industrial deployments.
- November 2024: NXP announced an ultra-wideband wireless battery management solution for EVs that eliminates wiring harnesses, signaling intent to diversify sensing applications beyond traditional industrial domains.


Research Methodology Framework and Report Scope
Market Definitions and Key Coverage
Our study defines the global industrial wireless sensors market as networks of sensor nodes that measure physical or chemical parameters on factory floors, process plants, mines, and utility assets, then relay readings over untethered radio links into control or analytics platforms. Values are expressed in USD for 2019-2030, with 2025 as the baseline.
Scope exclusion: stand-alone consumer gadgets, residential smart-home sensors, and wired industrial transmitters sit outside this assessment.
Segmentation Overview
-
By Product Type
- Temperature Sensor
- Pressure Sensor
- Flow Sensor
- Gas Sensor
- Humidity Sensor
- Vibration Sensor
- Level Sensor
- Imaging Sensor
- Biosensor
- Other Product Types
-
By Communication Protocol
- WirelessHART
- ISA100.11a
- Wi-Fi
- Bluetooth / BLE
- Zigbee
- 6LoWPAN / Thread
- LPWAN (LoRa, Sigfox)
- 5G NR (Rel-17 Industrial)
-
By Power Source
- Battery-Powered
- Energy-Harvesting
- Wired-Powered Gateways
-
By End-user Industry
-
Manufacturing
- Automotive
- Food and Beverage
- Chemicals
- Pharmaceuticals
- Electronics and Semiconductor
- Oil and Gas
- Energy and Power
- Mining and Metals
- Healthcare Facilities
- Smart Buildings and Infrastructure
- Other Industries
-
Manufacturing
-
By Geography
-
North America
- United States
- Canada
- Mexico
-
South America
- Brazil
- Argentina
- Rest of South America
-
Europe
- Germany
- United Kingdom
- France
- Italy
- Spain
- Russia
- Rest of Europe
-
APAC
- China
- Japan
- India
- South Korea
- Australia
- Rest of APAC
-
Middle East and Africa
-
Middle East
- Saudi Arabia
- United Arab Emirates
- Turkey
- Rest of Middle East
-
Africa
- South Africa
- Nigeria
- Kenya
- Rest of Africa
-
Middle East
-
North America
Detailed Research Methodology and Data Validation
Primary Research
Mordor analysts interviewed factory automation engineers, sensor OEM product managers, and system integrators across North America, Europe, and Asia, plus procurement leads from oil, gas, and metal producers. These conversations clarified battery-life assumptions, protocol-migration timelines, and typical ASP discount ladders, allowing us to validate and refine desk findings.
Desk Research
We began by pulling publicly available datasets from the US Energy Information Administration, Eurostat industrial production files, Japan's METI machinery shipment tables, and UN Comtrade codes that map to pressure, temperature, and flow instruments. White papers from the ISA-100 committee, patent counts via Questel, and failure-rate statistics released by the International Society of Automation helped us benchmark deployment densities. Company 10-Ks, investor decks, and curated articles sourced through Dow Jones Factiva provided shipment splits and average selling-price (ASP) trends. The sources listed are illustrative; many other databases and trade bodies were reviewed for corroboration.
Market-Sizing & Forecasting
Our model starts top-down, applying wireless penetration ratios to industrial output pools for discrete and process sectors; it then reconstructs annual unit demand. Selective bottom-up roll-ups of supplier shipment disclosures and distributor channel checks are used to true up totals. Key variables include sensors-per-pump averages, corrosive-site replacement cycles, LPWAN share gains, battery cost curves, and Brent crude price linkage. Multivariate regression supplemented by scenario analysis delivers the 2025-2030 outlook.
Data Validation & Update Cycle
Outputs pass a three-layer review; any variance over preset thresholds triggers re-checks with experts. Reports refresh annually, and mid-cycle updates follow material events so clients receive the latest view.
Why Mordor's Industrial Wireless Sensor Baseline Stands Firm
Published estimates often diverge because firms differ on whether they count retrofit gateways, fold building-automation nodes into totals, or assume aggressive price erosion. Our team isolates pure industrial nodes, refreshes exchange rates quarterly, and aligns replacement logic with real maintenance windows, which keeps Mordor's baseline dependable.
Key gap drivers include: 1) selective omission of mining and utilities volumes, 2) reliance on shipment surveys without replacement capture, and 3) inclusion of semi-industrial building controls.
Benchmark comparison
| Market Size | Anonymized source | Primary gap driver |
|---|---|---|
| USD 7.96 B | Mordor Intelligence | - |
| USD 5.90 B | Global Consultancy A | Excludes mining and utilities; slower protocol shift |
| USD 5.74 B | Trade Journal B | Shipment survey only; limited replacement logic |
| USD 8.00 B | Industry Publication C | Adds building-automation sensors |
The comparison shows our figure sits mid-range because we balance production-based demand pools with validated supplier insights, giving decision-makers a transparent, repeatable reference point.


Key Questions Answered in the Report
What is the projected size of the industrial wireless sensors market by 2031?
It is forecast to reach USD 17.04 billion by 2031, expanding at a 13.48% CAGR.
Which product segment currently leads the industrial wireless sensors market?
Pressure sensors held 26.65% market share in 2025, driven by pervasive use in oil & gas safety monitoring
Why are LPWAN technologies growing so quickly in the industrial wireless sensors industry?
LPWAN chipset prices have fallen more than 70% since 2024, enabling long-range, low-power deployments that cost less than mesh or cellular alternatives.
Which region will see the fastest growth in industrial wireless sensors adoption?
Asia Pacific will register a 13.95% CAGR through 2031, propelled by China’s push for fully connected smart factories.
What is the main barrier to wider deployment of wireless sensors in heavy manufacturing?
Electromagnetic interference from high-power equipment can cause packet loss rates above acceptable thresholds, prompting cautious adoption for safety-critical loops.
How are vendors addressing cybersecurity concerns in wireless sensor networks?
They integrate hardware roots of trust, adhere to IEC 62443 standards and bundle zero-trust architectures to offset the scarcity of OT cybersecurity talent.
Page last updated on:


