India EV Charging As A Service Market Size and Share
Market Overview
| Study Period | 2019 - 2030 |
|---|---|
| Forecast Data Period | 2025 - 2030 |
| Historical Data Period | 2019 - 2023 |
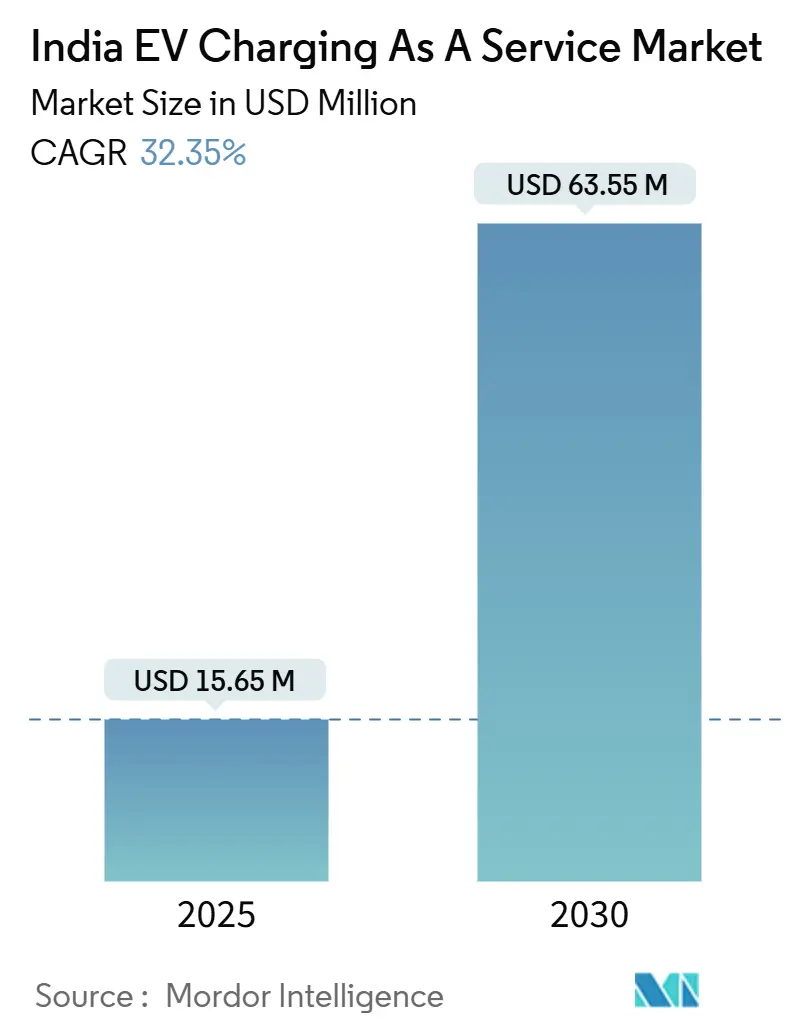
| Market Size (2025) | USD 15.65 Million |
| Market Size (2030) | USD 63.55 Million |
| Growth Rate (2025 - 2030) | 32.35% CAGR |
| Market Concentration | Medium |
Major Players *Disclaimer: Major Players sorted in no particular order Image © Mordor Intelligence. Reuse requires attribution under CC BY 4.0. | |
India EV Charging As A Service Market Analysis by Mordor Intelligence
The India EV charging-as-a-service market size stands at USD 15.65 million in 2025 and is forecast to reach USD 63.55 million by 2030, expanding at a 32.35% CAGR over the period. Rising preference for subscription-based and pay-per-use models is replacing ownership of charging assets, lowering capital barriers for fleets and households. Corporate electrification mandates, generous state-level capital subsidies and universal charger standards spur rapid network roll-outs, while time-of-day renewable tariffs underpin attractive operating economics. Larger utilities and oil-marketing companies leverage their asset bases to scale nationally, whereas software-centric start-ups compete on reliability, data analytics and seamless roaming. Ongoing consolidation hints at a transition from fragmented to moderately concentrated competition as top players acquire regional specialists and standardize back-end platforms.
Key Report Takeaways
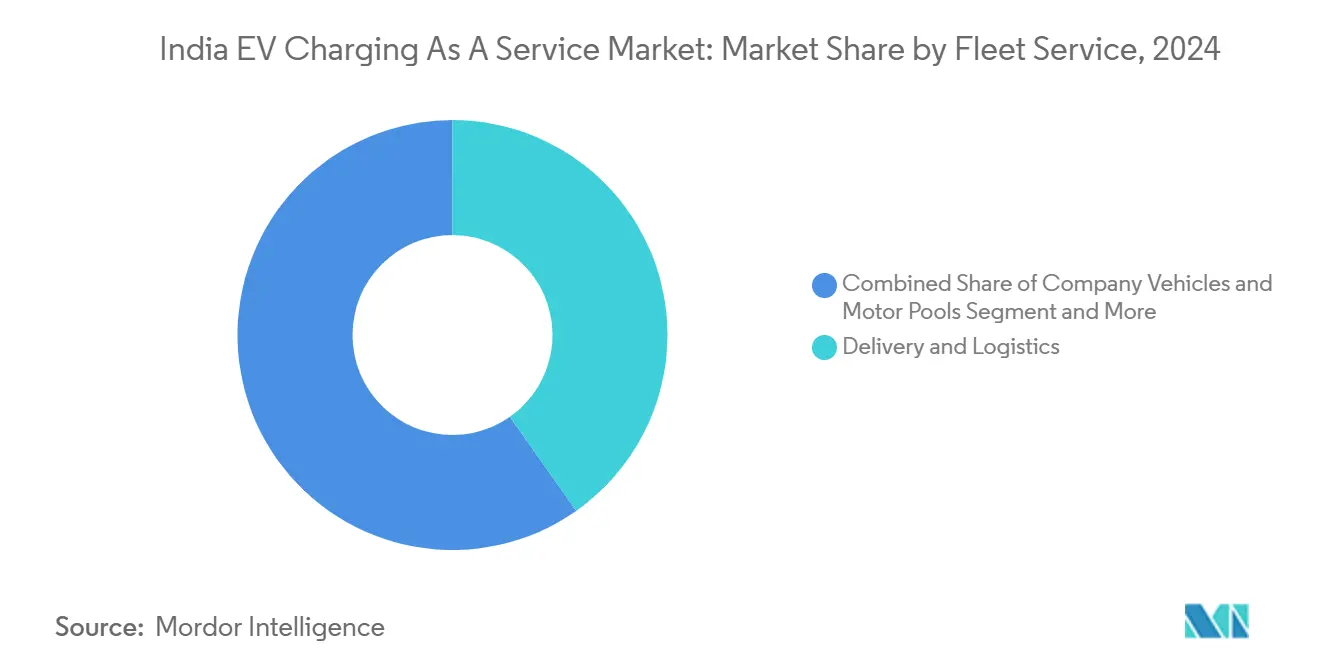
- By fleet-service type, delivery and logistics held 40.25% of the India EV Charging As a Service market share in 2024, whereas passenger fleets are projected to grow at 32.96% CAGR through 2030.
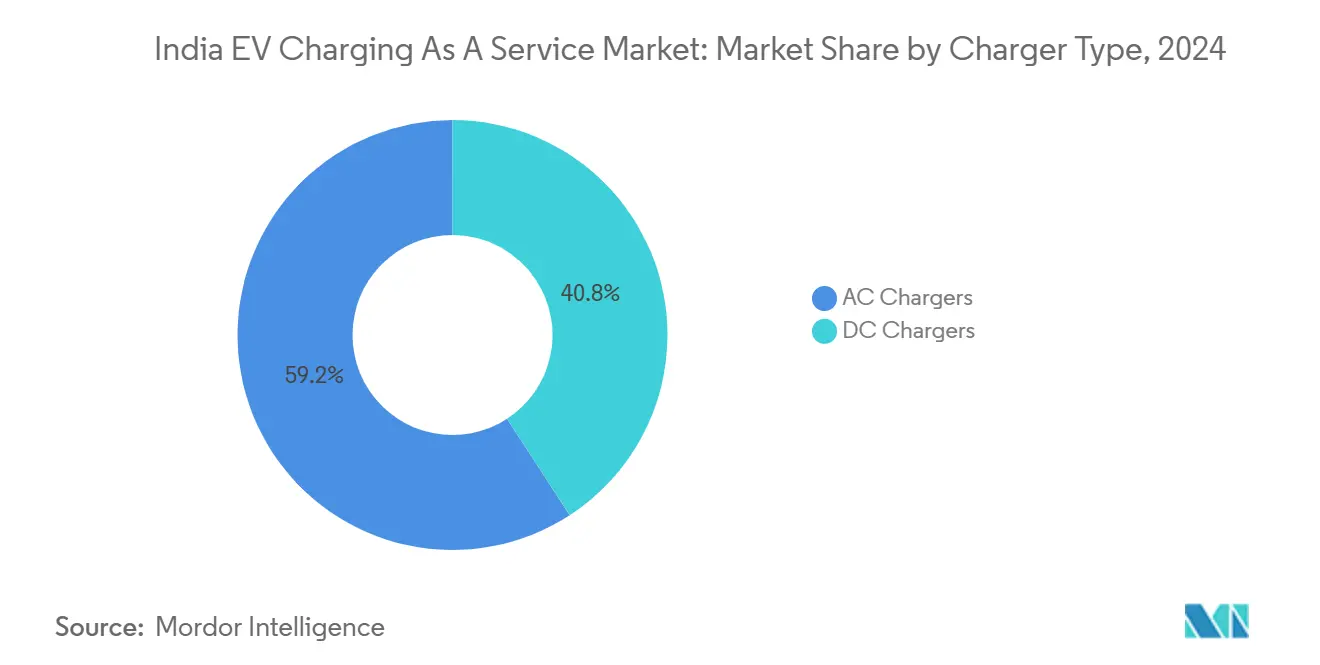
- By charger type, AC installations led with 59.18% share in 2024; DC fast chargers are advancing at a 33.29% CAGR to 2030.
- By power output, Level 2 equipment accounted for 43.82% of the India EV Charging As a Service market size in 2024, while >150 kW systems post the fastest 34.72% CAGR.
- By end-use, semi-public sites captured 58.19% share in 2024; public networks will expand at a 33.22% CAGR to 2030.
- By region, West India commanded 32.34% share in 2024 and East & North-East India is poised for the strongest 34.37% CAGR to 2030.
India contributes to a system defined not by any single country or region but by the interaction of many. The global ev charging as a service market data by Mordor Intelligence represents that combined structure.
India EV Charging As A Service Market Trends and Insights
Drivers Impact Analysis*
| Driver | (~) % Impact on CAGR Forecast | Geographic Relevance | Impact Timeline |
|---|---|---|---|
| FAME-II Extension & State Subsidies | +8.2% | Maharashtra, Gujarat, Karnataka | Medium term (2-4 years) |
| Corporate Fleet Mandates | +6.8% | Metro hubs, expanding to tier-2 cities | Short term (≤ 2 years) |
| Bharat Charger Interoperability | +5.3% | National, early adoption in tech-forward states | Medium term (2-4 years) |
| EV-Ready Parking Code | +4.1% | Metro cities and state capitals | Long term (≥ 4 years) |
| Renewable Time-of-day Tariffs | +4.7% | Gujarat, Rajasthan, Karnataka | Medium term (2-4 years |
| Battery Swapping Hubs | +3.9% | Delhi-NCR; Mumbai-Pune corridor | Short term (≤ 2 years) |
| Source: Mordor Intelligence | |||
FAME-II Phase-Out Extension and State-Level CAPEX Subsidies
The central government’s bridge allocation under FAME-II through July 2024 keeps hardware prices stable while states such as Maharashtra top it up with 25% capital grants capped at INR 10 lakh for the first 250 public chargers. Payback drops from eight to five years, letting operators scale faster even as subsidy slabs taper under the forthcoming FAME-III framework. Kerala’s decision to waive fixed and demand charges trims station operating costs by 12%, proving how tariff waivers can match capital incentives.
Corporate Fleet Electrification Mandates by E-Commerce and Logistics Majors
Delhi’s aggregator rules drive full electrification by 2030, prompting firms such as Flipkart to order 25,000 EVs and build multi-user depots that double as revenue-generating CaaS hubs. Amazon’s 10,000-unit goal widens the opportunity to tier-2 cities, while ride-hailing alliances transform captive hubs into shared charging marketplaces [1]“Flipkart to deploy 25,000 electric vehicles by 2030,”, Flipkart, flipkart.com.
Implementation of Bharat EV Charger Interoperability Protocols
IS 17017-2023 merges AC and DC standards, slashing equipment SKU count and cutting deployment costs by 25%. Standard APIs promote roaming so subscribers locate, authenticate and pay across brands just like cellular networks, pushing utilisation up and capex per kWh down [2]“IS 17017 (Part 2/Sec 7): 2023 Electric Vehicle Conductive Charging System,”, Bureau of Indian Standards, bis.gov.in.
Battery-Swapping-as-a-Service Integration with CaaS Hubs
Battery Smart’s 50 million swaps confirm that light-vehicle users pay for uptime. Integrating swap cabinets into charging yards lets operators sell premium speed alongside lower-priced overnight charge, boosting revenue per site while smoothing load curves[3]“Company Milestones,”, Battery Smart, batterysmart.com.
Restraints Impact Analysis*
| Restraint | (~) % Impact on CAGR Forecast | Geographic Relevance | Impact Timeline |
|---|---|---|---|
| High Above 50 kW DC capex | -4.8% | Nationwide; sharper in tier-2/3 markets | Short term (≤ 2 years) |
| Tier-2/3 Transformer Gaps | -3.6% | Tier-2/3 cities across regions | Medium term (2-4 years) |
| GST Credit Uncertainty | -2.9% | National | Short term (≤ 2 years) |
| Fragmented Land-Lease Rules | -2.1% | Urban jurisdictions with multi-agency approvals | Long term (≥ 4 years) |
| Source: Mordor Intelligence | |||
High Upfront Cost of Above 50 kW DC Chargers
Price tags of INR 0.5–1.5 million per unit lead operators to cherry-pick high-footfall metros, leaving peri-urban zones underserved. Equipment leasing and revenue-share deals lighten balance sheets yet raise lifetime costs, while second-life batteries built into chargers shave peak-demand fees by 20%.
Uncertain GST Input-Tax-Credit Eligibility on Charging Services
Divergent state rulings cloud cash-flow planning. Although Karnataka deemed charging a taxable service, mismatched interpretations elsewhere stall credit claims, tying up working capital. Finance Ministry consultations hint at harmonised norms, but the timing remains unclear[4]“GST Council Meeting Minutes on EV Ecosystem,”, Ministry of Finance, india.gov.in.
*Our forecasts treat driver/restraint impacts as directional, not additive. The impact forecasts reflect baseline growth, mix effects, and variable interactions.
Segment Analysis
By Charger Type: AC Dominance Yields to DC Acceleration
AC units delivered 59.18% of 2024 revenue thanks to low hardware cost and easy grid connection, making them the starter kit for tier-2 deployments. The India EV Charging As a Service market size anchored in AC is now ceding share to DC gear rising at 33.29% CAGR as uptime-sensitive fleets pay premium fees for 50–150 kW top-ups. Operators bundle both to balance utilisation, and Tata Power’s push to 400,000 points foreshadows more universal-standard, dual-gun cabinets that serve cars, vans and 2-wheelers alike.
DC’s margin uplift offsets its heavier capex because high-throughput sites host ancillaries—battery diagnostics, café concessions—that raise spend per visit. Dynamic pricing linked to grid congestion widens revenue streams, whereas AC tariffs increasingly float on renewable-hour discounts to stay competitive.


By Power Output: Level 2 Foundation Supports High-Power Growth
Level 2 (22–50 kW) units held 43.82% revenue in 2024, underpinning depot operations where vehicles idle overnight. The India EV Charging As a Service market share for ultra-high-power systems above 150 kW is modest today but will escalate fastest at 34.72% CAGR, fuelled by highway corridor mandates under the PM E-Drive scheme that earmarks INR 2,000 crore for 72,000 stations. Mixed-power yards let operators monetise both thrift-oriented users and time-sensitive truckers, driving higher energy-throughput per transformer upgrade.
By Fleet-Service Type: Logistics Leadership Faces Passenger Acceleration
Logistics and delivery commanded 40.25% revenue in 2024, locking in supply contracts for e-commerce giants. Passenger fleets, however, display 32.96% CAGR as ride-hailing platforms electrify to meet city mandates. The India EV Charging As a Service market size tied to passenger fleets thus jumps within metros, and operators craft membership tiers—flat-fee nightly depot access for taxis, pay-per-minute fast-charge for airport runs—to segment the base.

By End-Use: Semi-Public Foundations Enable Public Expansion
Semi-public depots—corporate parks, gated housing, fleet yards—control 58.19% revenue because asset owners share risk with operators. Public networks accelerate at 33.22% CAGR as roaming apps and unified QR billing remove friction. Asset-light franchises let property owners host public chargers on revenue share, cutting land-lease red tape and enlarging geographic spread beyond premium real estate.
Geography Analysis
West India led 32.34% of 2024 turnover as Maharashtra’s INR 1,993 crore policy grants 25% capital subsidies and mandates one highway charger every 25 km, ensuring floor--load utilisation. Gujarat’s port-industrial corridors add heavy-duty demand from container trucking fleets, while municipal fast-track portals in Mumbai reduce permit cycles to under 45 days.
North India ranks second, with Delhi’s fleet mandate spawning public points that anchor supra-regional roaming and create a springboard into Haryana and Uttar Pradesh. Depot-dense catchments attract software-defined operators whose AI engines schedule hundreds of taxi charges nightly, driving sustained power draw.
East & North-East India posts the strongest 34.37% CAGR outlook as states leapfrog legacy fuel stations. Lower land costs permit larger plots for integrated charging-swapping-parking hubs, though weaker grids necessitate battery-buffered cabinets. State renewable pacts promise green electrons, resonating with ESG-driven logistics tenders.
South India blends policy support with tech know-how. Karnataka waives demand charges for public chargers using more renewable power, trimming opex for operators buying solar directly from developers. Tamil Nadu’s auto cluster leads OEM-operator alliances supplying factory fleets, and Kerala’s strict time-of-day tariffs reward algorithmic scheduling that lowers delivered-kWh cost below grid parity.
The ev charging as a service market is analyzed by Mordor Intelligence across multiple other geographies, with in-depth regional assessments available for Europe. This is complemented by country-specific insights for China, South Korea, and United States, reflecting various localized market behavior and policy environments' coverage.
Competitive Landscape
The India EV Charging As a Service market hosts utilities, oil marketers, OEM-backed ventures and SaaS-centred start-ups. Tata Power EZ Charge tops volume with 400,000 points, exploiting distribution-utility synergies, bulk equipment buys and in-house load-balancing software. Statiq, backed by Shell, scales to 7,000 points by marrying location analytics with customer-centric apps. Oil majors IndianOil and BPCL retrofit petrol pumps into multi-energy hubs, bringing familiar retail frontage and captive land.
Infrastructure owners court fleet contracts; BluSmart’s vertically integrated 4,000-charger network pairs with Uber, turning infra into annuity revenue while lowering idle time for cabs. Battery Smart’s 1,400 swap stations create an alternate lane, enticing 2- and 3-wheelers that value two-minute swaps over 20-minute DC sessions. Foreign OEMs like Kia and Honda craft branded apps and e-swap services, stitching loyalty around proprietary vehicles yet still exposing APIs for roaming to comply with Bharat standards.
M&A momentum rises: larger incumbents acquire regional depot operators to secure land banks and customer books, while software players license white-label platforms to utilities needing digital billing, EV-SEMS and predictive maintenance.
India EV Charging As A Service Industry Leaders
Tata Power
Fortum
Statiq
ChargeZone
Ather
- *Disclaimer: Major Players sorted in no particular order

Recent Industry Developments
- July 2025: Kia introduced K-Charge via the MyKia app, unlocking access to 11,000 chargers nationwide with an expansion target of 20,000 by mid-2026.
- June 2025: Ather Energy doubled its retail footprint and service centres, further fusing scooter sales with proprietary charging grids.
- March 2025: Kerala enforced solar-hour tariffs of INR 5 per unit for EV charging, slashing costs during daylight windows.


India EV Charging As A Service Market Report Scope
| AC Chargers |
| DC Chargers |
| Level 1 / AC (Below 22 kW) |
| Level 2 (22 - 50 kW) |
| Fast (50 -150 kW) |
| High-Power (Above 150 kW) |
| Company Vehicles & Motor Pools |
| Delivery and Logistics |
| Passenger Fleets (Ride-hailing, Corporate Cabs) |
| Semi-Public Charging Setup (Depots, Campuses) |
| Public Charging Setup (Highways, Urban Hubs) |
| North India (Delhi, Haryana, Punjab, UP, etc.) |
| West India (Maharashtra, Gujarat, Goa, etc.) |
| South India (Karnataka, Tamil Nadu, Telangana, etc.) |
| East & North-East India (WB, Odisha, Assam, etc.) |
| By Charger Type | AC Chargers |
| DC Chargers | |
| By Power Output | Level 1 / AC (Below 22 kW) |
| Level 2 (22 - 50 kW) | |
| Fast (50 -150 kW) | |
| High-Power (Above 150 kW) | |
| By Fleet-Service Type | Company Vehicles & Motor Pools |
| Delivery and Logistics | |
| Passenger Fleets (Ride-hailing, Corporate Cabs) | |
| By End-Use | Semi-Public Charging Setup (Depots, Campuses) |
| Public Charging Setup (Highways, Urban Hubs) | |
| By Geography (States & UTs) | North India (Delhi, Haryana, Punjab, UP, etc.) |
| West India (Maharashtra, Gujarat, Goa, etc.) | |
| South India (Karnataka, Tamil Nadu, Telangana, etc.) | |
| East & North-East India (WB, Odisha, Assam, etc.) |


Key Questions Answered in the Report
What is the projected value of the India EV Charging As a Service market by 2030?
The market is forecast to reach USD 63.55 million by 2030, growing at a 32.35% CAGR from 2025.
Which fleet segment currently drives the highest revenue for charging-as-a-service providers?
Delivery and logistics fleets contribute 40.25% of 2024 revenue, benefiting from e-commerce electrification mandates.
Which charger type is gaining share the fastest?
DC fast chargers are expanding at a 33.29% CAGR as operators chase higher-margin, quick-turnaround services.
Why is West India leading adoption?
Maharashtra’s capital subsidies and mandatory highway chargers combined with Gujarat’s industrial corridors create strong demand and favourable economics.
How do time-of-day tariffs impact operating costs?
States like Kerala offer daytime solar rates nearly 46% lower than peak hours, enabling operators to optimize charging schedules and boost margins.
Page last updated on:


