Germany EV Charging Infrastructure Market Size and Share
Market Overview
| Study Period | 2020 - 2031 |
|---|---|
| Forecast Data Period | 2026 - 2031 |
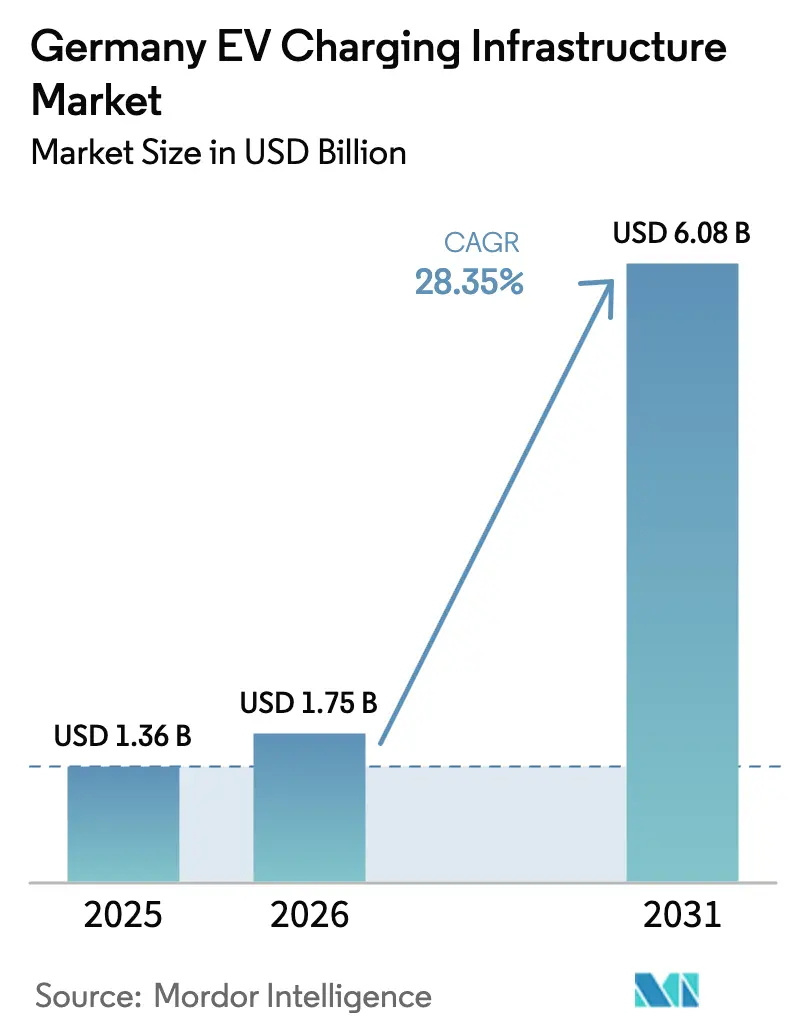
| Base Year Market Size (2025) | USD 1.36 Billion |
| Market Size (2026) | USD 1.75 Billion |
| Market Size (2031) | USD 6.08 Billion |
| Growth Rate (2026 - 2031) | 28.35% CAGR |
| Market Concentration | Medium |
Major Players
*Disclaimer: Major Players sorted in no particular order Image © Mordor Intelligence. Reuse requires attribution under CC BY 4.0. |
|
Germany EV Charging Infrastructure Market Analysis by Mordor Intelligence
German EV charging infrastructure market size in 2026 is estimated at USD 1.75 billion, growing from 2025 value of USD 1.36 billion with 2031 projections showing USD 6.08 billion, growing at 28.35% CAGR over 2026-2031. Germany’s mandate to deploy 1 million additional charging points, its leadership in European vehicle production, and the rapid fall in per-kilometer charging costs are combined to accelerate deployment velocity across public and private sites. Commercial corridors and retail destinations capture the highest near-term investment flows, while condominium modernization funding unlocks unmet residential demand. National policy coordination through the Masterplan Ladeinfrastruktur II guarantees fast-charging coverage every 60 km on TEN-T routes, effectively de-risking high-power projects. Parallel improvements in grid-service revenues, such as frequency regulation and peak shaving, improve project economics for operators that integrate vehicle-to-grid functionality. Connector standardization around CCS2 and emerging megawatt chargers for heavy vehicles further reinforces Germany’s role as a technology testbed.
Key Report Takeaways
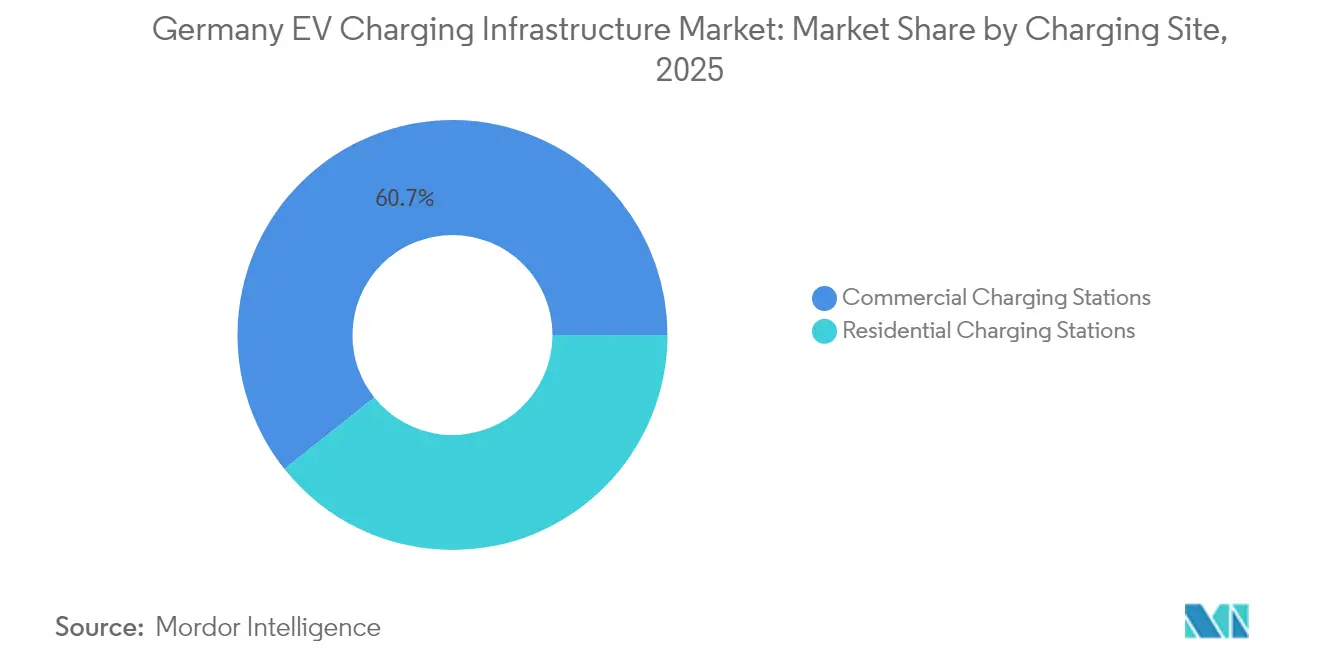
- By charging site, commercial locations led with 60.72% of the German EV charging infrastructure market share in 2025, while residential installations are projected to expand at a 28.84% CAGR to 2031.
- By charger type, AC systems accounted for 55.62% of the German EV charging infrastructure market size in 2025, whereas ultra-fast DC systems above 150 kW recorded the fastest 30.02% CAGR through 2031.
- By power output, ≤22 kW chargers held 55.91% share of the German EV charging infrastructure market size in 2025; chargers above 150 kW are advancing at a 30.68% CAGR through 2031.
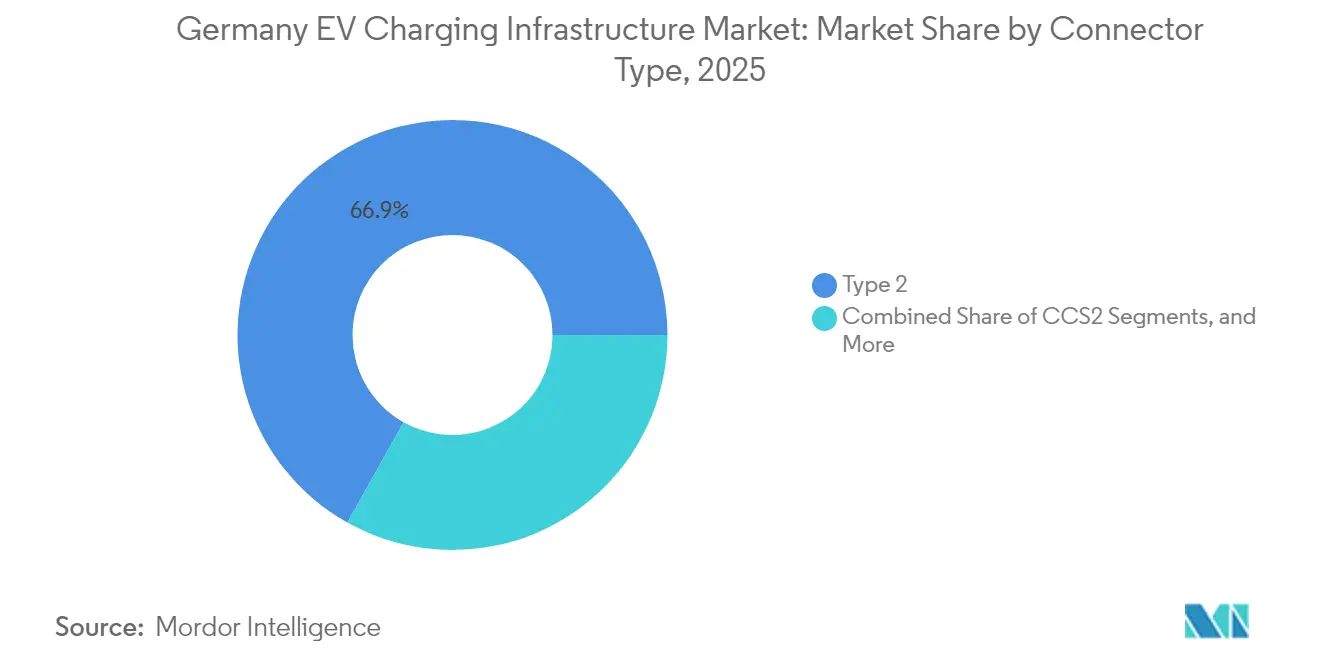
- By connector, Type 2 dominated with 66.87% of the German EV charging infrastructure market share in 2025 as CCS2 posts a 31.05% CAGR through 2031.
- By mounting configuration, wall-mounted units commanded a 56.48% of the German EV charging infrastructure market share in 2025, while pedestal systems posted the highest 31.02% CAGR through 2031.
- By vehicle type, passenger cars represented 75.88% of the German EV charging infrastructure market share in 2025, and medium-to-heavy trucks delivered the fastest 31.08% CAGR through 2031.
- By German federal state, Bavaria led with a 31.05% of the German EV charging infrastructure market share in 2025, whereas North Rhine-Westphalia achieved a 28.96% CAGR through 2031.
Note: Market size and forecast figures in this report are generated using Mordor Intelligence’s proprietary estimation framework, updated with the latest available data and insights as of 2026.
Germany EV Charging Infrastructure Market Trends and Insights
Drivers Impact Analysis*
| Driver | (~) % Impact on CAGR Forecast | Geographic Relevance | Impact Timeline |
|---|---|---|---|
| National Policy Targets (Masterplan LIS II) | +8.2% | National; focus on TEN-T corridors | Medium term (2–4 years) |
| Growing BEV Adoption Rates | +7.1% | Urban hubs in Bavaria, NRW, Baden-Württemberg | Short term (≤ 2 years) |
| Private-Utility Investment Boom | +5.8% | Nationwide retail corridors and logistics hubs | Medium term (2–4 years) |
| Grid-Services Revenue (V2G, Load Balancing) | +3.4% | Urban centers and congested industrial zones | Long term (≥ 4 years) |
| Condominium Modernization Funding (WEG) | +2.9% | Apartment-dense districts in Berlin and Hamburg | Short term (≤ 2 years) |
| Freight-Corridor Electrification Incentives | +2.1% | Rhine-Alpine and North Sea-Baltic freight lanes | Long term (≥ 4 years) |
| Source: Mordor Intelligence | |||
National Policy Targets (Masterplan Ladeinfrastruktur II)
Germany is committed to building a nationwide EV charging network. Through the Deutschlandnetz initiative, the government invests heavily in fast-charger deployment to ensure reliable and widespread accessibility for EV users. These targets enhance consumer confidence and drive private-sector participation, accelerating the shift to electric mobility. Mandatory 60 km fast-charging intervals on TEN-T routes shift deployment from market-led clustering to systematic coverage, stabilizing demand for high-power hardware. Federal-state program stacking, such as Baden-Württemberg’s Charge@BW, minimizes funding gaps and drives procurement scale economies. The resulting certainty in utilization encourages private operators to invest in 400–600 kW equipment despite higher capex. Local permitting agencies increasingly mirror federal targets, reducing approval lead times and lowering project risk.
Growing BEV Adoption Rates
Q1 2025 battery-electric registrations attained record highs, with total-cost-of-ownership parity versus combustion vehicles tipping decisively in favor of EVs[1]"Quarterly EV Registration Report", Bundesverband der Energie- und Wasserwirtschaft (BDEW), bdew.de. Each incremental EV lifts average daily charging demand, reinforcing the feedback loop between infrastructure expansion and vehicle sales. Commercial fleet electrification exerts an outsized load on public networks because vans and trucks draw higher currents and occupy bays longer. Urban-rural adoption asymmetry shapes investment logic: metropolitan areas prioritize home and workplace chargers, while intercity corridors prioritize ultra-fast hubs to support weekend and holiday travel surges. Automakers’ sales targets for 2030 create a predictable pipeline of EVs that underpins multi-year volume forecasts for charging operators.
Private-Utility Investment Boom
Partnerships such as EnBW-REWE and Vattenfall’s retail collaborations align grid expertise with high-footfall real estate, shortening site-acquisition cycles and tapping existing customer bases. Utilities use their balance sheets to co-finance transformers and cable upgrades, lowering total capex per charger compared to independent operators. Business models are shifting toward bundled energy services, where load balancing, on-site storage, and dynamic tariffs generate ancillary revenue. Rural sites, previously unbankable due to low utilization, now attract investment because utilities can cross-subsidize through regulated returns on grid assets. Sustained growth remains contingent on tariff structures that allow cost recovery without distorting competition.
Freight-Corridor Electrification Incentives
EU Fit-for-55 mandates obligate member states to deploy megawatt charging systems along core freight corridors, a requirement that Germany is fast-tracking through combined federal and EU funding. Rhine-Alpine and North Sea-Baltic routes see priority placement of MCS-ready sites to support long-haul truck pilots launching in 2026. Early installations integrate liquid-cooled cables and dedicated transformers, raising capex but ensuring compatibility with emerging truck chargers. Logistics operators view corridor consistency as pivotal for route planning, encouraging co-investment models where fleets commit to minimum volumes in exchange for discounted tariffs. Full commercial rollout stretches toward 2030 as truck production scales and power-class standards finalize.
Restraints Impact Analysis*
| Restraint | (~) % Impact on CAGR Forecast | Geographic Relevance | Impact Timeline |
|---|---|---|---|
| High Install and Grid-Upgrade Costs | -4.7% | Nationwide; acute in rural and heritage zones | Medium term (2–4 years) |
| Urban Grid-Capacity Bottlenecks | -3.2% | Berlin, Munich, Hamburg | Short term (≤ 2 years) |
| Heritage-Site Permitting Delays | -1.8% | Historic districts nationwide | Medium term (2–4 years) |
| Cyber-Security Compliance Costs (IT-Sig 3.0) | -1.4% | Nationwide; heavier burden on small operators | Short term (≤ 2 years) |
| Source: Mordor Intelligence | |||
Urban Grid-Capacity Bottlenecks
Grid limitations increasingly constrain urban fast-charging expansion. Distribution system operators in major cities report that many proposed sites face capacity bottlenecks, challenging the deployment of high-powered chargers at scale. Medium-voltage feeders often lack spare headroom during evening peak demand, the window when commuters require charging. Interim mitigations—smart charging, battery buffering, and time-of-use pricing—can defer but not eliminate the need for reinforcement. DSOs presently coordinate upgrades on a project-by-project basis, stretching lead times. Policy discussions are underway to integrate charging infrastructure planning into urban development plans, but alignment on funding responsibility between municipalities, DSOs, and private operators remains unresolved.
Heritage-Site Permitting Delays
Germany’s Denkmalschutz regulations obligate developers to prepare visual-impact assessments and sometimes procure bespoke charger housings to match historical aesthetics. Approval cycles extend 6–18 months beyond standard procedures[2]“Heritage Preservation and Urban EV Charging,”, Electrive, electrive.com. The cost penalty deters operators from targeting high-footfall tourist centers, although those locations would otherwise offer attractive utilization rates. Municipalities introducing pre-approved design catalogs report shorter timelines, yet these remain exceptions. Stakeholder engagement with preservation authorities early in the planning process is becoming a best practice to avoid redesign loops.
*Our forecasts treat driver/restraint impacts as directional, not additive. The impact forecasts reflect baseline growth, mix effects, and variable interactions.
Segment Analysis
By Charging Site: Commercial Dominance Drives Market Expansion
Commercial sites accounted for 60.72% of the German EV charging infrastructure market share in 2025, propelled by highway corridors, retail destinations, and logistics hubs. Utilization rates at these locations reach 20–25 sessions daily, supporting profitable tariff structures even after grid-upgrade outlays. Fleet electrification, notably among logistics providers, fuels demand for dedicated depots with ≥350 kW dispensers and onsite storage. Destination charging at hotels and supermarkets leverages dwell times of 60–120 minutes, enabling operators to deploy mid-power 50–150 kW units and capture incremental retail spend.
Residential installations are scaling rapidly at a CAGR of 28.84% through 2031, as WEG reforms remove legal barriers in multi-unit buildings, although project coordination among apartment owners prolongs timelines. Private homes maintain high adoption where parking spaces and main-panel capacity are readily available. Collectively, the residential segment expands at 28.84% CAGR, its growth outpacing the larger commercial base but starting from a smaller installed-socket count. The shift rebalances load profiles toward overnight hours, which may ease some urban grid stress but heightens the need for smart-charging algorithms.


By Charger Type: AC Foundation Supports DC Transition
AC chargers continued to represent 55.62% of the German EV charging infrastructure market size 2025, favored for low capex and seamless integration with existing three-phase electrical systems. Workplace and residential settings, where vehicles remain parked nearly 8 hours, rely on 11–22 kW AC outlets that minimize grid-reinforcement needs. Equipment lifecycles of above 10 years and mature standards ensure predictable maintenance profiles.
DC fast chargers above 150 kW post a 30.02% CAGR through 2031, as automakers launch higher-voltage battery systems enabling 270–350 kW peak intake. Intercity routes now host 400 kW-capable dispensers, reducing 10–80% charge times to 15–20 minutes. The hardware incorporates liquid-cooled cables and larger power modules, keeping unit prices high but achieving better revenue per connector. Mid-power 50–150 kW DC units address Tier-2 cities and suburban commercial centers, offering a compromise between installation cost and driver convenience.
By Power Output: Ultra-Fast Growth Reshapes Infrastructure
Chargers up to 22 kW held 55.91% of the German EV charging infrastructure market size in 2025 because they align with standard building circuits and satisfy overnight charging needs. Retail parking lots increasingly allocate 20–40 bays to 22 kW posts, leveraging customers’ 2–3-hour dwell time.
Ultra-fast systems exceeding 150 kW exhibit a 30.68% CAGR through 2031, spearheaded by operators such as IONITY that commissioned 600 kW HYC1000 dispensers in 2025 . High-power clusters along the A8 and A9 autobahns feature 12–24 ultra-fast stalls, supported by dedicated 5–10 MVA grid connections and, in some cases, onsite battery storage. Intermediate ranges of 23–99 kW and 100–150 kW remain relevant in peri-urban contexts where site power is constrained but a faster turnaround is desired than AC can offer.
By Connector Type: CCS2 Momentum Challenges Type 2 Leadership
Type 2 plugs dominated AC charging, with 66.87% of the German EV charging infrastructure market size in 2025. They were the beneficiaries of early European standardization and broad OEM support. The connector supports 3-phase AC at 22 kW and remains the default for residential and workplace chargers.
CCS2’s dual AC/DC capability underpins its 31.05% CAGR through 2031, with every major European OEM adopting it for new models. The plug’s forward compatibility with 500 A pins makes it suitable for up to 350 kW delivery, removing the need for separate vehicle inlets. Operators transitioning legacy CHAdeMO bays to CCS2 improve utilization and reduce maintenance complexity. Tesla’s retrofit of its Supercharger network with CCS2 adapters expands network accessibility to non-Tesla drivers, further solidifying the standard’s dominance trajectory.
By Mounting Configuration: Wall-Mounted Efficiency Meets Pedestal Growth
Wall-mounted units, at 56.48% of the German EV charging infrastructure market size in 2025, remain the default for private garages and commercial buildings with adjacent walls. Installation leverages existing infrastructure, typically requiring only cable runs of nearly 10 m, which keeps average total costs under EUR 2,000 for 11 kW units.
Pedestal chargers deliver a 31.02% CAGR through 2031, underpinning the expansion of high-traffic public sites and parking lots lacking suitable walls. The design accommodates multiple cable lengths and integrated cooling necessary for up to 150 kW DC hardware. Municipalities prefer pedestal mounts for curbside rollouts where wall mounting is impossible. Pantograph systems occupy a niche within bus and depot charging but attract growing interest as zero-emission mandates extend to public transport.
By Vehicle Type: Passenger Dominance Masks Commercial Growth
Passenger cars accounted for 75.88% of the German EV charging infrastructure market size in 2025, reflecting strong consumer adoption and mature charging standards. Utilization patterns are predictable, facilitating load-management algorithms optimized for commuting schedules.
Medium- and heavy-duty trucks accelerate at 31.08% CAGR through 2031, driven by tightening emission standards and the arrival of battery-electric long-haul models rated for 600–950 kW charging. Depot chargers integrate with fleet telematics, allowing operators to schedule charges during grid-friendly periods. Light commercial vans straddle consumer and freight use cases, increasing daytime demand at urban depots. Buses and coaches, enabled by overnight depot charging and opportunity charging at terminals, generate predictable load profiles that grid operators can plan for years in advance.
Geography Analysis
Bavaria’s 31.05% of the German EV charging infrastructure market size in 2025 stems from its automotive cluster, proactive subsidy programs, and integration of chargers into cross-border Alpine transport routes. The state’s mix of high-income urban centers and rural tourist areas demands a diverse charger portfolio. Highway sites on the A8 and A9 employ ≥350 kW units to serve Munich-Stuttgart and Munich-Salzburg corridors. In comparison, city centers encourage ≥22 kW AC posts in underground garages to mitigate street-level congestion. Rural guesthouses exploit federal micro-subsidies for 11 kW wall boxes, capturing EV-tourist traffic during ski season.
North Rhine-Westphalia, Germany’s industrial heartland, now experiences the sharpest growth at 28.96% CAGR through 2031, as municipalities fast-track permits under the Elektromobilität.NRW roadmap. Duisburg and Cologne pilot megawatt chargers at intermodal freight hubs, while Düsseldorf airport deploys 400 kW bays for ride-hailing fleets. DSOs coordinate grid reinforcements with renewable-energy developers, integrating 10–20 MW solar farms to supply new charging clusters. Urban density drives high bay rotation rates, ensuring faster payback periods despite elevated land costs.
Baden-Württemberg, Berlin, and Hamburg contribute niche dynamics. Stuttgart’s OEMs deploy private depot chargers exceeding 500 kW to demonstrate next-generation prototypes. Berlin’s apartment-heavy landscape channels funding toward shared garage retrofits with load-balancing software that caps simultaneous amperage draw. Hamburg’s port operations add shore-power experience to heavy-vehicle charging design, piloting 1 MW dispensers for drayage trucks. Northern states such as Lower Saxony capitalize on wind-power surpluses to run nearly carbon-neutral charging parks, pairing 15 MWh batteries with on-site wind turbines for peak-shaving services.
Competitive Landscape
Market concentration remains moderate as EnBW leads with a large number of fast-charging points and alliances with retailers such as REWE and NIO battery-swap trials. The Spark consortium—linking IONITY, Fastned, Atlante, and Electra—pools procurement and roaming back-ends to rival EnBW’s scale advantages.
Technology differentiation is intensifying around ultra-fast platforms. Grid-integrated models that bundle storage and demand response increasingly shape tenders, favoring energy companies capable of multi-product offerings. Rural coverage gaps attract infrastructure funds willing to accept longer paybacks in exchange for quasi-monopoly positions.
Cybersecurity compliance, a costly barrier for small networks, accelerates consolidation. Operators with in-house IT departments secure ISO 27001 and meet IT-Sig 3.0 more easily, widening competitive moats. New entrants from the software domain offer asset-light “network-operating-system” platforms, monetizing via SaaS fees rather than hardware margin. Automakers participate selectively: Mercedes-Benz invests in branded hubs adjacent to dealerships, and Volkswagen’s Elli division focuses on home-charging bundles that cross-sell energy tariffs.
Germany EV Charging Infrastructure Industry Leaders
-
EnBW Baden Württemberg AG
-
Ionity GmbH
-
Tesla Inc.
-
Allego B.V.
-
Shell Plc
- *Disclaimer: Major Players sorted in no particular order


Recent Industry Developments
- April 2025: IONITY, a European ultra-fast electric vehicle charging provider, announced its procurement of Alpitronic's new HYC1000 chargers, becoming the first charge point operator to implement these systems. The megawatt charging system consists of a central Power Cabinet that distributes power to four dispensers, each containing two charge points.
- February 2025: E.ON and the German Institute for Federal Real Estate (BImA) have partnered to expand Germany's charging infrastructure. Under this agreement, E.ON will install 7,000 new electric vehicle charging points on federal property managed by BImA by the second quarter of 2027.


Germany EV Charging Infrastructure Market Report Scope
EV charging infrastructure is the network of devices and systems that supply electricity to electric vehicles (EVs).
The Germany EV charging infrastructure market is segmented by commercial charging stations (destination charging stations, highway charging stations, bus charging stations, fleet charging stations, and other charging stations), residential charging stations (private houses and apartments), and by type (DC high power, DC low power, and AC).
The report offers market size and forecasts for Germany's EV charging infrastructure market in value (USD) for all the above segments.
| Commercial Charging Stations | Destination Charging Stations |
| Highway Charging Stations | |
| Bus Charging Stations | |
| Fleet Charging Stations | |
| Other Commercial Sites | |
| Residential Charging Stations | Private Houses |
| Apartments |
| DC High Power (Up to 150 kW) |
| DC Low Power (50 - 150 kW) |
| AC (Below 22 kW) |
| Up to 22 kW |
| 23-99 kW |
| 100-150 kW |
| Above 150 kW (Ultra-fast) |
| CCS2 |
| Type 2 |
| CHAdeMO |
| Tesla (V3) |
| Others |
| Wall-mounted |
| Pedestal / Stand-alone |
| Pantograph |
| Passenger Cars |
| Light Commercial Vehicles |
| Buses and Coaches |
| Medium and Heavy Trucks |
| Baden-Wurttemberg |
| Bavaria |
| Berlin |
| Brandenburg |
| Bremen |
| Hamburg |
| Hesse |
| Lower Saxony |
| Mecklenburg-Western Pomerania |
| North Rhine-Westphalia |
| Rhineland-Palatinate |
| Saarland |
| Saxony |
| Saxony-Anhalt |
| Schleswig-Holstein |
| Thuringia |
| By Charging Site | Commercial Charging Stations | Destination Charging Stations |
| Highway Charging Stations | ||
| Bus Charging Stations | ||
| Fleet Charging Stations | ||
| Other Commercial Sites | ||
| Residential Charging Stations | Private Houses | |
| Apartments | ||
| By Charger Type | DC High Power (Up to 150 kW) | |
| DC Low Power (50 - 150 kW) | ||
| AC (Below 22 kW) | ||
| By Power Output | Up to 22 kW | |
| 23-99 kW | ||
| 100-150 kW | ||
| Above 150 kW (Ultra-fast) | ||
| By Connector Type | CCS2 | |
| Type 2 | ||
| CHAdeMO | ||
| Tesla (V3) | ||
| Others | ||
| By Mounting Configuration | Wall-mounted | |
| Pedestal / Stand-alone | ||
| Pantograph | ||
| By Vehicle Type | Passenger Cars | |
| Light Commercial Vehicles | ||
| Buses and Coaches | ||
| Medium and Heavy Trucks | ||
| By Federal State | Baden-Wurttemberg | |
| Bavaria | ||
| Berlin | ||
| Brandenburg | ||
| Bremen | ||
| Hamburg | ||
| Hesse | ||
| Lower Saxony | ||
| Mecklenburg-Western Pomerania | ||
| North Rhine-Westphalia | ||
| Rhineland-Palatinate | ||
| Saarland | ||
| Saxony | ||
| Saxony-Anhalt | ||
| Schleswig-Holstein | ||
| Thuringia | ||


Key Questions Answered in the Report
Which state is growing fastest in charger rollout?
North Rhine-Westphalia posts the fastest 28.96% CAGR through 2031 due to coordinated industrial and municipal programs.
What power class is expanding quickest?
Ultra-fast chargers above 150 kW show a 30.68% CAGR as automakers release high-voltage vehicles and freight corridors demand rapid turnarounds.
How are operators offsetting high grid-upgrade costs?
They increasingly bundle battery storage, demand-response revenue and utility partnerships to spread costs across multiple income streams.
Are residential chargers still mostly AC?
Yes, 11–22 kW AC wall boxes remain the norm for homes and apartment garages because they integrate easily with existing circuits and overnight parking patterns.
Page last updated on:


