China EV Charging-as-a Service Market Size and Share
Market Overview
| Study Period | 2019 - 2030 |
|---|---|
| Forecast Data Period | 2025 - 2030 |
| Historical Data Period | 2019 - 2023 |
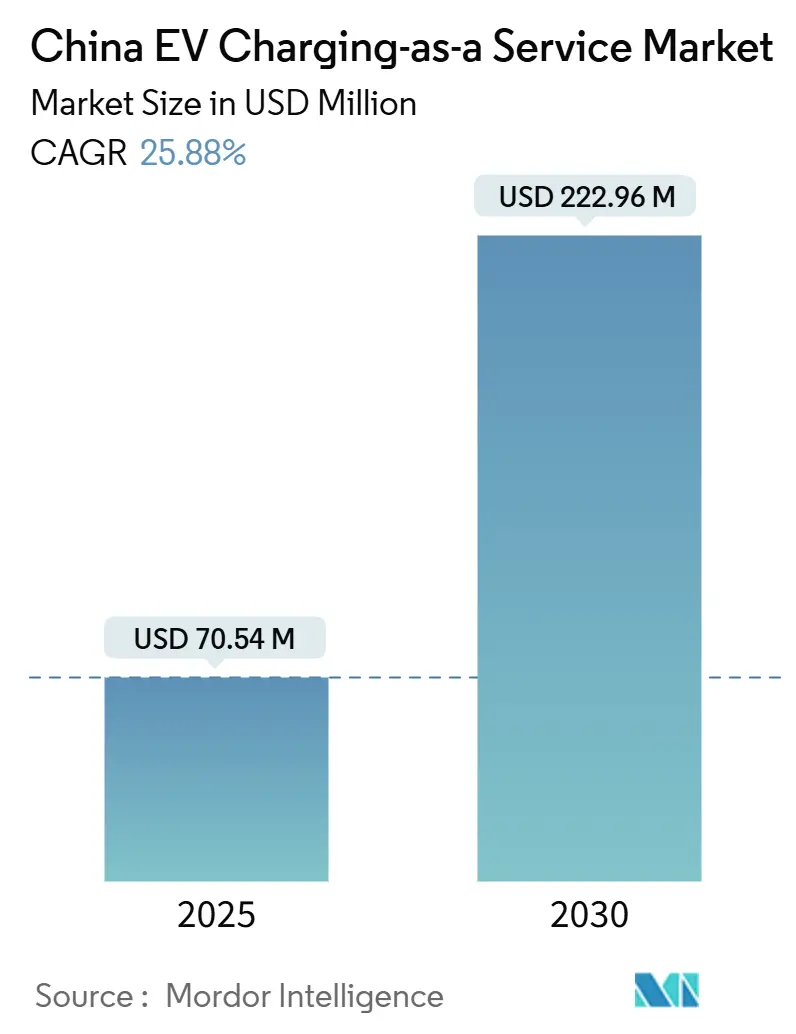
| Market Size (2025) | USD 70.54 Million |
| Market Size (2030) | USD 222.96 Million |
| Growth Rate (2025 - 2030) | 25.88% CAGR |
| Market Concentration | Medium |
Major Players *Disclaimer: Major Players sorted in no particular order Image © Mordor Intelligence. Reuse requires attribution under CC BY 4.0. | |
China EV Charging-as-a Service Market Analysis by Mordor Intelligence
The China EV Charging as a Service market size stood at USD 70.54 million in 2025 and is forecast to reach USD 222.96 million by 2030, advancing at a 25.88% CAGR. Robust policy subsidies, expanding e-commerce logistics, and investor appetite for public-private partnership projects have positioned the China EV Charging as a Service market as one of the world’s fastest-growing subscription-based charging ecosystems. Record grid investments by State Grid and local tariff incentives for depot DC fast charging are accelerating infrastructure roll-outs, while OEM-integrated networks such as Tesla’s V4 and BYD’s super-fast chargers intensify competition. CaaS operators differentiate through AI-driven load balancing, guaranteed overnight availability, and bundled battery-swap options that reduce fleet downtime. Regional disparities persist, yet targeted deployment in tier-1 city low-emission zones supports high utilization rates, offsetting transformer congestion costs and volatile spot electricity prices.
Key Report Takeaways
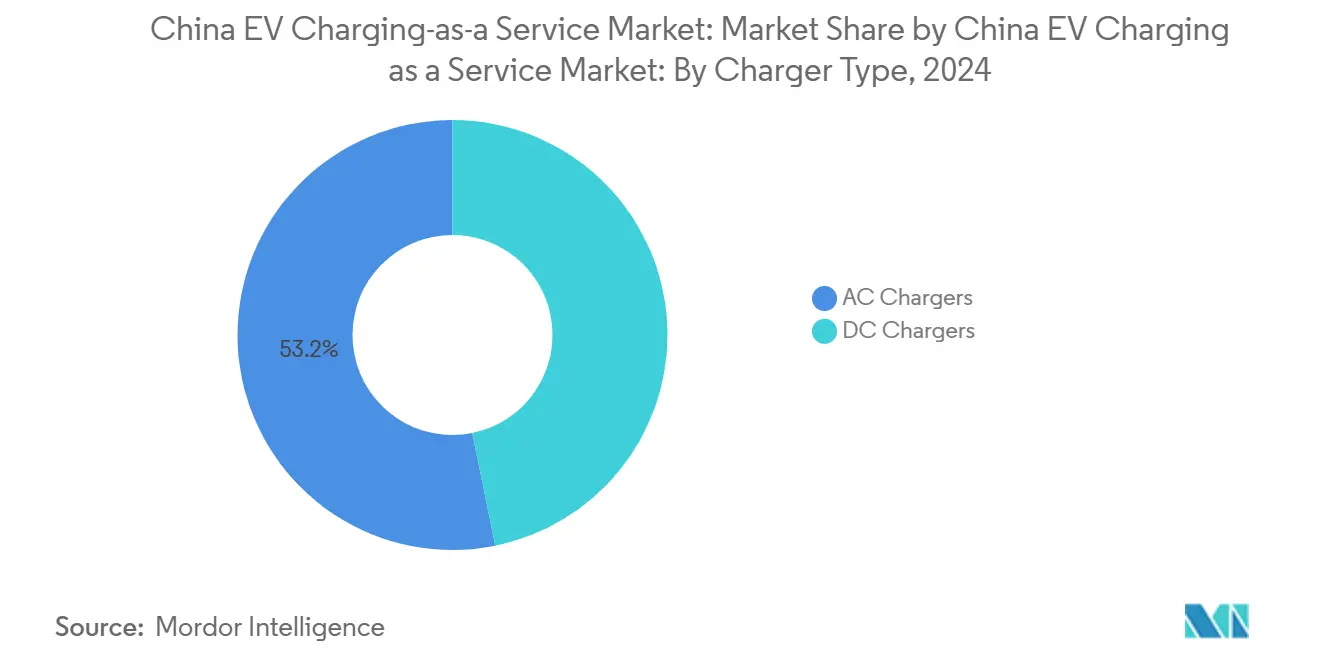
- By charger type, AC infrastructure led the China EV Charging as a Service market with a 53.18% share in 2024; DC fast chargers are projected to expand at a 27.26% CAGR through 2030.
- By fleet service type, company vehicles and motor pools captured a 39.25% share of the China EV Charging as a Service market size in 2024, while delivery and logistics fleets are advancing at a 28.23% CAGR to 2030.
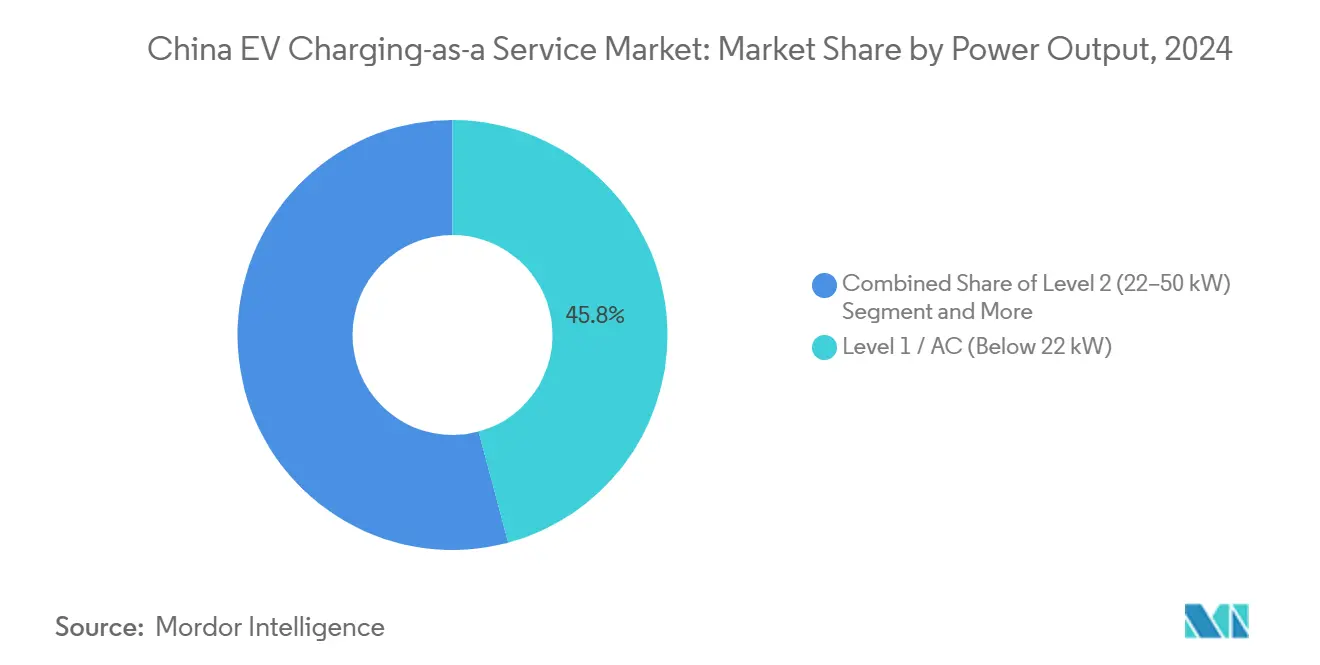
- By power output, Level 1 systems had a 45.82% share of the China EV Charging as a Service market in 2024; high-power chargers above 150 kW are growing at a 29.37% CAGR through 2030.
- By end use, public setups accounted for 67.43% of the China EV Charging as a Service market size in 2024, whereas semi-public installations are forecast to grow at a 26.22% CAGR over the same horizon.
Worldwide, activity is shaped by contributions from multiple countries and regions, with China representing one among them. The global report on ev charging as a service market by Mordor Intelligence reflects how these countries and regional layers combine into a single system.
China EV Charging-as-a Service Market Trends and Insights
Drivers Impact Analysis*
| Driver | (~) % Impact on CAGR Forecast | Geographic Relevance | Impact Timeline |
|---|---|---|---|
| Depot DC Fast-Charge Subsidies | +4.2% | National, concentrated in tier-1 cities | Medium term (2-4 years) |
| Same-Day Delivery Overnight Demand | +3.8% | Urban centers, logistics corridors | Short term (≤ 2 years) |
| PPP-Backed Semi-Public Rollouts | +3.1% | National, focus on highway networks | Medium term (2-4 years) |
| Urban Low-Emission Fleet Shift | +2.9% | Beijing, Shanghai, Shenzhen, Guangzhou | Short term (≤ 2 years) |
| AI Load Balancing Savings | +2.7% | Tier-1 cities, industrial zones | Long term (≥ 4 years) |
| Battery-Swap Bay Standards | +2.4% | National, emphasis on commercial districts | Long term (≥ 4 years) |
| Source: Mordor Intelligence | |||
Government Subsidies and Tariff Incentives for Depot DC Fast Charging
National Development and Reform Commission subsidy frameworks reduce capital outlays for high-power depot chargers and grant off-peak tariff discounts that align with fleet charging windows [1]“Guiding Opinions on High-Quality Development of Distribution Networks,”, National Development and Reform Commission, NDRC.GOV.CN. Streamlined local permitting and land-use concessions allow CaaS operators to scale dense depots that serve multiple trucks simultaneously, improving margin profiles. Accelerated depreciation schedules further lower ownership costs, enabling competitive subscription pricing. The combined incentives strengthen the China EV Charging as a Service market by anchoring large anchor loads in logistics hubs, attracting private investment. The multiplier effect lifts equipment demand while compressing payback periods for operators.
E-Commerce Same-Day Delivery Boom Requiring Overnight Fleet Charging
China’s courier sector processed more than 172 billion parcels in 2024, and same-day delivery is now a standard promise in tier-1 cities [2]“Transport and Logistics Cost Reduction Action Plan,”, Ministry of Transport, MOT.GOV.CN. CaaS providers guarantee reserved slots and priority queuing as premium service tiers. Fleets accept higher subscription fees because missed drop-offs incur stiff penalties from online platforms. Overnight charging also coincides with regional wind-power oversupply, helping grid operators level demand. In practice, subscription contracts link fleet KPIs to charger uptime, cementing long-term service stickiness and underpinning the China EV Charging as a Service market growth trajectory.
PPP Financing Models Enabling Rapid Semi-Public Charger Rollout
China reported 33,000 charging piles in expressway service areas by Nov 2024, +12,000 vs end-2023[3]“China will further enhance NEV charging facilities,”, Xinhua News Agency, NEWS.CN. Concession agreements assure minimum traffic volumes, lowering demand-risk premiums for investors. Revenue-sharing formulas index returns to kilowatt-hour throughput, incentivizing efficient operations. Semi-public sites bridge urban and intercity logistics, lifting utilization rates across mixed user pools. The model spreads CAPEX and aligns incentives, accelerating national coverage while sustaining attractive internal rates of return for private CaaS developers.
Standardization of Battery-Swap-Ready Parking Bays
CATL and Sinopec plan 500 swap stations in 2025 and target 10,000 long term, establishing design blueprints for parking geometry, robotics interfaces, and digital billing. Uniform bay layouts enable multi-brand battery modules and streamline permitting. CaaS firms integrate swap lanes alongside plug-in stalls, allowing fleet operators to choose between five-minute swaps or conventional charging. Standardization reduces construction variance costs and smooths user experience, creating a new competitive lever for service differentiation in the China EV Charging as a Service market.
Restraints Impact Analysis*
| Restraint | (~) % Impact on CAGR Forecast | Geographic Relevance | Impact Timeline |
|---|---|---|---|
| Volatile Electricity Pricing | -3.2% | National, acute in industrial regions | Medium term (2-4 years) |
| Urban Transformer Congestion | -2.8% | Beijing, Shanghai, Shenzhen, Guangzhou | Short term (≤ 2 years) |
| OEM Network Cannibalization | -2.6% | National, concentrated in premium segments | Medium term (2-4 years) |
| Depot Land Limits | -2.1% | Urban logistics corridors, tier-1 cities | Long term (≥ 4 years) |
| Source: Mordor Intelligence | |||
Volatile Spot Electricity Prices Eroding CaaS Profit Margins
From June 2025, renewable projects must clear through spot markets, widening hourly price spreads[4]“Notice on Deepening Market-Based Pricing of New Energy,”, National Development and Reform Commission, NDRC.GOV.CN. Fixed-rate subscriptions become riskier as input costs fluctuate. Larger providers hedge through bilateral forwards, while smaller players lack credit lines and face margin compression. Dynamic pricing engines pass through some volatility to fleets, but contract renegotiations raise customer churn risk, dampening revenue visibility in the China EV Charging as a Service market.
OEM-Integrated Charging Networks Cannibalizing Utilization Rates
Tesla, BYD, and NIO prioritize captive drivers on proprietary networks, diverting throughput from independent CaaS stations. Lower traffic translates into under-utilized assets and depressed ROI for stand-alone operators. Interoperability mandates mitigate the risk, yet brand loyalty and app-based booking friction persist. Independent operators counter with broader geographic coverage and AI-enabled pricing promotions to win fleet contracts.
*Our forecasts treat driver/restraint impacts as directional, not additive. The impact forecasts reflect baseline growth, mix effects, and variable interactions.
Segment Analysis
By Charger Type: AC Leads, Yet DC Surges on High-Power Demand
AC units held 53.18% China EV Charging as a Service market share in 2024 thanks to their cost advantage for overnight fleet charging. Depot managers favor 7–22 kW wall-boxes that tap existing three-phase circuits, avoiding transformer upgrades. However, DC fast chargers are growing at a 27.26% CAGR as intercity logistics fleets need 30-minute top-ups during daytime turns. The hybrid depot model—30 AC posts for vans and 10 DC stalls for express trucks—maximizes asset utilization. OEM breakthroughs such as CATL’s Shenxing battery, which adds 520 km in five minutes, push demand for 400 kW liquid-cooled dispensers. CaaS planners pre-lay oversized conduits to future-proof sites, reducing retrofit downtime. Despite higher CAPEX, DC lanes attract premium pricing, lifting blended margins. Equipment makers bundle maintenance and software, easing operator complexity while locking in recurring fees.
AC ubiquity remains strategic because logistics depots operate secure yards where dwell times exceed eight hours. Fleet telematics trigger remote start commands, aligning charging with renewable supply peaks. AC reliability surpasses 99% due to simpler electronics, minimizing service credits. Yet, as battery chemistries allow ultra-fast absorption rates, fleet operators will incrementally replace low-power posts with 150 kW stacks.


By Fleet Service Type: Corporate Fleets Anchor Demand; Logistics Spurs Growth
Corporate motor pools captured 39.25% of the China EV Charging as a Service market size in 2024, underpinned by predictable commuter patterns and centralized parking. Subscription bundles combine charging, vehicle health diagnostics, and carbon reporting, simplifying ESG compliance. Human resource departments leverage charger perks as employee benefits, bolstering adoption. Delivery and logistics fleets, however, log the fastest 28.23% CAGR to 2030 as same-day delivery dominates online retail. Daily route variability compels multi-stop top-ups, making guaranteed access contracts indispensable. CaaS platforms assign dynamic queue priorities based on parcel-load urgency, creating differentiated pricing.
Passenger mobility services—ride-hailing and taxis—demand high uptime and accept premium tariffs for 10-minute 250 kW sessions. Though small in volume, their public visibility drives brand equity for CaaS operators. Municipal bus and sanitation fleets join pilot electrification programs, layering incremental demand. Government mandates targeting 80% electrification in public service vehicles by 2030 underpin long-range forecasts. Collectively, diversified fleet segments secure baseline throughput, stabilizing revenue and enlarging the China EV Charging as a Service market.
By Power Output: Level 1 Dominates but High-Power Chargers Accelerate
Level 1 systems below 22 kW held a 45.82% share in 2024 because overnight depot cycles favor low amperage. They require only modest switchgear upgrades, yielding two-year paybacks. Yet, chargers above 150 kW are projected to grow at a 29.37% CAGR as heavy-duty trucks and premium passenger EVs adopt 800 V architectures. Megawatt standards under development will enable six-minute replenishment for Class-8 rigs. CaaS consortia secure utility interconnect agreements years in advance to reserve transformer capacity. Grid-side storage, such as Tesla's USD 560 million Shanghai project, buffers sudden ramp-ups and markets frequency services.
Level 2 units (22-50 kW) support mid-shift top-ups at logistics hubs, while fast chargers (50-150 kW) dominate highway rest areas backed by PPP financing, and depots deploy modular cabinets of 60-360 kW using stackable power modules to protect investments, with pricing tied to kilowatt rating to steer fleets toward appropriate speeds, improving cost-to-serve economics and expanding the China EV Charging as a Service market.

By End-Use: Public Networks Prevail, Semi-Public Hubs Rise
Public installations accounted for 67.43% of the China EV Charging as a Service market size in 2024 because they attract fleets and private drivers, raising occupancy above 35%. Mobile apps funnel traffic through dynamic discounts, smoothing diurnal demand curves. Semi-public hubs within business parks and logistics terminals enjoy a 26.22% CAGR to 2030, offering contracted fleets guaranteed bays while monetizing idle slots to the public at variable rates. Access control via RFID gates ensures priority yet retains flexibility.
Pure fleet depots locked behind security perimeters protect sensitive cargo chains but sacrifice daytime utilization. Operators offset lower load factors with data analytics packages sold to fleet managers. Public-facing sites partner with restaurants and retail stores, using dwell time to capture ancillary revenue. OEM–utility joint ventures roll out co-branded super-fast corridors covering 420 cities, weaving interoperability into loyalty apps. The end-use balance continues to evolve, but multi-function stations will likely dominate value creation within the China EV Charging as a Service market.
Geography Analysis
China’s tier-1 cities—Beijing, Shanghai, Shenzhen, and Guangzhou—host over 70% of national public chargers and anchor the China EV Charging as a Service market. Shenzhen alone built 362 supercharging stations, outnumbering gas stations and illustrating how policy alignment, high EV penetration, and dense logistics demand converge. Local governments waive land-lease fees for CaaS depots integrated with smart-grid demonstrators, spurring rapid commissioning despite transformer congestion. High utilization offsets steep real-estate costs, enabling operators to recoup investments within three years. Low-emission-zone enforcement further cements future demand by restricting diesel entry into central business districts.
Tier-2 and tier-3 cities represent the fastest emergent pockets as provincial authorities replicate tier-1 success models. Shanghai’s three-year plan targets fast-charger coverage across all highway service areas by 2026, signaling that intercity corridors will become the next growth platform. PPP concessions grant 15-year operation rights with minimum revenue guarantees, derisking greenfield projects. As e-commerce fulfillment spreads inland, logistics firms demand consistent charging quality along trunk routes. CaaS players deploy standardized modules that drop into service areas within 48 hours, accelerating rollout across Henan, Hubei, and Sichuan.
Rural counties trail in charger density yet receive targeted subsidies under the State Council’s NEV-to-the-countryside program. Grant ratios reach 40% of hardware cost, but low traffic delays payback. Operators adopt mobile containerized chargers relocated seasonally to follow agricultural fleet demand. Vehicle-to-home pilots provide backup power during grid outages, adding social value that justifies government co-funding. Over the forecast horizon, geographic diversification will smooth revenue volatility and broaden the China EV Charging as a Service market footprint into previously underserved areas.
Mordor Intelligence provides coverage of the ev charging as a service market across other key regional markets, including Europe, each with their regulatory frameworks and demand patterns. Detailed country-level analysis extends to India, South Korea, and United States incorporating local coverage and market participation, as required.
Competitive Landscape
The China EV Charging as a Service industry remains moderately concentrated. State Grid leverages its utility parent to secure preferential grid access, while TELD emphasizes software openness, integrating 300 third-party platforms. NaaS achieved a 57% gross margin in Q3 2024 by refining AI-driven dispatch and billing algorithms that cut electricity costs by 18%. StarCharge’s hardware-plus-service bundle locks in multi-year O&M contracts.
OEM entrants raise rivalry intensity. Tesla activated V4 dispensers that serve non-Tesla EVs, enhancing network monetization. BYD will install 4,000 super-fast chargers capable of five-minute sessions, bundling free credits with vehicle sales to stimulate captive demand. CATL-Sinopec battery swap stations exploit Sinopec’s 30,000-site footprint, offering five-minute swaps for commercial vans and taxis. These vertically integrated models challenge independent CaaS operators on convenience and brand equity.
Strategic alliances counter OEM power. Volkswagen and Xpeng committed USD 700 million for 20,000 co-branded chargers across 420 cities. Joint investments spread capital risk and ensure multi-brand interoperability. Independent operators also partner with property developers to embed chargers in mixed-use complexes, securing long leases at discounted rents. M&A activity is likely as scale becomes critical for tariff hedging and technology upgrades. Competitive dynamics suggest ongoing consolidation, yet regulatory focus on open access prevents monopolistic lock-ins, sustaining innovation within the China EV Charging as a Service market.
China EV Charging-as-a Service Industry Leaders
TELD
StarCharge
State Grid EV Service
YKC
NIO Power
- *Disclaimer: Major Players sorted in no particular order

Recent Industry Developments
- June 2025: Tesla launched its first batch of V4 Superchargers in China, boosting maximum power and enabling cross-brand compatibility.
- January 2025: Volkswagen and Xpeng signed a memorandum to deploy 20,000 super-fast chargers across 420 cities, investing USD 700 million.
- July 2024: State Grid earmarked over CNY 600 billion for grid upgrades supporting 12 million chargers by 2025.


China EV Charging-as-a Service Market Report Scope
| AC Chargers |
| DC Chargers |
| Company Vehicles & Motor Pools |
| Delivery & Logistics |
| Passenger Fleets |
| Level 1 / AC (Below 22 kW) |
| Level 2 (22 - 50 kW) |
| Fast (50 - 150 kW) |
| High-Power (Above 150 kW) |
| Semi-Public Charging Setup |
| Public Charging Setup |
| By Charger Type | AC Chargers |
| DC Chargers | |
| By Fleet Service Type | Company Vehicles & Motor Pools |
| Delivery & Logistics | |
| Passenger Fleets | |
| By Power Output | Level 1 / AC (Below 22 kW) |
| Level 2 (22 - 50 kW) | |
| Fast (50 - 150 kW) | |
| High-Power (Above 150 kW) | |
| By End-Use | Semi-Public Charging Setup |
| Public Charging Setup |


Key Questions Answered in the Report
How large is the China EV Charging as a Service market in 2025?
It reaches USD 70.54 million in 2025 and is projected to grow to USD 222.96 million by 2030.
What CAGR is forecast for China’s CaaS segment?
The market is expected to register a 25.88% CAGR through 2030.
Which fleet segment is growing the fastest?
Delivery and logistics fleets are expanding at a 28.23% CAGR due to e-commerce demand.
What is the biggest restraint for operators in tier-1 cities?
Distribution transformer congestion raises infrastructure costs and slows roll-outs.
How are AI platforms improving profitability?
AI scheduling cuts peak demand charges, raises charger utilization, and enables dynamic pricing.
Page last updated on:


