India Commercial Vehicle Financing Market Size and Share
Market Overview
| Study Period | 2019 - 2030 |
|---|---|
| Forecast Data Period | 2025 - 2030 |
| Historical Data Period | 2019 - 2023 |
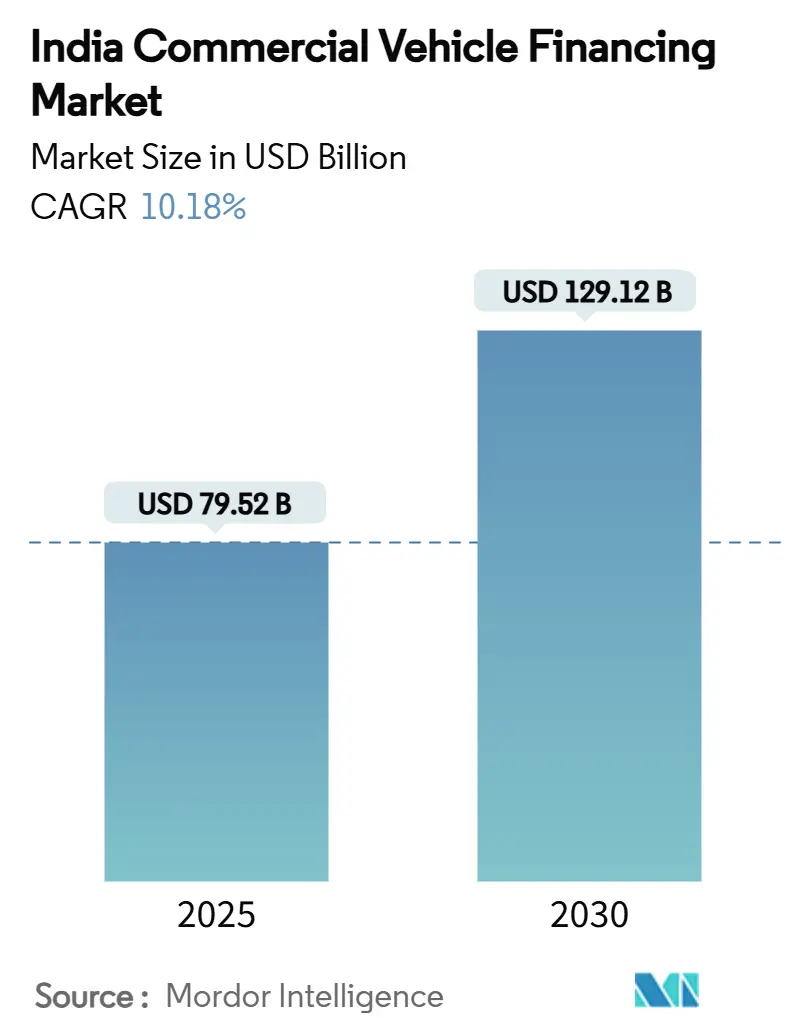
| Market Size (2025) | USD 79.52 Billion |
| Market Size (2030) | USD 129.12 Billion |
| Growth Rate (2025 - 2030) | 10.18% CAGR |
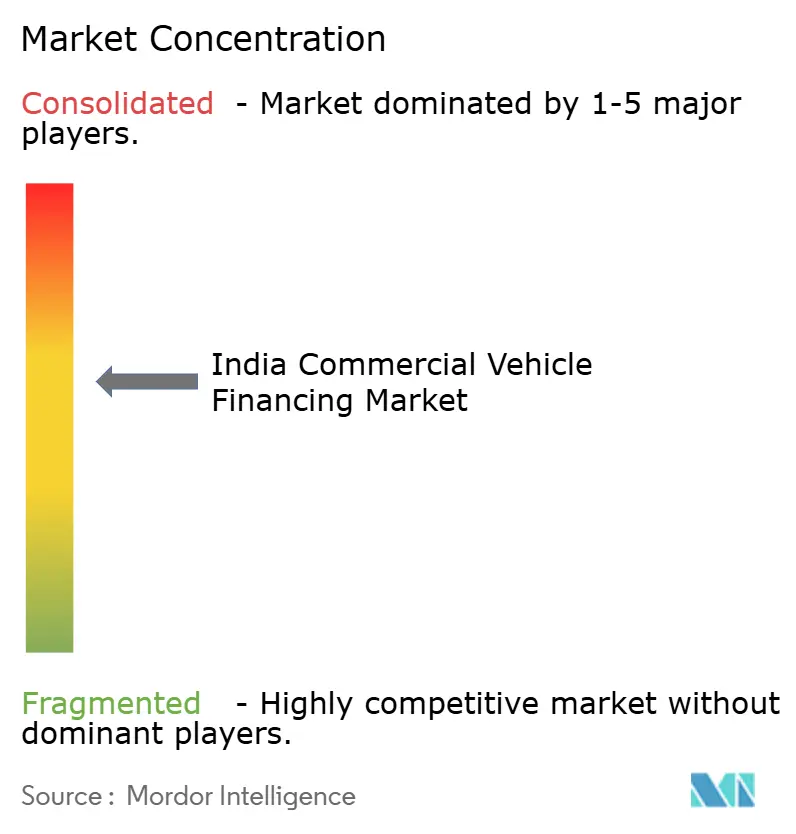
| Market Concentration | Medium |
Major Players *Disclaimer: Major Players sorted in no particular order Image © Mordor Intelligence. Reuse requires attribution under CC BY 4.0. | |
India Commercial Vehicle Financing Market Analysis by Mordor Intelligence
The India commercial vehicle finance market reached USD 79.52 billion in 2025 and is forecast to climb to USD 129.12 billion by 2030, reflecting a 10.18% CAGR and underlining the market size expansion expected over the next five years. This growth is tethered to record government capital spending on roads and logistics, formalized interstate freight flows under GST, and rapid digitization of non-bank lenders that compress loan-approval times. Rising e-commerce penetration in tier-2 and tier-3 cities sustains demand for light commercial vehicles (LCVs), while organized used-vehicle auctions deepen secondary-market liquidity. Parallel policy support—most recently the Reserve Bank of India’s February 2025 reduction in risk weights for bank loans to NBFCs—has eased funding constraints for specialized lenders[1]“Notification on Co-Lending Framework,”, Reserve Bank of India, rbi.org.in.
Key Report Takeaways
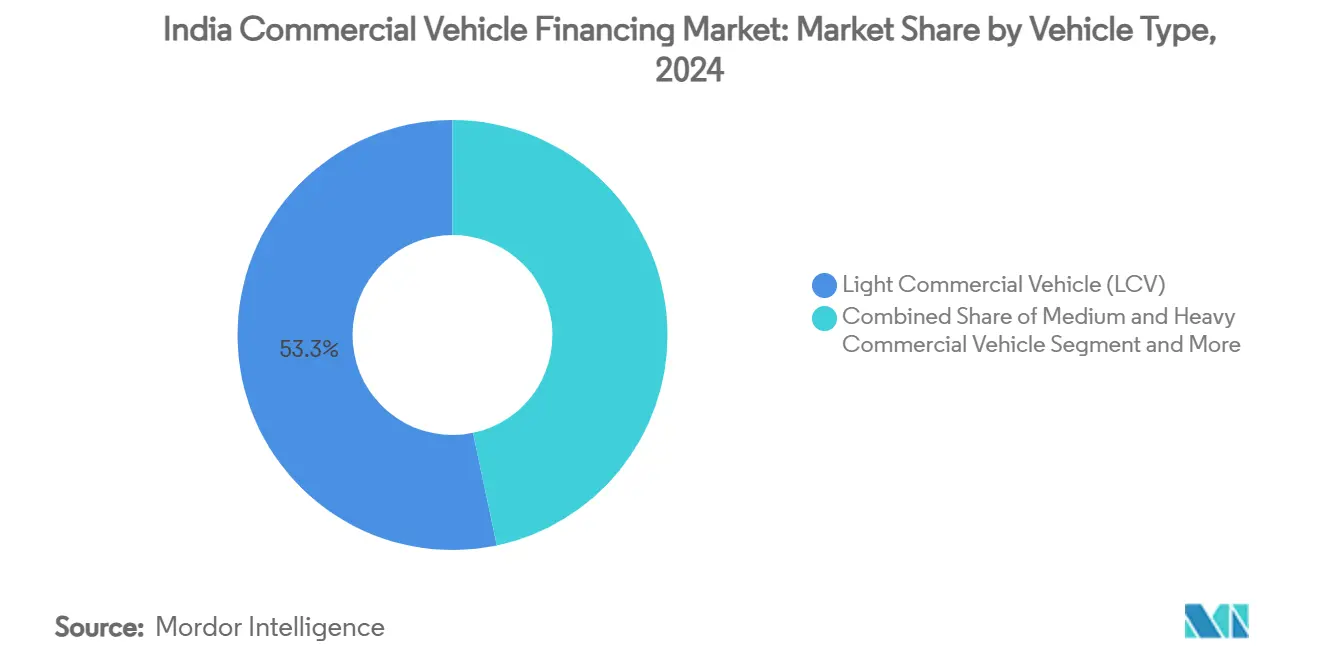
- By vehicle type, LCVs led with 53.29% of the India commercial vehicle finance market share in 2024 and are projected to advance at a 13.42% CAGR through 2030.
- By financier type, NBFCs captured a 63.72% revenue share of the India commercial vehicle finance market in 2024, while the same segment recorded the fastest growth at an 11.27% CAGR to 2030.
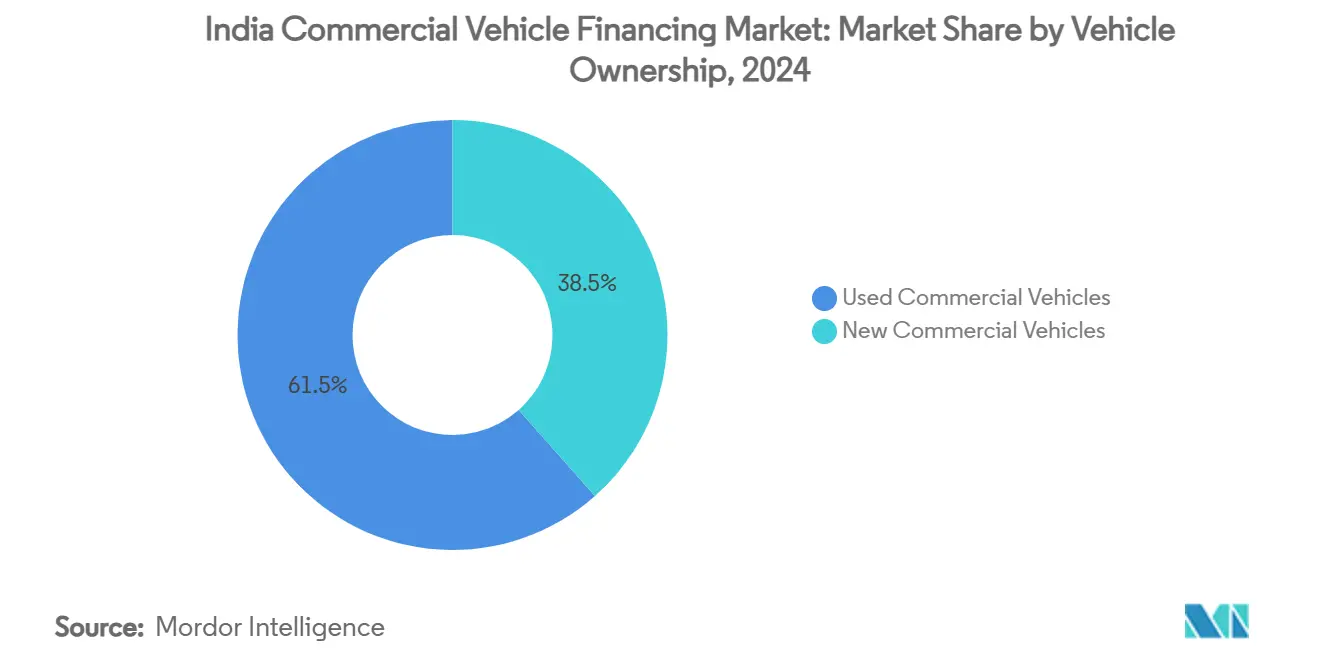
- By vehicle ownership, used commercial vehicles accounted for 61.53% of the India commercial vehicle finance market size in 2024 and are forecast to expand at an 11.81% CAGR between 2025 and 2030.
- By vendor type, the organized channel held a 59.64% share of the India commercial vehicle finance market size in 2024 and projects the strongest 12.62% CAGR to 2030.
- By state, Maharashtra led with 15.28% of the India commercial vehicle finance market share in 2024; Andhra Pradesh and Telangana are poised for the highest 12.16% CAGR through 2030.
Worldwide, activity is shaped by contributions from multiple countries and regions, with India representing one among them. The global report on commercial vehicle financing market by Mordor Intelligence reflects how these countries and regional layers combine into a single system.
India Commercial Vehicle Financing Market Trends and Insights
Drivers Impact Analysis*
| Driver | (~) % Impact on CAGR Forecast | Geographic Relevance | Impact Timeline |
|---|---|---|---|
| Infrastructure Capex Revival | +2.8% | National, with concentration in Maharashtra, UP, Karnataka | Medium term (2-4 years) |
| GST-Led Freight Formalization | +1.9% | National, particularly benefiting Gujarat, Tamil Nadu corridors | Long term (≥ 4 years) |
| NBFC digitization and Co-lending | +1.6% | Tier-2/3 cities across all states, rural penetration focus | Short term (≤ 2 years) |
| E-commerce-Driven LCV Demand | +1.4% | Uttar Pradesh, Maharashtra, Karnataka, Tamil Nadu, emerging Bihar markets | Medium term (2-4 years) |
| Organized Used-CV Auctions | +1.2% | National, with digital platform concentration in metro clusters | Short term (≤ 2 years) |
| OEM Telematics Embedded Finance | +0.9% | Technology corridors in Karnataka, Maharashtra, Tamil Nadu | Long term (≥ 4 years) |
| Source: Mordor Intelligence | |||
Government-Led Infrastructure Capex Revival
Union Budget 2025-26 earmarked INR 11.21 lakh crore for capital projects, with the expansion of the highways, triggering direct fleet purchases for material haulage and construction support. The National Infrastructure Pipeline’s multi-year USD 1.4 trillion plan encourages build-operate-transfer models, shifting procurement risk from government agencies to private fleet operators that rely on institutional vehicle loans[2]“National Infrastructure Pipeline,”, Invest India, investindia.gov.in. Every rupee of road capex generates a three-to-four-fold pull-through on freight activity, fueling incremental demand for heavy trucks. NBFCs with long track records in infrastructure-linked assets gain a pricing edge because of their collateral knowledge. Accelerated project execution—the narrowed FY 2025 under-spend in road outlays—gives lenders better visibility on fleet cash flows. The positive multiplier is most visible along the Delhi-Mumbai industrial corridor, where order books at truck OEMs show double-digit growth.
GST-Fueled Interstate Freight Formalization
Removal of state checkpoints and unified e-way bills cut transit times, nudging shippers toward hub-and-spoke models and larger consignments. Organized 3PLs now finance bigger trailers to consolidate loads, lifting average ticket sizes for financiers. Transparent invoicing under GST expands auditable cash flows, allowing lenders to raise loan-to-value ratios for prime fleets. Gujarat’s chemical clusters and Tamil Nadu’s electronics exporters exemplify corridors where GST efficiencies unlock five-year fleet-upgrade plans. Medium commercial vehicles retain relevance for mixed-cargo routes, yet rising highway quality progressively tilts demand toward multi-axle tractors. As compliance widens, lenders gain early-warning systems via e-invoice data feeds that flag stress.
Rapid NBFC Digitization and Co-Lending Rails
RBI’s co-lending framework now allows a 20:80 risk split between banks and NBFCs, quadrupling disbursements to INR 25,000 crore (USD 3.03 billion) in FY 2023. API stacks connect lenders to OEM dealers, shrinking application-to-disbursal cycles from a week to under 48 hours. Alternative datasets—GST returns, toll-tag feeds, telematics pings—replace legacy cash-flow proxies, slashing exclusion rates in thin-file borrower segments. February 2025 risk-weight cuts sliced NBFC cost of funds, with the margin many pass to fleet customers. Co-origination keeps borrower relationships with NBFCs while letting banks deploy balance-sheet muscle, supporting scalable growth without overstretching capital ratios
Shift To Organized Used-CV Auctions
Digital auction houses cut price discovery gaps by recording engine diagnostics, service histories, and valuation benchmarks. Such transparency increases loan-to-value ratios on pre-owned vehicles by 8-10 percentage points because collateral risk drops. Platform operators bundle inspection, title transfer, and funding into single-window journeys, pushing processing times below 15 days. As BS-VI norms accelerate fleet replacement, the supply of well-maintained trucks rises, enlarging the used-vehicle asset base. Organized liquidity lets lenders exit repossessions faster, pulling down loss-given-default rates. The formal resale channel also improves residual-value forecasting, enabling more aggressive depreciation schedules in credit models.
Restraints Impact Analysis*
| Restraint | (~) % Impact on CAGR Forecast | Geographic Relevance | Impact Timeline |
|---|---|---|---|
| Diesel Price Volatility | -1.8% | National, particularly affecting long-haul operators in Gujarat, Rajasthan | Short term (≤ 2 years) |
| RBI Risk-Weight Hike | -1.4% | National, with higher impact on smaller NBFCs in tier-2/3 markets | Medium term (2-4 years) |
| Elevated CV GNPA Levels | -1.1% | Concentrated in rural markets across UP, Bihar, Madhya Pradesh | Long term (≥ 4 years) |
| Weak M&HCV Resale Liquidity | -0.8% | National, with acute challenges in smaller cities lacking organized platforms | Medium term (2-4 years) |
| Source: Mordor Intelligence | |||
Diesel Price Volatility Depressing Fleet Cash-Flows
Diesel powers 70% of India’s transport energy use, with trucks alone accounting for 28.5% of national diesel draw, amplifying exposure to global crude swings[3]“Overview of Oil & Gas Sector 2025,”, Petroleum Planning and Analysis Cell, ppac.gov.in. The International Energy Agency sees domestic diesel demand rising by 1.2 million barrels per day through 2030, extending volatility risk[4]“Oil 2025 Report,”, International Energy Agency, iea.org. Freight tariffs adjust with a 30-60 day lag, compressing margins when pump prices spike. Owner-drivers operating on thin trip-based profits often defer maintenance—raising breakdown risk—and occasionally miss installments. Lenders respond with fuel-indexed escrow accounts, yet adoption remains low outside organized fleets. Episodes of fuel-tax hikes have historically paused new truck purchases, underscoring the restraint’s near-term drag.
RBI Risk-Weight Hike on Unsecured and NBFC Exposures
Between November 2023 and February 2025, higher risk weights lifted the capital charge on bank loans to NBFCs, crimping wholesale funding lines. Smaller NBFCs paid up to 120 basis points more for one-year money before the policy rollback. Elevated funding costs forced margin compression or price pass-through to borrowers, dampening credit uptake. Although February 2025 reversed part of the hike, regulatory uncertainty persists. Better-rated NBFCs emerged stronger, signaling potential market consolidation, yet tier-2 suppliers lost share, narrowing financing options in underserved districts.
*Our forecasts treat driver/restraint impacts as directional, not additive. The impact forecasts reflect baseline growth, mix effects, and variable interactions.
Segment Analysis
By Vehicle Type: LCV Demand Anchors Growth
Light commercial vehicles held a 53.29% share in the India commercial vehicle finance market in 2024 and are forecast to grow at a 13.42% CAGR, reflecting last-mile delivery's dominant role in fleet expansion. The segment benefits from lower acquisition cost, simplified driver licensing, and better maneuverability in congested cities. OEM telematics packages bundled with finance distinguish premium models and facilitate risk-based pricing for lenders. Medium and heavy commercial vehicles remain essential for long-haul and infra-project logistics, yet their 2025-2030 CAGR trails at single digits amid cyclical capex rhythms. Buses and coaches rely on urban public-transport revitalization programs and tourism rebound, supporting niche financing demand.
LCV momentum is further buttressed by growing interest in battery-electric variants eligible for state purchase incentives, prompting NBFCs to pilot residual-value guarantee products that offset technology-risk perceptions. E-commerce operators now stipulate minimum fleet uptime metrics in vendor contracts, pushing owner-drivers toward newer, telematics-equipped vans financed at competitive rates. Enhanced toll infrastructure coupled with FASTag data enables lender monitoring of route adherence, lowering delinquency probability. Medium truck buyers increasingly opt for co-lending structures to arbitrage the cost of funds while retaining relationship servicing by NBFCs.


By Financier Type: NBFC Dominance Continues
Non-bank lenders captured 63.72% of the India commercial vehicle finance market in 2024, leveraging doorstep service, nuanced underwriting, and rural penetration. Co-lending alliances with banks supply low-cost capital while preserving field-force intimacy, driving an 11.27% CAGR outlook through 2030. Banks focus on large fleet operators and refinance transactions, but have revived direct origination post-risk-weight rollback. OEM captive finance arms grow with parent sales yet remain constrained by OEM production cycles.
Digital transformation accelerates scale: top NBFCs process most applications via paperless journeys. Mahindra & Mahindra Financial Services reported AUM of INR 1.15 trillion in Q3 FY 2025, a 19% year-on-year surge, and maintained 95% collection efficiency. Shriram Finance crossed INR 2.5 trillion in assets under management, reflecting mergers and aggressive used-CV origination. Record securitization of vehicle loans worth INR 930 billion demonstrates investor comfort with granular pools backed by telematics data. Consequently, the India commercial vehicle finance market size intermediated by NBFCs could top USD 81 billion by 2030.
By Vehicle Ownership: Used-CV Financing Scales Up
Used vehicles represented 61.53% of financed volume in 2024 and are expected to expand at an 11.81% CAGR as organized auctions improve collateral certainty. Lower depreciation curves and established earnings records shorten breakeven horizons for small operators. Financiers now embed refurbishment loans within purchase facilities, enhancing asset productivity.
Digital marketplace penetration slashed the average financing cycle from 45 days to under 15, raising dealer turnover. BS-VI emission mandates push mid-life trucks into the resale pool, enlarging supply. Lenders leverage standardized inspection checklists and engine-health reports to boost loan-to-value ratios by up to 10 percentage points. Residual-value guarantees through insurer tie-ups reduce borrower anxiety around exit valuations. India commercial vehicle finance market share for used assets is poised to remain above 60%, stabilizing portfolio risk dispersion.
By Vendor Type: Organized Channel Gains Ground
Organized vendors accounted for 59.64% share in 2024 and are projected to clock a 12.62% CAGR as compliance demands and digital audits favor transparent intermediaries. KYC norms, GST invoicing, and digital loan documentation disadvantage informal brokers who cannot match the processing speed. Institutional investors prefer lending through entities with audited books, further expanding organized sector depth.
Regulatory scrutiny of digital lending, including mandatory grievance redressal and data-storage rules, elevates the cost of compliance but also raises industry entry barriers. Organized players integrate credit bureaus and account aggregators to refine borrower risk grades. Partnerships with OEMs yield exclusive floor-plan financing and buyback programs, enhancing customer loyalty.
Geography Analysis
Maharashtra retained 15.28% of the India commercial vehicle finance market in 2024 owing to its industrial breadth, twin mega-ports, and deep financial ecosystem. Mumbai’s dominance in banking and NBFC headquarters supplies competitive funding, while the Pune-Nashik manufacturing belt anchors freight demand. E-commerce densification in Mumbai Metropolitan Region fuels LCV turnover, and high road-building intensity in the Konkan corridor sustains heavy-truck volumes.
Uttar Pradesh and Tamil Nadu together account for over one-quarter of the financing pie. UP’s agricultural output and fast-urbanizing cities drive intra-state haulage, whereas Tamil Nadu’s auto and electronics clusters channel export logistics through Chennai and Tuticorin ports. Karnataka’s technology hubs inject high-value time-sensitive freight, prompting adoption of telematics-linked finance. Gujarat remains pivotal to west-coast trade with specialized tanker and container fleets requiring structured funding packages.
Andhra Pradesh and Telangana, though smaller bases, show the fastest 12.16% CAGR as industrial corridors and port upgrades at Visakhapatnam and Krishnapatnam unlock route density. State incentives for logistics parks attract 3PL investments that translate into new fleet finance. Bihar’s inclusion among states with notable EV adoption reveals latent demand potential in historically underbanked geographies. These shifts mirror the India commercial vehicle finance market’s diffusion beyond legacy strongholds and underscore its role in balancing regional economic growth.
Competitive Landscape
The market is moderately fragmented; the top five lenders control a significant share, while dozens of regional NBFCs cover local niches. Shriram Finance leverages the merger to deepen its reach in borrower clusters historically served by separate subsidiaries. Cholamandalam Investment operates 575 branches, favoring a twin-hub model that combines centralized risk analytics with district-level origination. HDFC Bank scales co-lending in the heavy-truck segment, deploying low-cost deposits alongside NBFC field forces.
Fintech entrants deploy AI-driven scorecards on GST and toll-tag data but face capital adequacy hurdles and higher marginal cost of funds. Strategic investments by global PE funds in NBFCs such as SK Finance validate the sector’s growth runway yet intensify competitive pricing. OEM captives bundle maintenance contracts and fuel cards, squeezing independent lenders on total-cost propositions. Compliance capability acts as a moat: players with robust data privacy and customer-grievance frameworks secure larger bank credit lines post-digital-lending guidelines.
Although disbursements are nascent, electric-vehicle financing emerges as the next battleground. Axis Bank’s INR 1 billion facility to Muthoot Capital for two-wheeler EVs signals a willingness to back alternative segments. Telematics-derived pay-as-you-drive models open high-margin ancillaries such as usage-based insurance. Yet asset-quality discipline remains pivotal; lenders with below-3% GNPA ratios command a pricing premium and lower securitization haircuts.
India Commercial Vehicle Financing Industry Leaders
Shriram Finance Ltd
Mahindra & Mahindra Financial Services
Tata Capital Limited
HDFC Bank
ICICI Bank
- *Disclaimer: Major Players sorted in no particular order

Recent Industry Developments
- June 2025: Scania Commercial Vehicles India has partnered with several financial service providers to enhance financing accessibility for its customers in the mining, infrastructure, and transport sectors.
- February 2025: Poonawalla Fincorp Limited (PFL), an NBFC backed by the Cyrus Poonawalla Group specializing in Consumer and MSME Lending, has broadened its portfolio by introducing a Commercial Vehicle (CV) Secured Loan Business. This initiative seeks to strengthen the vital logistics and supply chain sectors, improving transportation.
- February 2025: RBI cut risk weights on bank lending to NBFCs, reviving low-cost funding channels.


India Commercial Vehicle Financing Market Report Scope
| Light Commercial Vehicle (LCV) |
| Medium & Heavy Commercial Vehicle (M&HCV) |
| Buses & Coaches |
| OEM Captive Finance |
| Banks |
| Non-Banking Financial Company (NBFC) |
| New Commercial Vehicles |
| Used Commercial Vehicles |
| Organised |
| Unorganised |
| Maharashtra |
| Uttar Pradesh |
| Tamil Nadu |
| Karnataka |
| Gujarat |
| Rajasthan |
| Andhra Pradesh & Telangana |
| Punjab |
| Bihar |
| Rest of India |
| By Vehicle Type | Light Commercial Vehicle (LCV) |
| Medium & Heavy Commercial Vehicle (M&HCV) | |
| Buses & Coaches | |
| By Financier Type | OEM Captive Finance |
| Banks | |
| Non-Banking Financial Company (NBFC) | |
| By Vehicle Ownership | New Commercial Vehicles |
| Used Commercial Vehicles | |
| By Vendor Type | Organised |
| Unorganised | |
| By State / Union Territory | Maharashtra |
| Uttar Pradesh | |
| Tamil Nadu | |
| Karnataka | |
| Gujarat | |
| Rajasthan | |
| Andhra Pradesh & Telangana | |
| Punjab | |
| Bihar | |
| Rest of India |


Key Questions Answered in the Report
What is the projected value of the India commercial vehicle finance market by 2030?
The market is expected to reach USD 129.12 billion by 2030, growing at a 10.18% CAGR.
Which vehicle segment drives most financing demand?
Light commercial vehicles represent 53.29% of financed volumes and carry the fastest 13.42% CAGR due to e-commerce logistics growth.
Why do NBFCs dominate financing in this space?
They combine rural reach, agile underwriting, and digital co-lending rails, resulting in 63.72% share and an 11.27% CAGR outlook.
What risks could constrain market growth?
Diesel price volatility, elevated GNPA ratios, and patchy secondary-market liquidity for heavy trucks can temper expansion.
How does government infrastructure spending influence vehicle financing?
Highway and corridor capex acts as a multiplier, lifting truck demand and expanding the funding pool for lenders.
Page last updated on:


