Commercial Vehicle Financing Market Size and Share
Market Overview
| Study Period | 2019 - 2031 |
|---|---|
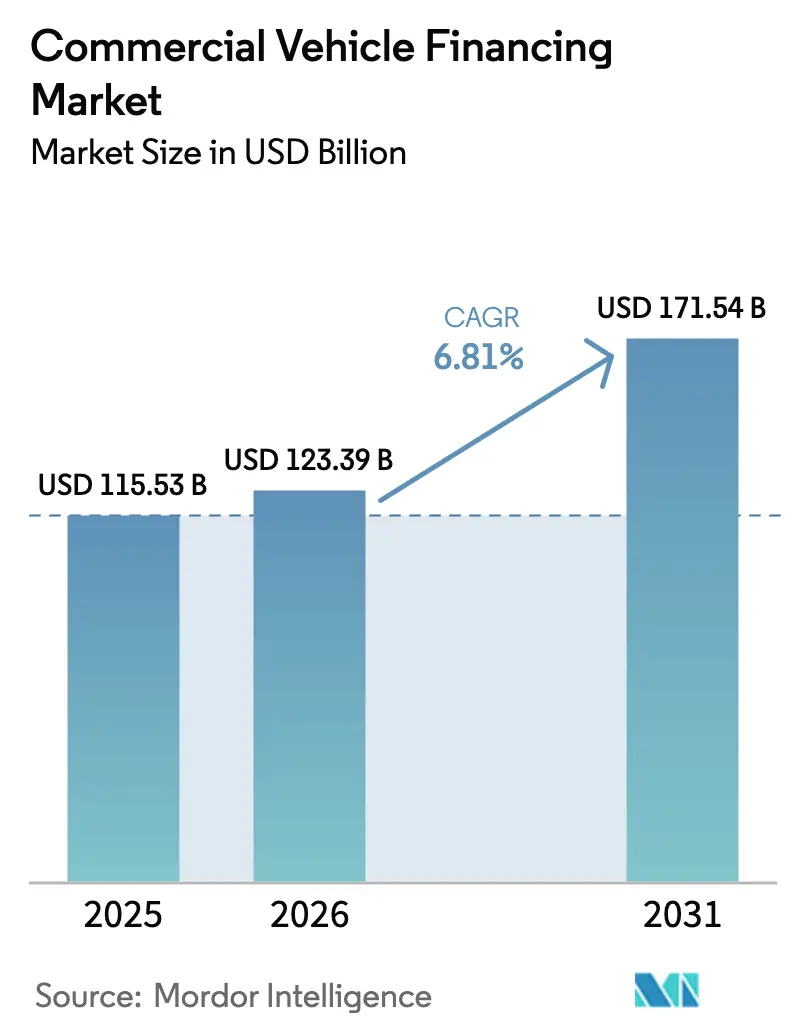
| Market Size (2026) | USD 123.39 Billion |
| Market Size (2031) | USD 171.54 Billion |
| Growth Rate (2026 - 2031) | 6.81% CAGR |
| Fastest Growing Market | Middle East and Africa |
| Largest Market | Asia Pacific |
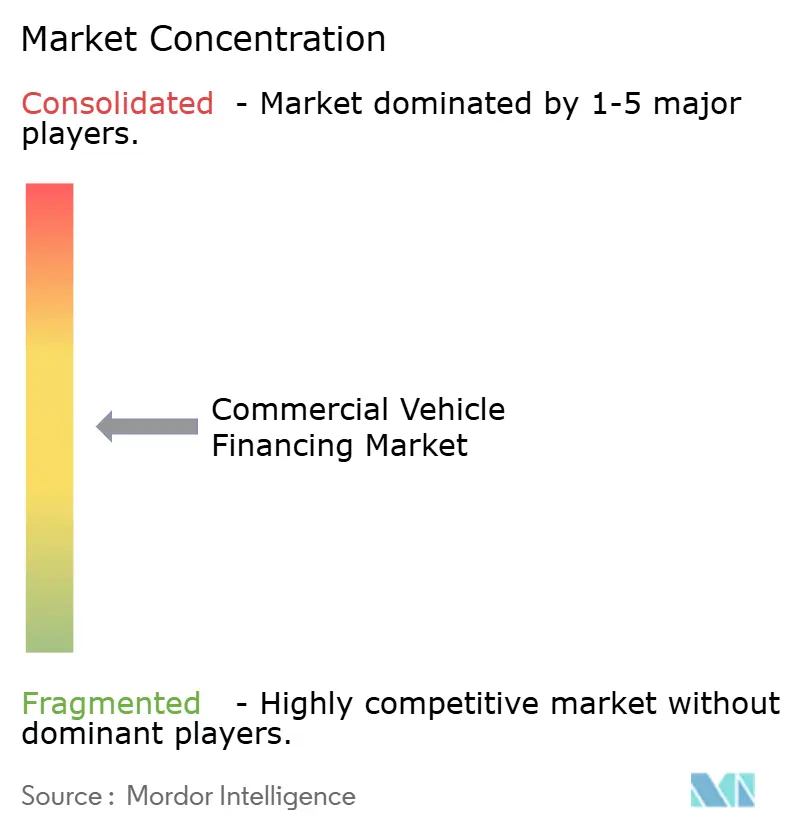
| Market Concentration | Medium |
Major Players *Disclaimer: Major Players sorted in no particular order Image © Mordor Intelligence. Reuse requires attribution under CC BY 4.0. | |
Commercial Vehicle Financing Market Analysis by Mordor Intelligence
The Commercial Vehicle Financing Market size was valued at USD 115.53 billion in 2025 and is estimated to grow from USD 123.39 billion in 2026 to reach USD 171.54 billion by 2031, at a CAGR of 6.81% during the forecast period (2026-2031). Embedded finance inside OEM telematics, ESG-linked lending, and AI-driven residual-value analytics are reshaping origination models, pushing capital toward electric light and medium-duty fleets and away from diesel assets. Non-banking financial companies (NBFCs) and digital platforms are expanding faster than banks as Basel IV capital rules raise the cost of on-balance-sheet lending. At the same time, interest-rate volatility adds urgency to off-balance-sheet operating leases. Asia Pacific remains the largest geography, yet the Middle East and Africa lead growth as sovereign funds finance logistics corridors that need new trucks, vans, and rail-connected drayage equipment.
Key Report Takeaways
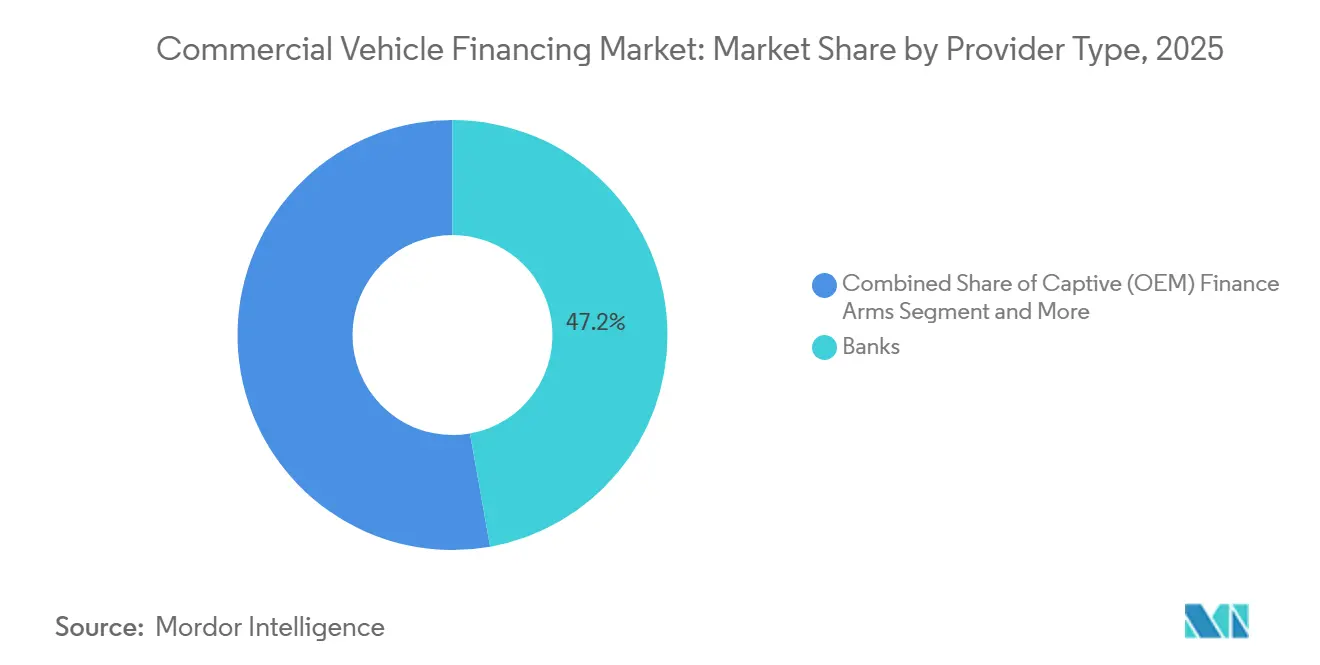
- By provider type, banks held 47.18% of the commercial vehicle financing market share in 2025, while NBFCs are projected to record the highest CAGR at 6.83% through 2031.
- By financing type, loans retained a 64.53% share in 2025, whereas operating leases are advancing at a 6.91% CAGR by 2031.
- By vehicle condition, new units accounted for 57.71% of the commercial vehicle financing market in 2025, but used-vehicle financing is expanding at a 6.94% CAGR.
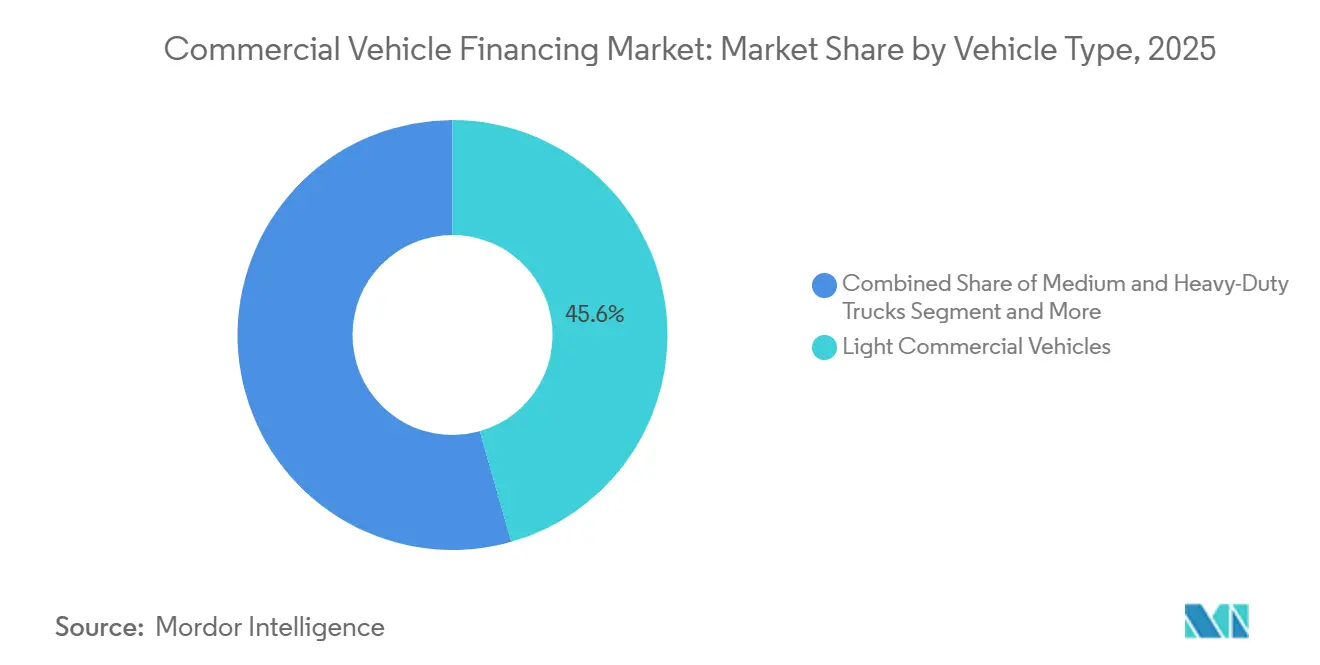
- By vehicle type, light commercial vehicles led the commercial vehicles financing market with 45.61% of the market share in 2025 and are set to grow at a 6.87% CAGR to 2031.
- By channel, direct origination accounted for 73.37% in 2025, yet online platforms posted the fastest growth at a 6.97% CAGR.
- By geography, Asia Pacific contributed 38.71% of revenue in 2025, whereas the Middle East and Africa are forecast to grow at a 6.88% CAGR through 2031.
Note: Market size and forecast figures in this report are generated using Mordor Intelligence’s proprietary estimation framework, updated with the latest available data and insights as of 2026.
Global Commercial Vehicle Financing Market Trends and Insights
Drivers Impact Analysis*
| Driver | (~) % Impact on CAGR Forecast | Geographic Relevance | Impact Timeline |
|---|---|---|---|
| Growth of Last-Mile Delivery Start-Ups | +1.4% | Global, concentrated in Asia Pacific and North America | Short term (≤ 2 years) |
| Electrification Incentives for Medium-Duty Fleets | +1.2% | North America and EU, spill-over to China | Medium term (2-4 years) |
| Rise of Embedded Finance in OEM Telematics Platforms | +0.9% | Global, early adoption in North America and Europe | Medium term (2-4 years) |
| ESG-Linked Lending Mandates | +0.8% | Europe and North America, expanding to Asia Pacific | Long term (≥ 4 years) |
| Expansion of Credit Bureaus Covering Informal Operators | +0.7% | Asia Pacific core, spill-over to MEA and South America | Long term (≥ 4 years) |
| AI-Driven Residual-Value Analytics Lowering Lender Risk | +0.6% | Global, led by North America | Medium term (2-4 years) |
| Source: Mordor Intelligence | |||
Growth of Last-Mile Delivery Start-Ups
In India, quick-commerce and parcel players, often with limited credit histories, are increasingly leasing vans and three-wheelers. Pocket banks seldom cater to this niche market. Recently, India-based Zepto secured significant funding and promptly leased a large number of electric units for a short-term period. Meanwhile, Blinkit operates numerous dark stores, each utilizing several leased vehicles. In the near future, Amazon Logistics plans to expand its fleet by adding a substantial number of electric vans in North America, leveraging an operating lease structure with Element Fleet Management to sidestep balance-sheet depreciation. Notably, the average lease tenure for these players has shortened over time. This shift allows fleets to upgrade sooner, keeping pace with advancements in battery technology. As a result, there's been a noticeable increase in origination directed towards Non-Banking Financial Companies (NBFCs) and captive Original Equipment Manufacturer (OEM) lenders. These entities are better positioned to handle shorter cycles and offer usage-based payment plans.
Electrification Incentives for Medium-Duty Fleets
Government grants and low-interest credit lines are slashing electric truck payback periods from several years to just a few. This shift is steering fleets towards operating leases that encompass both charging hardware and maintenance. Recently, the U.S. Environmental Protection Agency allocated substantial funding through Clean Heavy-Duty Vehicle grants. Meanwhile, California’s voucher program provided significant subsidies, covering a large share of the additional costs of electric vehicles [1]“Clean Heavy-Duty Vehicle Grants,” U.S. Environmental Protection Agency, epa.gov . Over in Europe, a loan from the European Investment Bank to TRATON reduced OEM financing rates for eligible buyers [2]“EIB Supports TRATON Electric Trucks,” European Investment Bank, eib.org. With zero-emission zones set to debut in major cities like London, Paris, and Los Angeles in the near future, replacement cycles are hastening. Adding to the momentum, Ryder’s recently launched EV leasing unit is significantly reducing upfront capital outlays. Collectively, these incentives are steering the commercial vehicle financing market firmly towards battery-electric Class 4-6 assets.
Rise of Embedded Finance in OEM Telematics Platforms
Manufacturers are now embedding credit quotes directly into truck dashboards, effectively bypassing traditional brokers. In early 2025, Daimler Truck Financial Services utilized real-time data to auto-fill applications on their portal, significantly reducing underwriting time and achieving a notable drop in default rates during pilot tests. Through a partnership with Motorq, Volvo Financial Services enabled fleet managers to adjust payment schedules directly within the app, resulting in a substantial increase in renewal rates. PACCAR Financial introduced a dynamic-rate tool that offers lower interest costs as a reward for efficient driving. With embedded finance capturing both origination fees and real-time risk metrics, the commercial vehicle financing market is shifting. By 2025, a significantly higher proportion of new Class 8 trucks sold in North America came with in-cab financing compared to earlier years.
ESG-Linked Lending Mandates at Global Banks
Large banks are now linking loan spreads to fleet emissions, penalizing diesel assets while rewarding electrification. Under JPMorgan’s latest framework, portfolios achieving significant annual carbon cuts receive notable discounts, whereas those falling short of Paris-aligned targets face substantial penalties [3]“Green Fleet Financing Framework,” JPMorgan Chase & Co., jpmorganchase.com . Deutsche Bank’s updated policy mandates third-party carbon audits for larger deals, raising upfront costs for smaller operators. Barclays has allocated a significant amount for green transport financing, with a focus on electric and hydrogen trucks. This shift has led to a residual-value gap: diesel models are now depreciating at a noticeably faster rate than their electric counterparts. As a result, lessors are opting for shorter contracts and higher monthly payments, simultaneously driving up EV financing volumes.
Restraints Impact Analysis*
| Restraint | (~) % Impact on CAGR Forecast | Geographic Relevance | Impact Timeline |
|---|---|---|---|
| Spike in Benchmark Rates Post-2025 | -1.1% | Global, most acute in North America and Europe | Short term (≤ 2 years) |
| Stricter Basel IV Capital Rules for CV Portfolios | -0.8% | Europe and North America, phased adoption in Asia Pacific | Medium term (2-4 years) |
| Volatility in Used-Truck Resale Prices | -0.7% | Global, concentrated in North America | Short term (≤ 2 years) |
| Plateauing E-Commerce Freight Volumes in China | -0.6% | China core, indirect impact on Asia Pacific | Medium term (2-4 years) |
| Source: Mordor Intelligence | |||
Spike in Benchmark Rates Post-2025
In 2023, central banks tightened their grips, maintaining high interest rates in the United States and Europe. This maneuver led to a significant increase in monthly lease payments. In the UK, elevated base rates caused delays in fleet replacements. Owner-operators with sub-investment-grade credit either turned to used-vehicle financing or postponed purchases, resulting in a decline in origination volumes despite steady freight demand. These macroeconomic pressures are dampening short-term growth in the commercial vehicle financing market.
Stricter Basel IV Capital Rules for CV Portfolios
In early 2025, increased transport-loan risk weights will require European banks to significantly raise their capital reserves for truck portfolios. NatWest reported that this regulation led to a noticeable rise in capital requirements and a significant decline in new originations during the first half of the year. According to a PwC study, the industry faces a substantial capital shortfall, prompting banks to either securitize their loans or exit the asset class altogether. Due to regulatory premiums, non-banking financial companies (NBFCs) and their captive arms can offer more competitive pricing than banks, driving a significant shift in market share in the commercial vehicle financing arena.
*Our forecasts treat driver/restraint impacts as directional, not additive. The impact forecasts reflect baseline growth, mix effects, and variable interactions.
Segment Analysis
By Provider Type: NBFCs Capture Informal Fleets
Banks maintained 47.18% of the commercial vehicle financing market share in 2025, but face shrinking yields because Basel IV inflates capital costs. NBFCs are forecast to grow at a 6.83% CAGR to 2031 as they fund small, informal operators overlooked by banks. In fiscal 2025, Mahindra Finance leveraged GPS-enabled credit scoring to significantly expand its commercial-vehicle book, while Shriram Finance saw notable growth in disbursements. Captive OEM lenders, including Toyota Financial Services and Volvo Financial Services, use embedded telematics to offer more competitive pricing than bank loans, capturing a substantial share of new-vehicle originations. Although credit unions hold a smaller market share, they thrive in specific North American niches through relationship-based underwriting. This competitive landscape highlights the advantage of NBFC agility in emerging markets and the scale of captive OEMs in developed areas, putting pressure on mid-tier banks that lack both attributes.
While bank portfolios are growing more slowly due to regulatory capital constraints, NBFCs are poised for rapid expansion in the commercial vehicle financing market. The technological divide further accentuates this trend: NBFCs adeptly merge mobile-money data and fuel-card histories for innovative credit scoring, while banks rely on audited financials—often inaccessible to owner-operators managing smaller fleets. Given that informal transport constitutes a significant portion of freight in the Asia Pacific, NBFCs are set to outpace traditional lenders in penetration.


By Financing Type: Operating Leases Outperform
Loans retained a 64.53% share of the Commercial vehicles financing market size in 2025 because owner-operators value asset ownership, yet their share will erode as corporate tax reforms and ESG mandates nudge fleets toward shorter, service-rich contracts. Operating leases are projected to grow at 6.91% CAGR, the swiftest among products, as lessees transfer residual-value risk and keep liabilities off balance sheets.
The Commercial vehicles financing market share for operating leases will rise further as embedded telematics enable dynamic mileage-based billing, a feature now baked into Daimler and Volvo programs. Finance leases, suited to mid-size fleets wanting eventual ownership, grow more slowly, while credit-line financing remains niche due to higher floating rates. Lessors with strong residual-valuation models and nationwide service depots stand to benefit the most.
By Vehicle Condition: Used Units Accelerate
New units still accounted for 57.71% of the Commercial vehicle financing market in 2025, yet PACCAR Financial’s certified-pre-owned loans at 5.9% APR indicate narrowing cost gaps. Used-vehicle financing is set to expand at a 6.94% CAGR, the fastest among condition segments, aided by AI tools that predict depreciation with precise accuracy. In a bid to refine residual forecasts, Cox Automotive's vAuto platform processes a significant volume of auction records monthly, resulting in a notable reduction in lender losses compared to the previous year.
Auction volatility does require higher residual buffers, but abundant off-lease inventory from pandemic-era expansions keeps supply robust. OEM-backed certification and telematics-verified maintenance histories further derisk used-truck lending, widening lender participation beyond traditional specialists.
By Vehicle Type: LCVs Lead Volume and Growth
Light commercial vehicles accounted for a 45.61% share in 2025 and are projected to grow at a 6.87% CAGR through 2031, steered by e-commerce and urban delivery. In North America, same-day and next-day parcel deliveries have increased significantly in recent years, driving demand for dense fleets of sub-3.5-tonne vans. In the near future, Amazon plans to enhance its operations by leasing a substantial number of electric vans, while in India, both Zepto and Blinkit are expanding their fleets with three-wheelers.
Medium and heavy trucks still command considerable ticket sizes but slower volume growth, especially as higher rates extend replacement cycles. Buses and special-purpose vehicles remain niche, reliant on government procurement or bespoke project finance. Electrification mandates and low-emission zones amplify the LCV growth premium, making them the cornerstone of the Commercial vehicle financing market.
By Channel: Online Platforms Disrupt Legacy Brokers
Direct origination retained a 73.37% share in 2025, but online aggregators will rise at a 6.97% CAGR as AI underwriting slashes approval times. In recent years, Lendio has successfully connected numerous small fleets with lenders, while Bluevine has achieved significant growth in CV loan originations by leveraging alternative freight invoice data. Broker-assisted channels have faced stagnation as embedded finance in truck dashboards increasingly reduces the need for human intermediaries. A substantial portion of credit applications in North America is now being submitted online, and this trend continues to grow.
Digital platforms differentiate through instant eligibility checks, transparent price discovery, and integration with accounting software, features that resonate with time-pressed fleet managers. As a result, the Commercial vehicles financing market share captured by brokers will decline, pushing them toward advisory services rather than pure origination.
Geography Analysis
Asia Pacific held 38.71% of global revenue in 2025, driven by the growth of India's non-banking financial companies (NBFCs) and China's substantial market base. However, growth in China slowed due to a deceleration in e-commerce parcel expansion. Indian lenders used mobile money and GPS data for underwriting, leading to a notable increase in their commercial-vehicle portfolios. Meanwhile, Indonesia and the Philippines capitalized on gig-economy fleet finance, achieving robust growth. Despite challenges from regulatory fragmentation and currency risks, the region's medium-term demand remains supported by increasing infrastructure investments.
The Middle East and Africa will post the fastest CAGR of 6.88% to 2031. Saudi Arabia's Vision 2030 has committed substantial investments towards developing logistics hubs. Additionally, the Etihad Rail corridor in the UAE is driving increased demand for trucking services to transport goods to inland depots. A resurgence in South Africa's mining sector has led to a significant increase in financing for heavy-duty trucks. In Turkey, vehicle production is supporting lending tied to regional exports. Furthermore, Sharia-compliant Ijara leases are gaining popularity in the Gulf, effectively tapping into Islamic capital resources.
North America and Europe continue to see steady growth, driven by incentives for electrification and frameworks linked to environmental, social, and governance (ESG) criteria. The U.S. Environmental Protection Agency's (EPA) Clean Heavy-Duty Vehicles initiative, alongside the European Investment Bank's financing support for TRATON, is helping reduce financing costs for zero-emission vehicles. This is particularly significant given rising policy rates. In South America, while Brazil and Argentina dominate in terms of volume, political uncertainties and foreign exchange fluctuations are nudging fleets towards short-tenor, variable-rate leases rather than extended loans. Nevertheless, cycles in agricultural commodities continue to influence equipment turnover in the region.
Mordor Intelligence provides coverage of the commercial vehicle financing market across other key regional markets. Detailed country-level analysis extends to India incorporating local coverage and market participation, as required.


Competitive Landscape
The commercial vehicle financing market remains moderately fragmented. Leading players, including PACCAR Financial, Volvo Financial Services, Toyota Financial Services, Bank of America, and Wells Fargo, hold significant market share, leaving considerable opportunities for non-banking financial companies (NBFCs), regional credit unions, and fintech lenders. Captive OEM arms leverage embedded telematics and residual-value data, enabling them to offer more competitive rates than banks, particularly on electric models where data transparency is heightened. In the Asia Pacific and MEA regions, NBFCs are experiencing substantial portfolio growth by attracting informal operators with flexible collateral terms.
Banks, facing pressure from tighter net interest margins and stringent Basel IV capital ratios, are shifting their focus to fee-based brokerage services and the securitization of their current portfolios. Meanwhile, digital disruptors like Lendio, Bluevine, and OnDeck are harnessing machine-learning underwriting, allowing them to provide rapid approvals, a feature that's particularly attractive to small fleet operators.
The technological forefront is dominated by AI-driven residual modeling, telematics-based dynamic pricing, and blockchain-based title management. Early adopters, including Daimler Truck Financial Services and Volvo Financial Services, have reported significant improvements in renewal rates and reductions in defaults post-tool integration. While there are promising opportunities in financing for used vehicles targeting informal fleets and loans embedded with telematics, challenges persist, including rate hikes, fluctuations in residual values, and the costs associated with ESG compliance.
Commercial Vehicle Financing Industry Leaders
Bank of America Corporation
Ally Financial Inc.
HDFC Bank Limited
Toyota Financial Services
Standard Bank Group Ltd.
- *Disclaimer: Major Players sorted in no particular order

Recent Industry Developments
- July 2025: TRATON Financial Services has successfully implemented its integrated captive finance structure in 14 markets, significantly enhancing embedded financing solutions for Scania, MAN, and Navistar. This rollout aims to streamline financial services, improve customer experience, and support the growth of these brands in key regions.
- October 2024: Powerfleet, with a transaction value of approximately USD 200 million, has successfully acquired Fleet Complete, significantly expanding its global connected-fleet platform.


Global Commercial Vehicle Financing Market Report Scope
The scope of the report includes Provider Type (Banks, Captive Finance Arms, and More), Financing Type (Loans, Finance Lease, and More), Vehicle Condition (New and Used), Vehicle Type (LCV, Medium/Heavy Trucks, Buses, and Special-Purpose), Channel (Direct, Online Aggregators, and Broker-assisted), and Geography.
| Banks |
| Captive (OEM) Finance Arms |
| Non-Banking Financial Companies (NBFCs) |
| Credit Unions & Mutuals |
| Loans |
| Finance Lease |
| Operating Lease |
| Line-of-Credit / Revolver |
| New Commercial Vehicles |
| Used Commercial Vehicles |
| Light Commercial Vehicles |
| Medium and Heavy Duty Trucks |
| Buses and Coaches |
| Special-purpose Vehicles |
| Direct |
| Online Aggregators & Digital Platforms |
| Broker-assisted |
| North America | United States |
| Canada | |
| Rest of North America | |
| South America | Brazil |
| Argentina | |
| Rest of South America | |
| Europe | Germany |
| United Kingdom | |
| France | |
| Italy | |
| Spain | |
| Russia | |
| Rest of Europe | |
| Asia Pacific | China |
| Japan | |
| India | |
| South Korea | |
| Rest of Asia Pacific | |
| Middle East and Africa | Saudi Arabia |
| United Arab Emirates | |
| Turkey | |
| South Africa | |
| Rest of Middle East and Africa |
| By Provider Type | Banks | |
| Captive (OEM) Finance Arms | ||
| Non-Banking Financial Companies (NBFCs) | ||
| Credit Unions & Mutuals | ||
| By Financing Type | Loans | |
| Finance Lease | ||
| Operating Lease | ||
| Line-of-Credit / Revolver | ||
| By Vehicle Condition | New Commercial Vehicles | |
| Used Commercial Vehicles | ||
| By Vehicle Type | Light Commercial Vehicles | |
| Medium and Heavy Duty Trucks | ||
| Buses and Coaches | ||
| Special-purpose Vehicles | ||
| By Channel | Direct | |
| Online Aggregators & Digital Platforms | ||
| Broker-assisted | ||
| By Geography | North America | United States |
| Canada | ||
| Rest of North America | ||
| South America | Brazil | |
| Argentina | ||
| Rest of South America | ||
| Europe | Germany | |
| United Kingdom | ||
| France | ||
| Italy | ||
| Spain | ||
| Russia | ||
| Rest of Europe | ||
| Asia Pacific | China | |
| Japan | ||
| India | ||
| South Korea | ||
| Rest of Asia Pacific | ||
| Middle East and Africa | Saudi Arabia | |
| United Arab Emirates | ||
| Turkey | ||
| South Africa | ||
| Rest of Middle East and Africa | ||


Key Questions Answered in the Report
What is the projected CAGR for commercial-vehicles financing between 2026 and 2031?
The compound annual growth rate is forecast at 6.81% over 2026-2031, lifting total volume to USD 171.54 billion by 2031.
Which funding providers are expected to record the fastest expansion?
Non-banking financial companies are on track for a 6.83% CAGR through 2031, outpacing banks that face higher Basel IV capital charges.
How large could the commercial-vehicles financing pool become by 2031?
It is projected to reach USD 171.54 billion by 2031, up from USD 123.39 billion in 2026.
Why are operating leases gaining popularity with fleet operators?
Lessees are shifting residual-value risk to lessors and keeping liabilities off balance sheets, a factor that supports a 6.91% CAGR for operating leases this decade.
Which geography is set to register the quickest growth pace?
The Middle East and Africa are forecast to expand at 6.88% CAGR, helped by Saudi and UAE logistics investments and rail-road linkages.
How do ESG-linked lending rules affect financing costs for diesel trucks?
Major banks now apply 50-75 basis-point rate premiums to diesel assets, making electric or hydrogen models comparatively cheaper to fund.
Page last updated on:


