India Chillers Market Size and Share
Market Overview
| Study Period | 2020 - 2031 |
|---|---|
| Forecast Data Period | 2026 - 2031 |
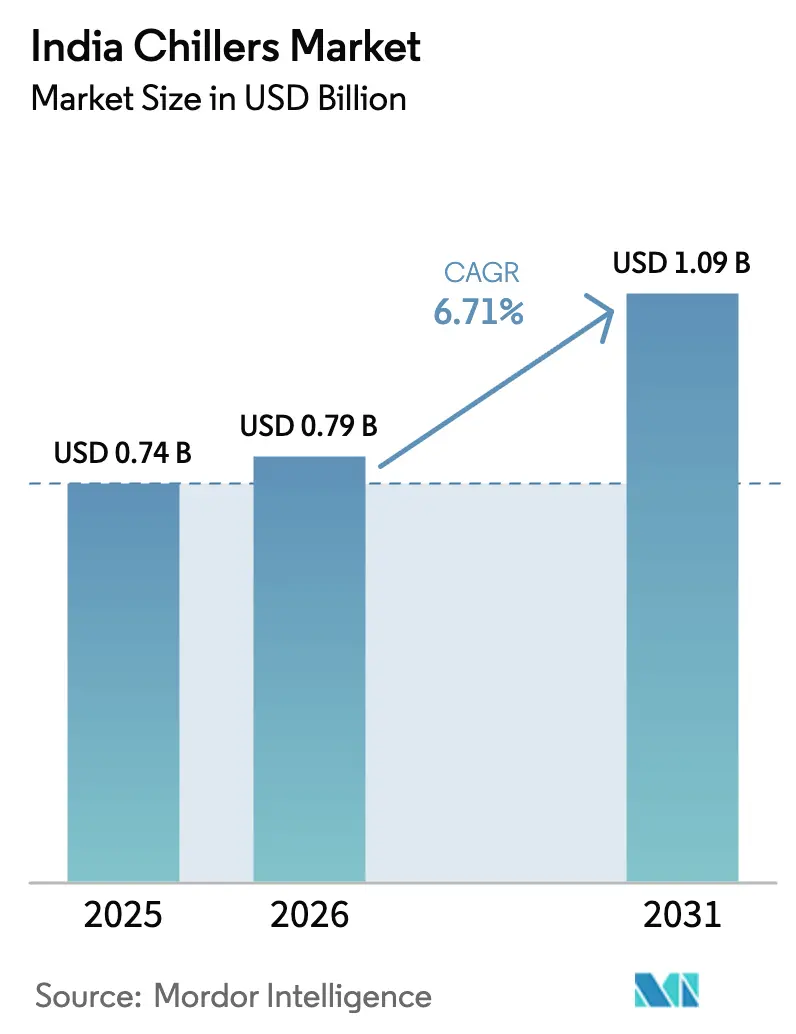
| Base Year Market Size (2025) | USD 0.74 Billion |
| Market Size (2026) | USD 0.79 Billion |
| Market Size (2031) | USD 1.09 Billion |
| Growth Rate (2026 - 2031) | 6.71% CAGR |
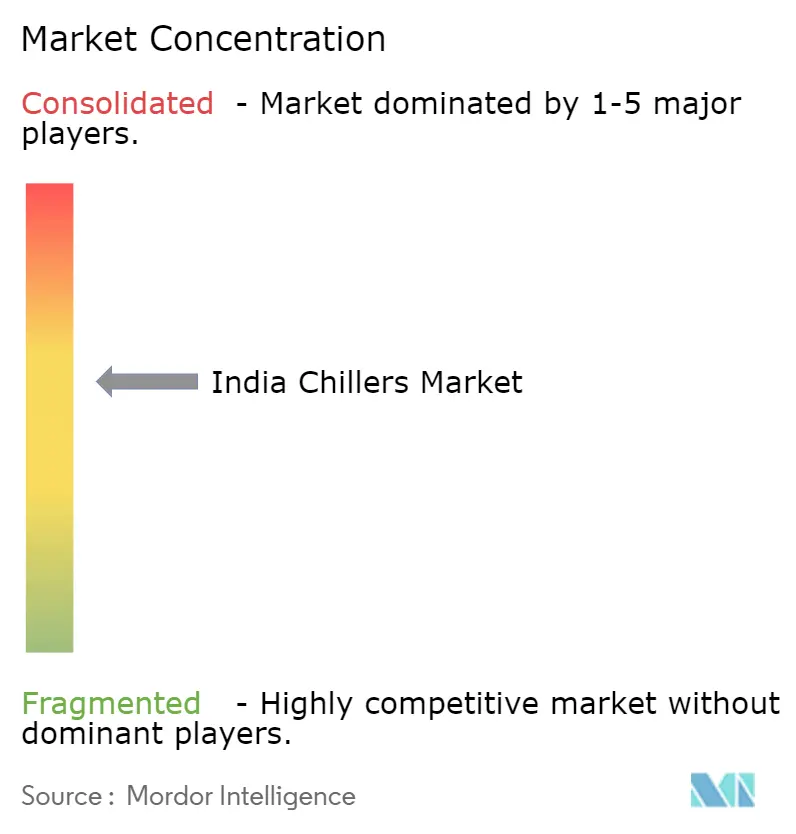
| Market Concentration | Medium |
Major Players *Disclaimer: Major Players sorted in no particular order Image © Mordor Intelligence. Reuse requires attribution under CC BY 4.0. | |
India Chillers Market Analysis by Mordor Intelligence
The India chillers market size was valued at USD 0.74 billion in 2025 and estimated to grow from USD 0.79 billion in 2026 to reach USD 1.09 billion by 2031, at a CAGR of 6.71% during the forecast period (2026-2031). Rising data-center density, accelerating industrialization and mandatory energy-efficiency rules are reshaping demand, while the shift to low-GWP refrigerants is driving product redesigns. Government programs such as the Perform, Achieve & Trade (PAT) scheme are nudging buyers toward high-efficiency models, and district-cooling pilots in tier-2 cities are enlarging addressable volumes. Global suppliers are emphasizing magnetic-bearing and IoT-enabled chillers to serve hyperscale data centers, whereas domestic brands compete on cost and service reach. Persistent grid-quality issues, volatile HFC prices and a shortage of trained technicians, however, remain near-term hurdles for the India chillers market.
Key Report Takeaways
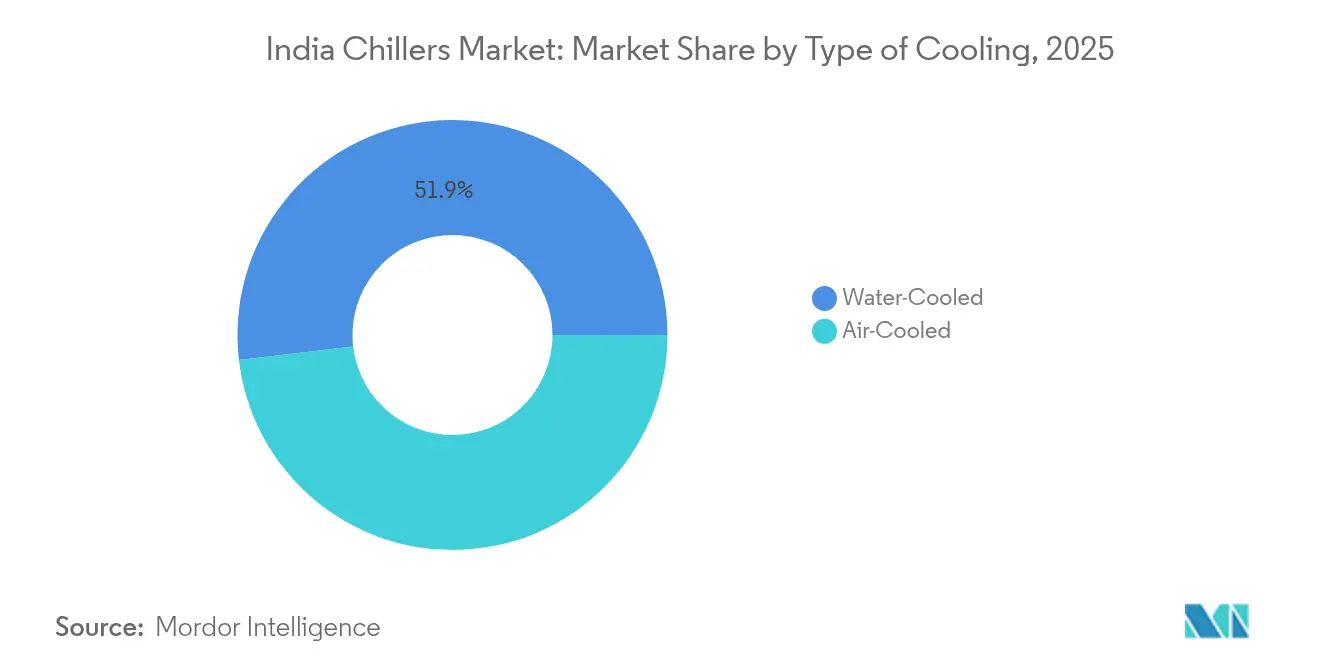
- By type of cooling, water-cooled systems led with 51.85% of the India chillers market share in 2025, while air-cooled units are expanding fastest at a 9.05% CAGR through 2031.
- By compressor, screw technology accounted for 37.05% of the India chillers market size in 2025; magnetic-bearing centrifugal units are projected to post an 10.65% CAGR to 2031.
- By refrigerant, R-134a retained 40.05% share of the India chillers market size in 2025, whereas HFO/low-GWP blends are advancing at a 11.72% CAGR to 2031.
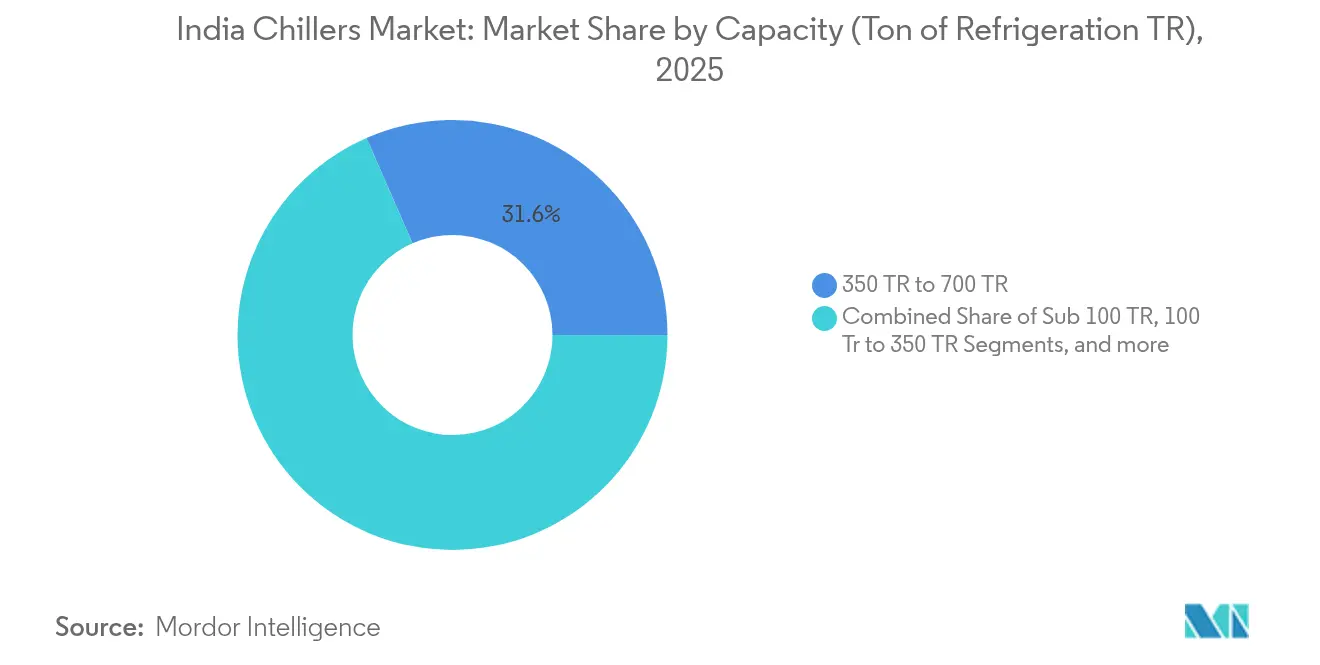
- By capacity, the 350-700 TR band held 31.55% of the India chillers market size in 2025; sub-100 TR systems are growing quickest at 10.15% CAGR.
- By end user, commercial buildings captured 28.85% of the India chillers market size in 2025; data centers are the fastest-growing segment at a 12.35% CAGR.
- By region, West India dominated with 27.05% India chillers market share in 2025, while South India is expected to witness the highest 9.25% CAGR to 2031.
Note: Market size and forecast figures in this report are generated using Mordor Intelligence’s proprietary estimation framework, updated with the latest available data and insights as of 2026.
Worldwide, activity is shaped by contributions from multiple countries and regions, with India representing one among them. The global report on chiller market by Mordor Intelligence reflects how these countries and regional layers combine into a single system.
India Chillers Market Trends and Insights
Drivers Impact Analysis*
| Driver | (~) % Impact on CAGR Forecast | Geographic Relevance | Impact Timeline |
|---|---|---|---|
| Rapid expansion of data-center capacity | +1.8% | Mumbai, Bangalore, Chennai, Hyderabad | Medium term (2-4 years) |
| Government energy-efficiency incentives & PAT | +1.2% | Pan-India, early uptake in Gujarat, Maharashtra, Tamil Nadu | Long term (≥4 years) |
| Replacement demand from R-22 phase-out | +0.9% | Nationwide legacy industrial bases | Short term (≤2 years) |
| Growth of district-cooling projects | +0.7% | Pune, Ahmedabad, Kochi, Indore | Medium term (2-4 years) |
| Climate-linked financing for retrofits | +0.5% | Industrial & commercial clusters nationwide | Long term (≥4 years) |
| Rising HVAC demand from organised retail | +0.4% | Tier-1 urban centres | Medium term (2-4 years) |
| Source: Mordor Intelligence | |||
Rapid expansion of data-center capacity
AI-driven racks consume 35-70 kW versus 5-6 kW for traditional IT loads, prompting operators to specify liquid immersion and adiabatic chillers for improved PUE. Power demand from data centers rose 4.4% year-on-year to 139 billion kWh in June 2023, and policies such as Rajasthan’s 2025 Data Center Policy are funnelling INR 20,000 crore of fresh investment. Orders for data-center cooling doubled Johnson Controls’ 2024 sales backlog, underscoring the segment’s pull on the India chillers market.[1]Johnson Controls, “2024 Annual Report & Proxy Statement,” investors.johnsoncontrols.com
Government energy-efficiency incentives and PAT scheme
The PAT program has saved 113.16 billion kWh, equating to INR 89,122 crore, and chillers have moved from voluntary to mandatory star labelling from January 2024. BEE now targets parity with global efficiency norms by 2027, and its financing platform has attracted over 310 investment proposals, a pipeline that boosts premium-grade chiller uptake.
Replacement demand from R-22 phase-out
India’s pledge to phase out HCFCs by 2030 is accelerating swaps of legacy R-22 equipment. Domestic producers are scaling HFO 1234yf and 1233zd output, while BIS safety codes ease natural-refrigerant adoption. The India Cooling Action Plan predicts a 25-30% refrigerant-demand cut versus business-as-usual, creating a retrofit boom for the India chillers market
Growth of district-cooling projects in tier-2 cities
GIFT City’s plant has proven 40% energy-bill savings, spurring similar schemes in Kochi and Indore. Smart-Cities investments topping INR 171,044 crore furnish trunk infrastructure, while BEE guidelines now frame performance baselines for developers, all expanding the India chillers market footprint.[2]Ministry of Housing and Urban Affairs, “Smart Cities Mission,” smartcities.gov.in
Restraints Impact Analysis*
| Restraint | (~) % Impact on CAGR Forecast | Geographic Relevance | Impact Timeline |
|---|---|---|---|
| High upfront capital cost | -1.1% | National, with higher impact on MSME segment | Medium term (2-4 years) |
| Grid-instability and power-quality issues | -0.8% | Tier-2 and tier-3 cities, rural industrial areas | Short term (≤ 2 years) |
| Shortage of magnetic-bearing service technicians | -0.6% | National, with acute impact in tier-2 cities adopting advanced technology | Medium term (2-4 years) |
| Volatility in HFC refrigerant prices | -0.4% | National, with higher impact on cost-sensitive segments | Short term (≤ 2 years) |
| Source: Mordor Intelligence | |||
High upfront capital cost
Each uplift in star rating needs about INR 600 crore of re-tooling, and SME buyers struggle to unlock mid-ticket finance despite long-run energy savings. Data-center build costs ballooned 15% in 2024, and HVACR M&A multiples hit 16.5× EV/EBITDA, signalling a capital-intensive cycle that could dampen near-term orders for the India chillers market.[3]Economic Times, “Don't just be cool, be better: BEE asks AC, fridge manufacturers to boost energy efficiency to match world standards,” m.economictimes.com
Grid instability and power-quality issues
Peak demand is set to touch 270 GW in June 2025, causing voltage swings that impair magnetic-bearing compressors, particularly outside tier-1 cities. Renewable-energy banking restrictions compound the challenge for data-center operators who need round-the-clock high-quality power, restraining premium-chiller penetration.[4]Mercom India, “Power-Hungry Data Centers Drive Demand for Renewable Energy,” mercomindia.com
*Our forecasts treat driver/restraint impacts as directional, not additive. The impact forecasts reflect baseline growth, mix effects, and variable interactions.
Segment Analysis
By Type of Cooling: Water-cooled systems drive efficiency gains
Water-cooled chillers held 51.85% of 2025 revenue, underscoring their indispensability for large industrial loads and hyperscale server halls. Air-cooled models, while less efficient, are clocking a 9.05% CAGR through 2031 as drought-prone regions and smaller commercial sites prize low water use and easier installation. Hybrid evaporative designs are emerging for dry climates, while coastal hubs continue to specify condenser-water loops for peak COP levels.
IoT overlays such as Voltas-TCS remote monitoring trim downtime and cut service costs, making both cooling types more attractive to operators working within the India chillers market. Free-cooling add-ons in northern states exploit cooler winters to slash compressor runtime, and evaporative modules are mitigating the high ambient temperatures typical of western corridors.


By Compressor Type: Screw units dominate, magnetic bearings accelerate
Screw compressors captured 37.05% revenue in 2025 thanks to their robust part-load performance across manufacturing and commercial sites. Magnetic-bearing centrifugal machines, free of oil and high in efficiency, are growing at 10.65% CAGR as data-center and pharma clients chase low TCO and tight environmental metrics. Kirloskar’s domestic launch positions India among the few geographies with local supply, bolstering self-reliance for this advanced segment.
Hitachi’s VM series posts COPs up to 7.0 and IPLV 9.5, illustrating why specifiers are rewriting tenders to favor magnetic bearings. Scroll compressors persist in low-capacity office parks, whereas niche reciprocating units endure in specialty chemical loops. The dearth of certified technicians, however, could curb rapid migration and temper near-term gains for the India chillers market.
By Refrigerant Type: HFC incumbency meets low-GWP surge
R-134a retained a 40.05% foothold in 2025, but Kigali targets are catapulting HFO blends to a 11.72% CAGR. Domestic investments by Navin Fluorine are buffering against import shocks, while Daikin’s R-32 advocacy shows OEMs hedging across multiple low-GWP pathways. Natural refrigerants—ammonia and CO₂—are inching into cold-chain niches, though safety code compliance and capex premiums still narrow their addressable slice.
HFC price volatility is triggering stockpiles and supplier diversification as manufacturers shelter margins. Meanwhile, BIS safety updates de-risk natural-refrigerant adoption in pharma and food plants, expanding options for the India chillers market without compromising on global warming targets.
By Capacity: Mid-range systems anchor commercial demand
Units rated 350TR to 700 TR accounted for 31.55% sales in 2025, balancing efficiency with footprint in malls, hospitals and multi-tenant office campuses. Sub-100 TR modules are scaling fastest at 10.15% CAGR because distributed data-center pods and modular real-estate designs need flexible, incremental cooling. Large central-plant machines above 700 TR continue to serve petrochemical and district-cooling schemes.
Variable-speed drives and staged compressor arrays now come standard even in mid-range models, sharpening energy profiles. Cold-chain logistics-a USD 45.8 billion segment by 2028-requires finely stepped capacities and redundancy, further widening the capacity mix for the India chillers market.
By End-user Industry: Commercial buildings lead, data centers surge
Commercial real estate absorbed 28.85% demand in 2025, covering offices, hotels and shopping centers where occupant comfort is paramount. Yet data centers are sprinting ahead at a 12.35% CAGR, as AI workloads reshape thermal-management needs. Pharma, chemicals and petrochemicals uphold steady baseline demand, particularly where process-cooling precision dictates product quality.
Retail mall dwell times rising 30% have sparked upgrades to higher-capacity HVAC, and food-processing plants gearing toward USD 535 billion value by 2026 require tight thermal control along the production chain. These trends diversify the India chillers market beyond traditional big-box applications.
Geography Analysis
West India retains the pole position with 27.05% of 2025 spending due to heavy industry, pharma and emergent data-center clusters around Mumbai. Water stress is encouraging end users to substitute air-cooled packages, while Gujarat’s 9-12% annual chemical growth sustains orders for process-grade water-cooled chillers that deliver stable outlet temperatures even at 48 °C ambient. The India chillers market size for the region continues to benefit from repeat retrofit cycles as plants chase PAT targets.
South India, forecast to clock a 9.25% CAGR to 2031, thrives on Bengaluru-Hyderabad-Chennai’s hyperscale data-center corridor and Tamil Nadu’s expanding EV supply chain. The India chillers market size for this zone is being propelled by renewable-energy integration, which helps operators balance PUE goals with grid-carbon mandates. Daikin’s Sri City plant gives OEMs local capacity to customize units for hot-humid coastal climates.
North India’s Continental belt features NCR commercial towers, Jaipur’s hospitality boom and Punjab’s agro-processing cold-store rollout, sustaining steady procurement of mid-range systems. East and Central India, though smaller today, are using Smart-Cities capex to embed district-cooling ready infrastructure, positioning them as future growth pivots of the India chillers market
Competitive Landscape
The India chillers market is moderately fragmented: global multinationals bring magnetic-bearing IP, while home-grown players win on price-performance and sprawling service arms. Johnson Controls’ USD 8.1 billion HVAC divestiture to Bosch sharpened its data-center focus and amplified investment in high-efficiency chillers. EV/EBITDA deal multiples at 16.5× signal that scale and digital capability fetch premiums.
Voltas’ IoT pact with TCS enables predictive maintenance, locking in annuity service streams and reducing unplanned shutdowns that plague tier-2 city installations. Kirloskar’s oil-free centrifugal launch gives indigenous manufacturers a toe-hold in the premium spectrum. Cooling-as-a-Service disruptors such as Kaer, operating a solar-powered chiller plant at Elpro Business Park, are testing subscription models that could shift capex to opex for end users within the India chillers market.
Skill gaps in magnetic-bearing upkeep represent a competitive moat for brands that invest early in technician academies. HFO supply security is another differentiator, with Navin Fluorine’s domestic plant insulating OEMs from overseas price shocks. Collectively, these strategic levers define positioning battles over the next decade.
India Chillers Industry Leaders
Carrier Corporation
Johnson Controls International Plc
Midea Group
Daikin Industries Limited
LG Electronics
- *Disclaimer: Major Players sorted in no particular order

Recent Industry Developments
- April 2025: Rajasthan unveiled its Data Center Policy 2025 targeting INR 20,000 crore investments, unlocking sizeable cooling demand.
- April 2025: BEE announced 46% tighter AC efficiency norms by 2027, likely downgrading today’s five-star units to one-star status.
- January 2025: LG Electronics detailed a roadmap to lift B2B revenue share to 45% by 2030 via chiller platform expansion.
- January 2025: Johnson Controls confirmed a record USD 13.1 billion backlog led by data-center orders


Research Methodology Framework and Report Scope
Market Definitions and Key Coverage
Our study defines the India chillers market as all newly manufactured vapor-compression and absorption machines rated above 20 Tons of Refrigeration that circulate chilled water or brine to cool buildings, production lines, or data-center racks across the country. Equipment supplied as part of central HVAC plants, process loops, and modular chiller banks is included.
Scope exclusion: portable spot coolers and window or split air-conditioners are outside this assessment.
Segmentation Overview
- By Type of Cooling
- Water-Cooled
- Air-Cooled
- By Compressor Type
- Screw
- Scroll
- Reciprocating
- Centrifugal
- Absorption
- By Refrigerant Type
- HFC (R-410A, R-134a)
- HFO/Low-GWP Blends
- Natural (Ammonia, CO?)
- By Capacity (Ton of Refrigeration/TR)
- Sub 100 TR
- 100 TR to 350 TR
- 350 TR to 700 TR
- Above 700 TR
- By End-user Industry
- Chemicals and Petrochemicals
- Food and Beverages
- Medical and Pharma
- Plastics and Rubber
- Commercial Buildings (Offices, Malls, Hotels)
- Data Centers
- Other Industries
- By Geography
- North India
- West India
- South India
- East India
- Central India
Detailed Research Methodology and Data Validation
Primary Research
Analysts held structured calls and plant walk-throughs with facility managers at pharma, plastics, and hyperscale data-center sites, alongside regional sales heads of chiller OEMs in West, South, and North India. These conversations tested secondary findings, revealed prevailing average selling prices, and clarified adoption barriers linked to low-GWP refrigerants.
Desk Research
We began with public datasets issued by the Bureau of Energy Efficiency's Chiller Star labeling program, import-export records from the Directorate General of Commercial Intelligence & Statistics, capacity additions reported in the India Cooling Action Plan, and operating statistics shared by the Refrigeration & Air-conditioning Manufacturers' Association. Company filings, stock exchange releases, and large project announcements carried by the Press Information Bureau added recent sales clues. Paid repositories such as D&B Hoovers and Dow Jones Factiva supplied plant-level revenue splits that anchored our industry totals. This list is illustrative; many additional sources informed data collection and cross-checks.
Market-Sizing & Forecasting
A top-down reconstruction starts with BEE model registrations and customs data to derive yearly unit shipments and installed TR, which are then valued using region-weighted ASPs. Results are corroborated through selective bottom-up checks, OEM production rolls, channel inventory observations, and sampled project invoices to refine totals. Key variables feeding the model include industrial production growth, gross leasable commercial floor space, planned data-center white-space, mean summer temperature anomalies, and refrigerant phase-down timelines; trends in each variable are forecast through multivariate regression guided by expert consensus. When shipment data are patchy, missing cells are bridged by three-year moving averages tied to allied HVAC equipment trends.
Data Validation & Update Cycle
Outputs pass anomaly scans, variance thresholds, and multi-analyst peer review before sign-off. We refresh every twelve months, and interim updates are triggered by material events such as mandatory efficiency revisions, ensuring clients receive an up-to-date baseline.
Why Mordor's India Chillers Baseline Wins Reliability
Published estimates often differ because firms choose distinct product cut-offs, pricing bases, and refresh cadences.
Key gap drivers here stem from whether absorption units are counted, if replacement parts are rolled into value, the method used to convert TR to revenue, and the frequency with which exchange rates and inflation are reset.
Benchmark comparison
| Market Size | Anonymized source | Primary gap driver |
|---|---|---|
| USD 0.74 B (2025) | Mordor Intelligence | - |
| USD 0.90 B (2023) | Regional Consultancy A | Adds installed base and export trans-shipments to annual sales |
| USD 0.63 B (2024) | Trade Journal B | Omits absorption chillers and uses list prices without regional discounting |
These comparisons show that, by selecting the right scope, validating unit flow with ground interviews, and updating figures yearly, Mordor Intelligence delivers a balanced, transparent baseline decision-makers can trust.


Key Questions Answered in the Report
What is the current size of the India chillers market?
The market is valued at USD 0.79 billion in 2026 and is projected to reach USD 1.09 billion by 2031.
Which cooling technology is most prevalent in India?
Water-cooled chillers dominate with 51.85% 2025 share, favored for large industrial and data-center loads.
Why are magnetic-bearing compressors gaining traction?
They offer oil-free operation, higher efficiency and reduced maintenance, propelling an 10.65% CAGR in India through 2031.
How will refrigerant regulations affect future demand
Kigali-mandated HFC phase-downs are accelerating adoption of HFO and natural refrigerants, reshaping product portfolios and procurement criteria across the India chillers market.
Which end-user segment is expanding fastest?
Data centers are growing at a 12.35% CAGR as AI workloads demand high-capacity, ultra-efficient cooling.
Page last updated on:


