Market Overview
| Study Period | 2021 - 2031 |
|---|---|
| Forecast Data Period | 2026 - 2031 |
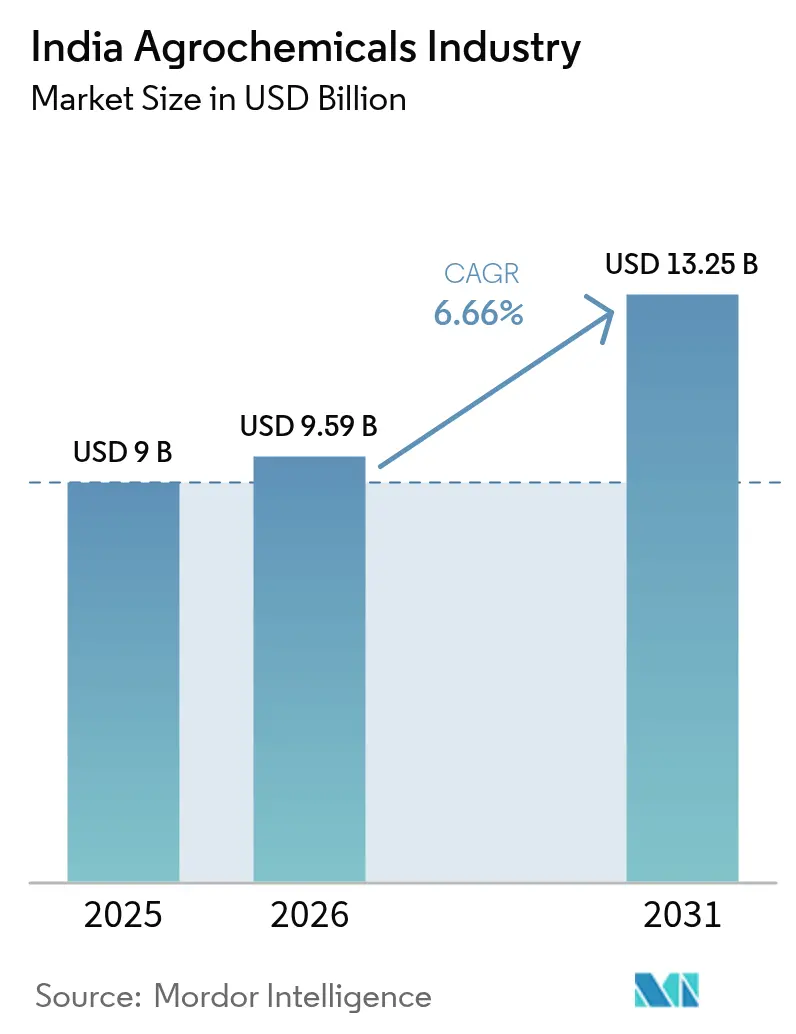
| Base Year Market Size (2025) | USD 9 Billion |
| Market Size (2026) | USD 9.59 Billion |
| Market Size (2031) | USD 13.25 Billion |
| Growth Rate (2026 - 2031) | 6.66% CAGR |
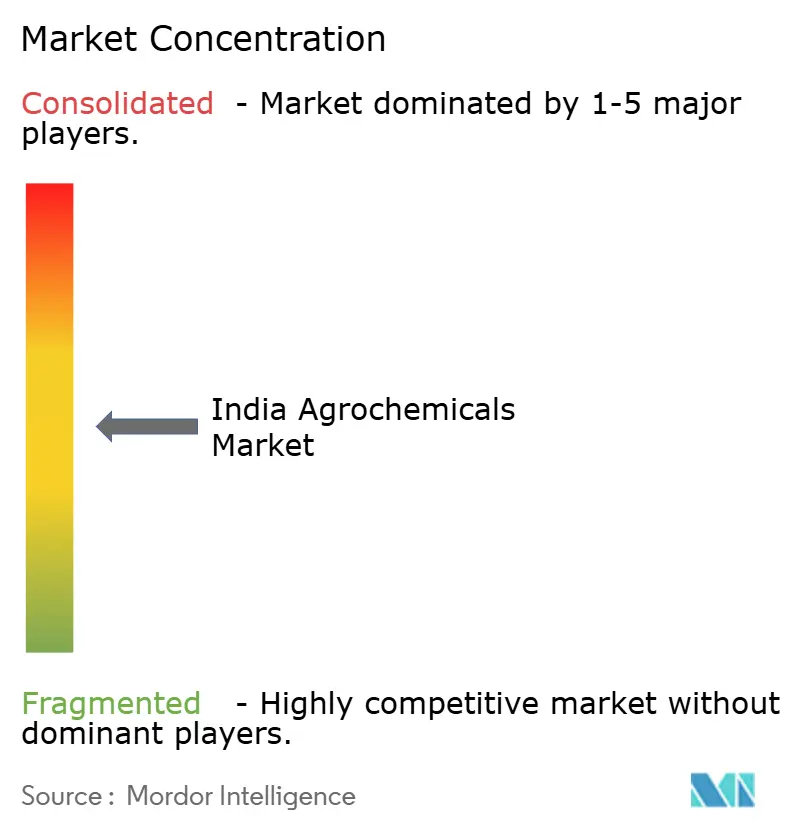
| Market Concentration | Medium |
Major Players *Disclaimer: Major Players sorted in no particular order Image © Mordor Intelligence. Reuse requires attribution under CC BY 4.0. | |
India Agrochemicals Industry Analysis by Mordor Intelligence
India Agrochemicals market size in 2026 is estimated at USD 9.59 billion, growing from 2025 value of USD 9 billion with 2031 projections showing USD 13.25 billion, growing at 6.66% CAGR over 2026-2031. Strong domestic manufacturing capacity, expanding export pipelines, and policy incentives that favor sustainable inputs are propelling this momentum. India remains the fourth-largest global producer, shipping finished products worth USD 5 billion each year to destinations in Europe, Southeast Asia, and West Africa [1]Source: S. Amin, “India’s Crop-Protection Exports Scale New High,” epw.in. Formulation science is also evolving, nano-nutrient liquids and water-dispersible granules are gaining farmer acceptance because they cut dosage rates and improve field safety. Nonetheless, raw-material dependence on China and a patchwork of state-level toxicity bans continue to inject cost volatility and compliance complexity into the India agrochemicals market.
Key Report Takeaways
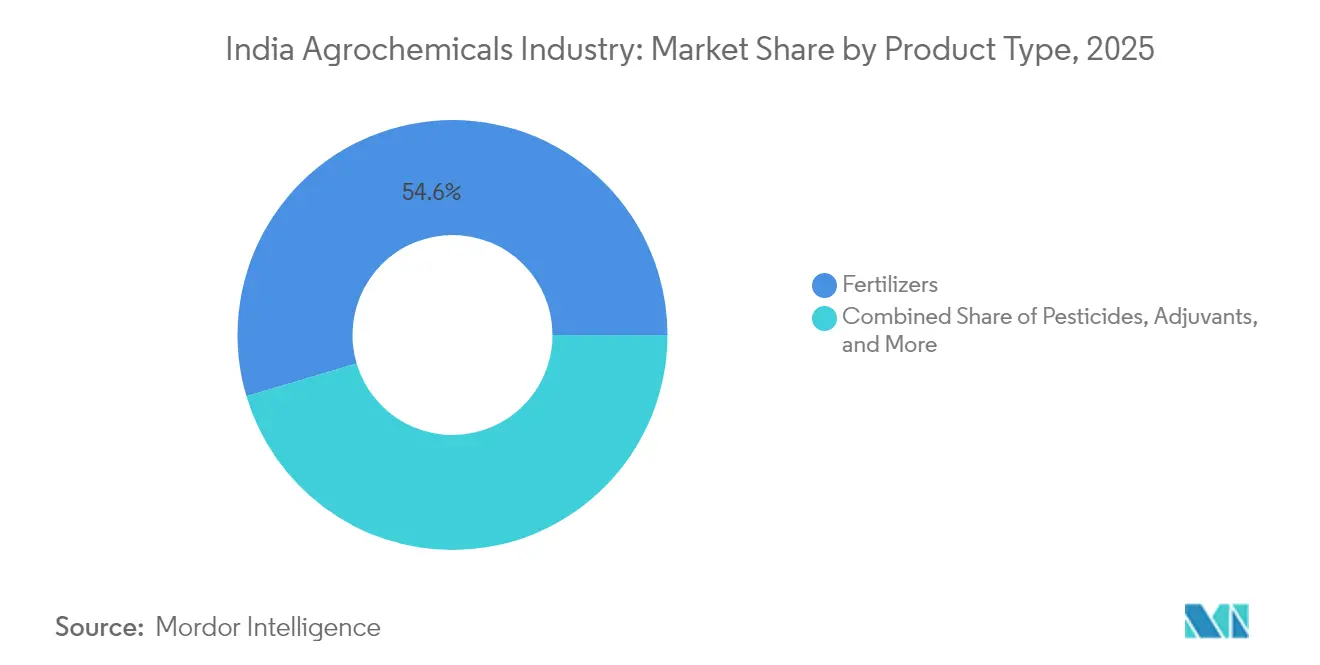
- By product type, fertilizers captured 54.60% of the India agrochemicals market share in 2025, while pesticides are on track to expand at a 10.12% CAGR through 2031.
- By application, grains and cereals accounted for 46.75% of the India agrochemicals market size in 2025, whereas fruits and vegetables are projected to accelerate at a 8.78% CAGR to 2031.
Note: Market size and forecast figures in this report are generated using Mordor Intelligence’s proprietary estimation framework, updated with the latest available data and insights as of 2026.
India Agrochemicals Industry Trends and Insights
Drivers Impact Analysis*
| Driver | (~) % Impact on CAGR Forecast | Geographic Relevance | Impact Timeline |
|---|---|---|---|
| Government subsidy rationalization spurring bio-inputs adoption | +1.8% | National, with early gains in Maharashtra, Punjab, Karnataka | Medium term (2-4 years) |
| Digitized agri-credit and e-commerce platforms expanding chemical reach | +1.2% | National, concentrated in Uttar Pradesh, Bihar, and West Bengal | Short term (≤ 2 years) |
| Drone-based precision spraying is unlocking untapped smallholder demand | +0.9% | North India and Western states, spill-over to South India | Medium term (2-4 years) |
| Off-patent molecule wave enlarges export pipeline | +1.4% | Global export markets, domestic manufacturing hubs in Gujarat, Maharashtra | Long term (≥ 4 years) |
| Climate-linked pest outbreaks are increasing pesticide intensity | +0.7% | National, with acute impact in Punjab, Haryana, Maharashtra | Short term (≤ 2 years) |
| Government schemes boosting domestic manufacturing capacity | +1.1% | National, concentrated in Gujarat, Maharashtra, and Andhra Pradesh | Long term (≥ 4 years) |
| Source: Mordor Intelligence | |||
Government Subsidy Rationalization Spurring Bio-inputs Adoption
New subsidy frameworks reward states for curbing blanket fertilizer consumption and channel budgetary support toward compost, biofertilizers, and nano-nutrient liquids. The 2025 Union Budget set aside for agriculture and launched the Prime Minister Dhan-Dhanya Krishi Yojana, creating a formal mechanism to reimburse farmers who switch to certified biologicals [2]Source: Staff reporter, “Subsidy Shift to Bio-fertilisers in Union Budget,” pib.gov.in. Parallel programs such as PM-PRANAM link disbursements to chemical reduction targets, encouraging administrators to fast-track training modules and field demonstrations.
Digitized Agri-credit and E-commerce Networks Widening Last-mile Reach
Government-funded digital infrastructure now integrates land records, soil health cards, and Kisan Credit Card limits into a unified farmer registry, allowing input companies to vet credit profiles in minutes and dispatch orders through app-based platforms. In 2024, Indian Farmers Fertiliser Cooperative Limited (IFFCO) e-Bazar, for instance, fulfilled more than 200,000 online transactions in the past fiscal year and delivered to 27,000 pin codes, a scale previously unimaginable for bulk inputs. For the India agrochemicals market, these digital rails translate into higher off-take of premium formulations, especially in tier-II districts where assortment depth had long been a constraint.
Drone-based Precision Spraying Unlocking Smallholder Demand
Government subsidies of up to 40% on drone purchases and service vouchers have lowered entry barriers for custom-hire entrepreneurs. Demonstration drives led by IFFCO covered 3 million acres across 12 states and proved that a single drone can spray one acre of paddy in under six minutes while trimming water use by 90%. As adoption grows, the India agrochemicals market benefits from higher demand for ultra-low-volume concentrates and adjuvants tailored for aerial application.
Off-patent Molecule Wave Expanding Export Pipeline
Three out of every four active ingredients sold globally are no longer under patent, opening a technology corridor for cost-competitive Indian producers. With 60% of sector revenue already export-linked, firms located in Gujarat’s Dahej and Maharashtra’s Tarapur clusters are scaling backward integration to secure intermediaries and cut freight costs. Overall, the driver reinforces the long-term growth arc of the Indian agrochemicals market by widening its global addressable base and incentivizing technology upgrades.
Restraints Impact Analysis*
| Restraint | (~) % Impact on CAGR Forecast | Geographic Relevance | Impact Timeline |
|---|---|---|---|
| Disruptive raw-material dependence on China is raising cost volatility | -1.6% | National manufacturing hubs, particularly Gujarat, Maharashtra | Short term (≤ 2 years) |
| Accelerating state-level bans on high-toxicity actives | -0.8% | National, with early implementation in Kerala, Punjab, Maharashtra | Medium term (2-4 years) |
| The growing counterfeit channel is eroding branded volumes | -0.5% | National, concentrated in Uttar Pradesh, Bihar, Madhya Pradesh | Medium term (2-4 years) |
| Intensifying resistance to legacy insecticides | -0.4% | National, acute in Punjab, Haryana, Maharashtra cotton belts | Long term (≥ 4 years) |
| Source: Mordor Intelligence | |||
Disruptive Raw-material Dependence on China Raising Cost Volatility
Indian plants import a bulk of technical intermediates such as bismuth, tellurium, and graphite from Chinese suppliers, leaving local formulators exposed to price swings and shipping delays during geopolitical flashpoints. Domestic producers must carry higher safety stocks, locking working capital and eroding margins when global freight rates spike. Government task forces have identified 10 critical minerals where India is 100% import-dependent and are drafting incentive packages to fast-track alternative sources.
Accelerating State-level Bans on High-toxicity Actives
Kerala, Punjab, and Maharashtra are leading a regulatory wave that restricts or phases out molecules flagged by the World Health Organization as highly hazardous. More than one-third of India’s 339 registered pesticides now fall into a watch list that could shrink portfolios if central or additional state authorities follow suit. The result is a mixed demand signal. While legacy sales taper off, safer bio-rational alternatives gain traction, slightly muting overall value growth in the India agrochemicals market during the transition phase.
*Our forecasts treat driver/restraint impacts as directional, not additive. The impact forecasts reflect baseline growth, mix effects, and variable interactions.
Segment Analysis
By Product Type: Fertilizers Lead Despite pesticides Surge
Fertilizers captured 54.60% of the India agrochemicals market size, and continue to anchor food security policies for rice, wheat, and sugarcane systems. Di-ammonium phosphate and urea dominate volumes, yet escalating subsidy reforms are nudging growers toward micronutrient blends and nano-liquids that minimize groundwater contamination.
Pesticides, though starting from a smaller base, are projected to add nearly incremental sales by 2031 at a 10.12% CAGR, underpinned by compost incentives, residue-linked export standards, and expanding organic certification acreage. The rising popularity of microbial consortia and seaweed-based stimulants is encouraging conventional fertilizer majors to launch dedicated bio-divisions. Producers that master shelf-life extension, cold-chain independent packaging, and farmer education stand to capture early mover loyalty.


By Application: Grains Drive Volume While Horticulture Accelerates
Grains and cereals commanded 46.75% of the India agrochemicals market size in 2025, reflecting the scale of paddy, wheat, and maize acreage across the Indo-Gangetic plain. Government procurement price floors insulate growers from cyclical dips and sustain input demand even in sub-normal monsoon years. Fruits and vegetables, while contributing a smaller revenue share today, are projected to expand at a 8.78% CAGR as export-class mangoes, grapes, and bananas shift to trellis, fertigation, and climate-controlled environments that lift input intensity.
Demand for residue-compliant fungicides and biorational insecticides is rising in greenhouse clusters around Pune, Bengaluru, and Nashik. Oilseed and pulse acreage are relatively price-sensitive but benefit from national self-sufficiency missions that subsidize sulfur-rich fertilizers and bio-nitrogen fixers.

Geography Analysis
West India plays a significant role in the market, on the back of Maharashtra’s sugarcane mills and Gujarat’s cotton ginners, both of which rely on high nutrient and pesticide loads to protect yields. Proximity to deep-sea ports and chemical parks further shortens supply chains . South India is projected to clock impressive growth as horticulture clusters in Tamil Nadu, Karnataka, and Andhra Pradesh migrate to greenhouse and precision-fertigation systems that multiply per-acre agrochemical spends.
South India is the most dynamic theatre for premium inputs. Greenhouse vegetable acreage around Bengaluru has doubled in five years, stimulating demand for residue-free biofungicides, amino-acid chelates, and drone-calibrated micronutrient cocktails. Andhra Pradesh’s aquaculture boom feeds back into allied crop sectors by augmenting farmer incomes that are reinvested in high-density banana and papaya orchards requiring weekly pest-scouting and corrective sprays. Importantly, logistical corridors through Chennai, Krishnapatnam, and Tuticorin ports support back-haul efficiencies for suppliers, lowering landed costs.
North India’s wheat-rice-mustard rotation keeps baseline volumes high, yet groundwater ordinances in Punjab and Haryana are persuading growers to adopt direct-seeded rice and laser leveling. These practices cut irrigation requirements but also marginally lower pre-emergence herbicide usage. Bihar and Uttar Pradesh remain candidates for rapid growth as the government ramps up rural warehousing and cold-chain funding, thereby upgrading market linkages that reward better quality.
Competitive Landscape
The supply side is moderately fragmented, the top five manufacturers together creating room for niche specialists in biologicals, micronutrients, and drone-compatible ultra-low-volume concentrates. UPL leads and complements its 25,000-dealer footprint with a data-rich Nurture Farm platform that pushes advisory messages to more than 3 million mobile numbers each week.
Strategic collaborations are multiplying. UPL and Aarti Industries have formed a 50:50 joint venture focused on specialty amines and other high-value intermediates, aiming for a USD 60 million annual turnover within three years. Chemplast Sanmar is investing to double its custom-manufacturing capacity for active ingredients near Cuddalore, signaling confidence in the export-linked visibility of its pipeline. Meanwhile, Sharda Cropchem, a formulators-turned-registration specialist, is broadening its European dossiers to hedge against price competition in saturated post-patent molecules.
Technology integration is now a decisive battleground. Crop-scouting AI modules, sachet-sized drone payloads, and SKUs equipped with encrypted QR codes for anti-counterfeit tracking are redefining value propositions. Producers that embed stewardship training for resistance management and safe-handling practices into their sales model are likely to gain regulatory goodwill as well. Over the forecast period, consolidation is projected in commodity herbicides, while differentiated biologicals attract venture-funded startups eager to plug knowledge gaps in rapid field validation protocols. Such cross-currents keep competitive intensity high, yet they collectively elevate product sophistication across the India agrochemicals market.
India Agrochemicals Market Leaders
Bayer AG
IFFCO
Syngenta India Private Limited
UPL Ltd.
PI Industries Limited
- *Disclaimer: Major Players sorted in no particular order

Recent Industry Developments
- July 2025: The Government of India has signed the India-UK Free Trade Agreement, which will eliminate tariffs on approximately 99% of tariff lines, including organic chemicals and agrochemical products. This will significantly improve the competitiveness of Indian agrochemical exports in the United Kingdom market and create enhanced opportunities for manufacturers.
- March 2025: ICAR launched two genome-edited rice varieties, DRR Dhan 100 Kamala and Pusa DST Rice 1, offering 25% higher yields and enhanced climate resilience. DRR Dhan 100 Kamala can be harvested 15-20 days earlier and uses resources efficiently, while Pusa DST Rice 1 demonstrates salinity tolerance with higher yields in saline conditions, potentially reducing pesticide requirements through improved disease resistance.
- January 2025: UPL and Aarti Industries launched their joint venture for specialty chemical manufacturing, combining UPL's agrochemical expertise with Aarti's chemical intermediate capabilities to serve downstream amine derivative markets.


Research Methodology Framework and Report Scope
Market Definitions and Key Coverage
Our study defines the Indian agrochemicals market as the yearly revenue earned from fertilizers, synthetic and bio-based crop-protection chemicals, plant-growth regulators, adjuvants, and biostimulants that are applied on farm fields to raise yield and protect crops from pests, weeds, and diseases. The numbers capture domestic consumption plus net exports priced at domestic-currency average selling prices before retailer mark-ups.
Home-garden packs and upstream bulk chemical intermediates are not counted.
Segmentation Overview
- By Product Type
- Fertilizers
- Nitrogenous
- Phosphatic
- Potassic
- Other Fertilizers
- Pesticides
- Herbicides
- Insecticides
- Fungicides
- Other Pesticides
- Adjuvants
- Plant Growth Regulators
- Fertilizers
- By Application
- Cereals and Grains
- Pulses and Oilseeds
- Fruits and Vegetables
- Commercial Crops
Detailed Research Methodology and Data Validation
Primary Research
Structured conversations with field agronomists, state-level agri-input distributors, formulation plant managers, and regulators across all five agro-climatic zones help us validate demand swings, channel inventories, average selling prices, and policy impacts before we lock model assumptions.
Desk Research
We begin by extracting time-series on cropped area, fertilizer offtake, registered pesticide technicals, and trade flows from sources such as the Ministry of Agriculture & Farmers Welfare, Directorate of Plant Protection, Quarantine & Storage, FAOSTAT, OECD-FAO Outlook, Fertiliser Association of India, and ICAR journals. These streams anchor production, import, and usage baselines.
Next, our team screens corporate filings, stock-exchange disclosures, tender notices, and major press releases, then consults paid intelligence tools, D&B Hoovers for company revenues and Volza for shipment-level export data, to sense-check value and price ranges. The list above is illustrative; many additional references feed the evidence pool.
Market-Sizing & Forecasting
A top-down model converts production, import, and export tonnage into value through weighted average selling prices. Supplier roll-ups and sampled dealership checks provide the bottom-up cross-reference. Key variables like cropped acreage, nutrient application norms, registered molecule count, monsoon rainfall index, export price realization, and farm-labor cost inflation drive year-on-year changes. Multivariate regression with scenario cushions projects these drivers to 2030, while gaps in micro data are bridged using nearest published proxies and expert estimates that have passed our consistency screens.
Data Validation & Update Cycle
Outputs pass two internal review loops where analysts compare results with independent trade and price indicators, investigate variances, and revise where necessary. Mordor's dashboards refresh annually, and interim updates are triggered when policy shifts, weather shocks, or major capacity additions create material divergence.
Why Mordor's India Agrochemicals Baseline Commands Reliability
Published figures often differ because research houses pick unequal product baskets, convert currencies at varied dates, or bake in untested growth levers.
By aligning scope to on-farm spend and by revisiting core variables every year, Mordor Intelligence offers a balanced reference point that decision makers can retrace easily.
Benchmark comparison
| Market Size | Anonymized source | Primary gap driver |
|---|---|---|
| USD 9.0 B (2025) | Mordor Intelligence | - |
| USD 15.5 B (2024) | Global Consultancy A | Includes retail garden inputs and seed treatments; limited price normalization |
| USD 11.2 B (2025) | Industry Journal B | Relies mainly on export receipts; domestic consumption modeled from trade ratios |
| USD 33.2 B (2023) | Regional Consultancy C | Combines fertilizer subsidy outlays with farm-gate spend; older base year |
These comparisons show that inflated scopes or dated baselines widen the spread, whereas Mordor's disciplined segmentation, annual refresh cadence, and variable-level corroboration deliver a dependable, transparent benchmark for the Indian agrochemicals landscape.


Key Questions Answered in the Report
What is the current size of the India agrochemicals market?
The market stands at USD 9.59 billion in 2026 and is projected to reach USD 13.25 billion by 2031.
Which product category holds the largest share?
Fertilizers lead with 54.60% of revenue in 2025, reflecting continued reliance on conventional nutrients.
How fast are fruits and vegetables segment is growing?
Fruits and vegetables are forecast to advance at a 8.78% CAGR through 2031, the fastest rate among all product types.
Which region shows the strongest growth outlook?
South India is projected to grow at an 7.95% CAGR between 2026 and 2031, driven by high-value horticulture expansion.
How are government policies shaping market demand?
Subsidy reforms favor bio-inputs, while drone and digitization incentives broaden access to precision application technologies.
Page last updated on:


