Immersive Technologies Market Size and Share
Market Overview
| Study Period | 2020 - 2031 |
|---|---|
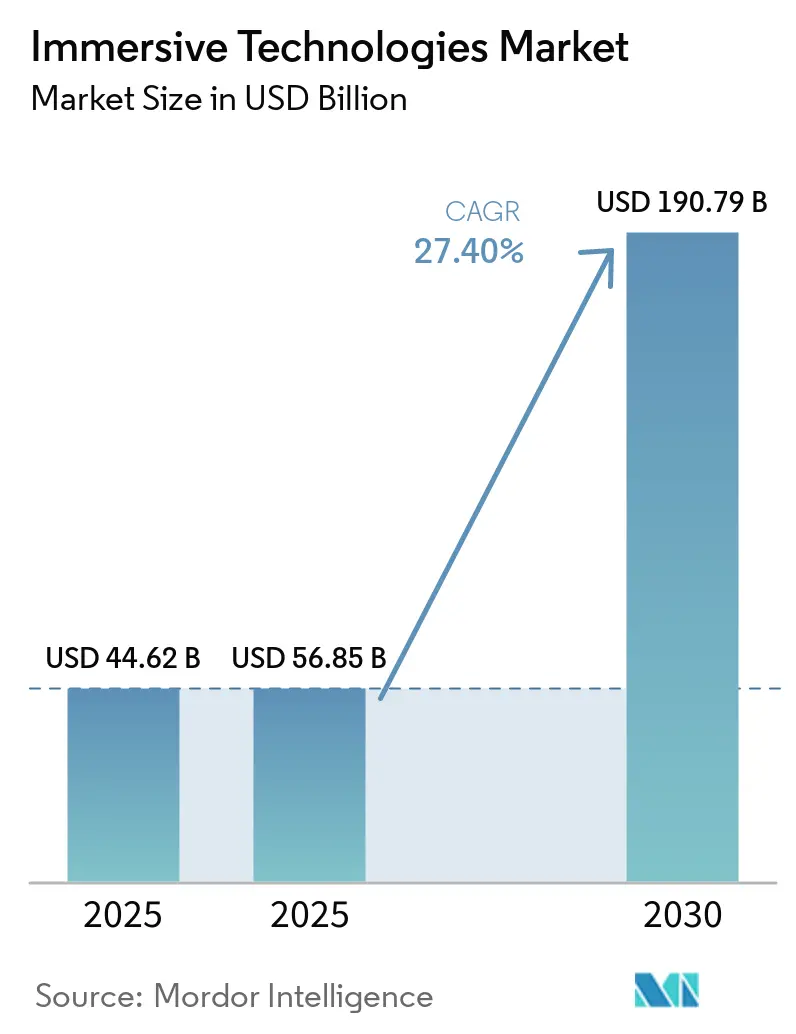
| Market Size (2025) | USD 56.85 Billion |
| Market Size (2030) | USD 190.79 Billion |
| Growth Rate (2026 - 2030) | 27.40% CAGR |
| Fastest Growing Market | Asia Pacific |
| Largest Market | North America |
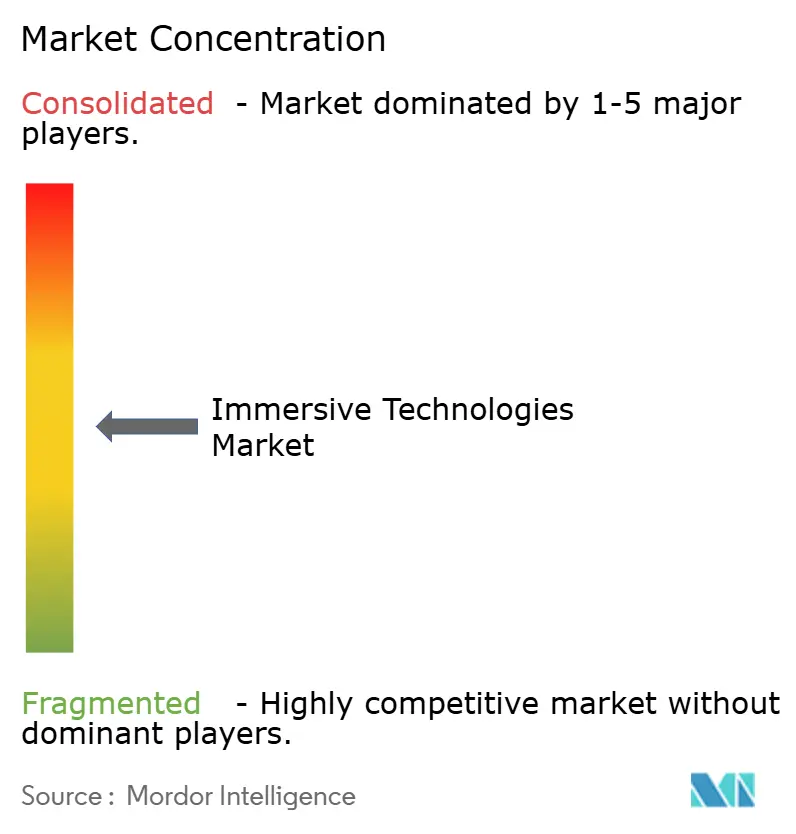
| Market Concentration | Medium |
Major Players *Disclaimer: Major Players sorted in no particular order Image © Mordor Intelligence. Reuse requires attribution under CC BY 4.0. | |
Immersive Technologies Market Analysis by Mordor Intelligence
The immersive technologies market size reached USD 44.62 billion in 2025 and is forecast to expand to USD 152.73 billion by 2030, reflecting a 27.90% CAGR during the period. Accelerated chipset innovation, maturing 5G edge networks, and enterprise mandates to streamline training and collaboration are propelling the immersive technologies market well beyond its original consumer-gaming niche. Hardware advances that cut weight and boost visual acuity are lowering barriers to adoption, while managed services are converting one-time sales into recurring revenue streams. Regional stimulus funding, most prominently in China and the United States, is nurturing domestic supply chains that reduce component risk and encourage localized content ecosystems. Meanwhile, privacy regulations and emerging health-safety standards are shaping product design, accelerating the shift toward lightweight optics and eye-safe display engines. Competitive intensity is rising as platform vendors race to embed generative AI, which personalizes content and improves retention, into every layer of the value chain.
Key Report Takeaways
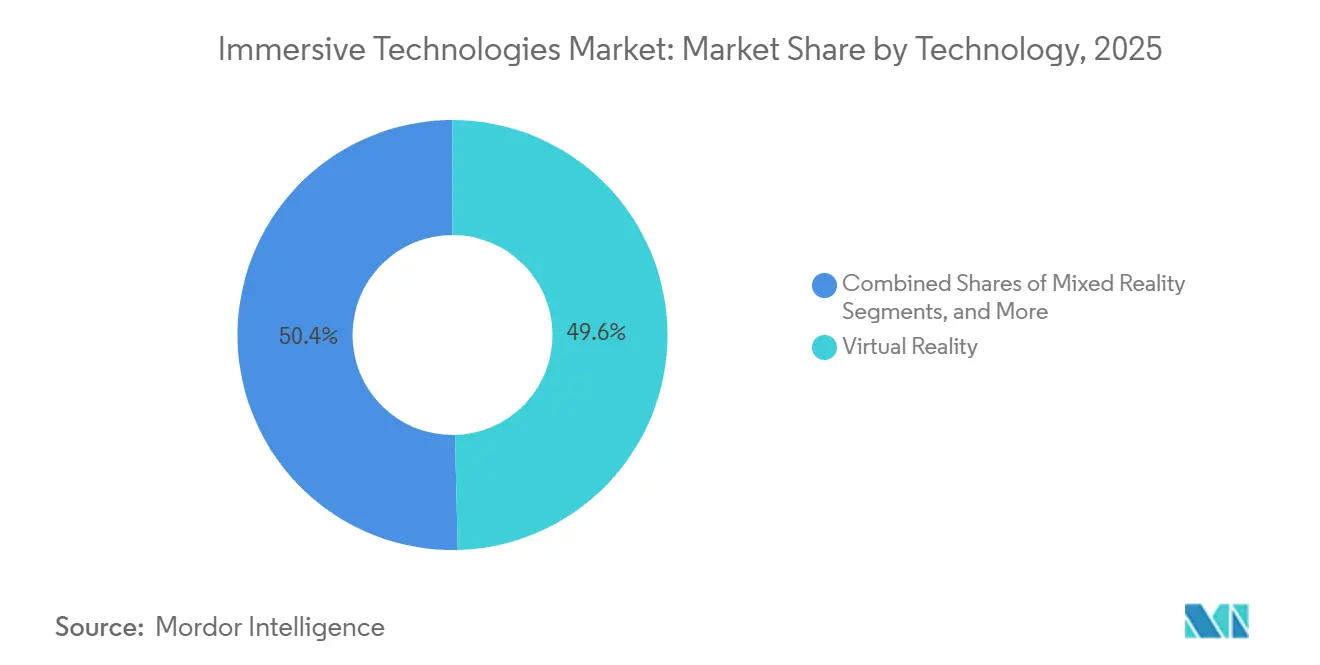
- By technology, virtual reality commanded 31.8% of the immersive technologies market in 2025, while mixed reality is advancing at a 32.3% CAGR through 2031.
- By component, hardware led with 63.9% revenue share of the immersive technologies market in 2025, and services are forecast to expand at a 31.8% CAGR to 2031.
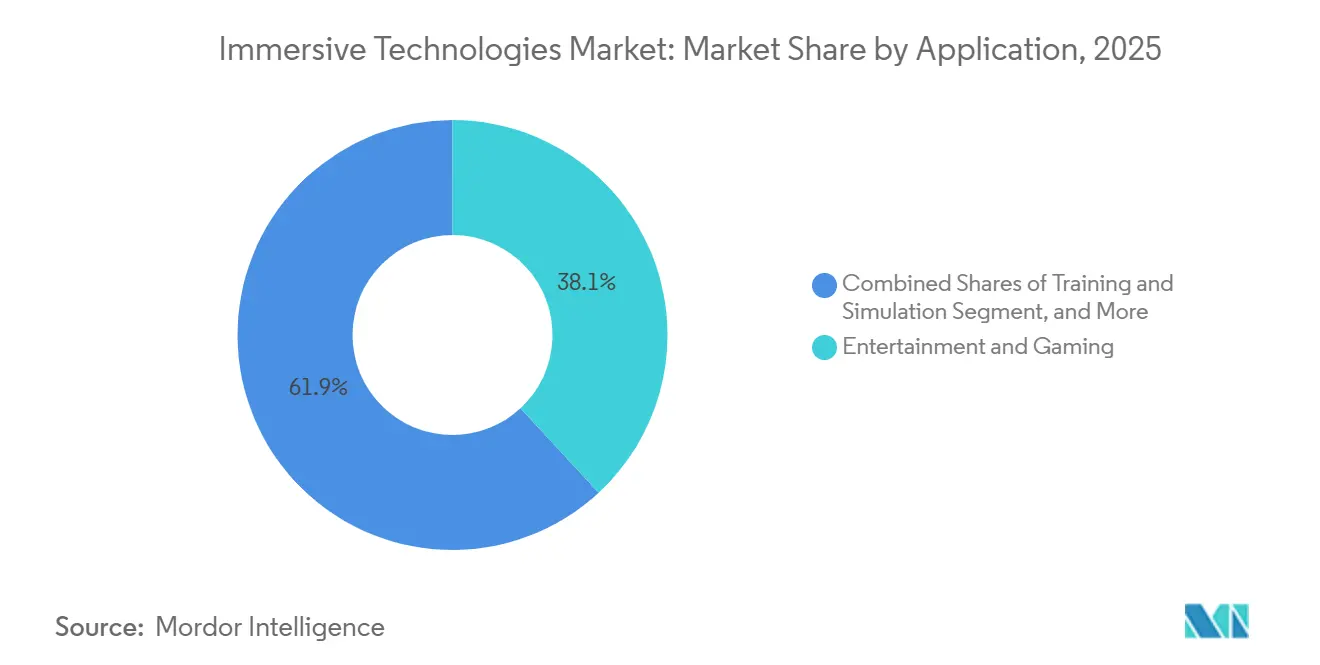
- By end-user industry, gaming and entertainment held 44.2% revenue share of the immersive technologies market in 2025 spending and healthcare and life sciences are growing at a 29.8% CAGR through 2031.
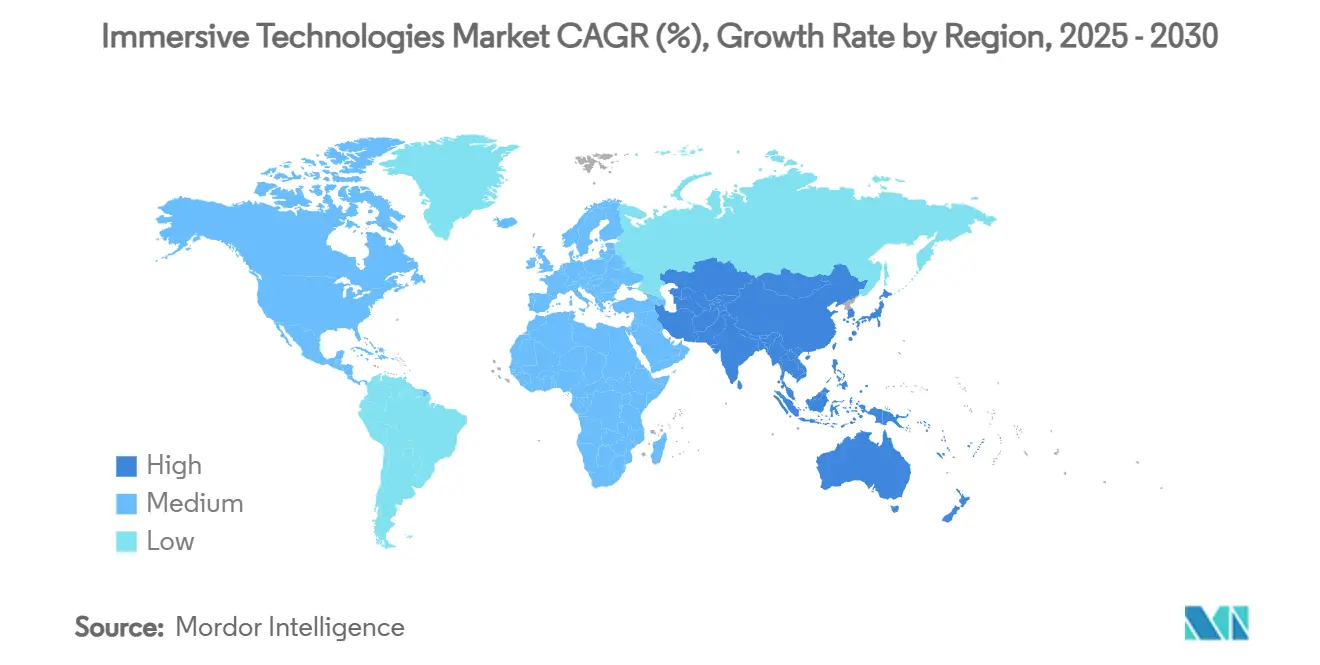
- By geography, North America accounted for 27.4% revenue of the immersive technologies market in 2025, whereas Asia-Pacific is projected to grow at a 32.6% CAGR between 2026-2031.
Note: Market size and forecast figures in this report are generated using Mordor Intelligence’s proprietary estimation framework, updated with the latest available data and insights as of January 2026.
Global Immersive Technologies Market Trends and Insights
Drivers Impact Analysis*
| Driver | (~) % Impact on CAGR Forecast | Geographic Relevance | Impact Timeline |
|---|---|---|---|
| Enterprise training and simulation cost-reduction initiatives | +8.50% | Global, concentrated in North America and Europe | Medium term (2–4 years) |
| Surging consumer AR and VR headset adoption for gaming and entertainment | +6.20% | Global, led by North America and Asia-Pacific | Short term (≤ 2 years) |
| 5G edge rendering enabling lighter, cheaper wearables | +5.30% | Asia-Pacific core, spill-over to North America and Middle East | Medium term (2–4 years) |
| Photogrammetry-based digital twins accelerating design cycles | +4.60% | Global, with manufacturing clusters in Germany, Japan, United States | Long term (≥ 4 years) |
| Declining hardware ASPs driven by next-gen chipsets | +4.10% | Global, with Asia-Pacific manufacturing hubs accelerating | Medium term (2–4 years) |
| Content-as-a-Service business models unlocking recurring revenue | +3.80% | North America and Europe early adopters, Asia-Pacific following | Long term (≥ 4 years) |
| Source: Mordor Intelligence | |||
Enterprise Training and Simulation Cost-Reduction Initiatives
Enterprises validate immersive deployments when financial models prove that shorter training cycles offset upfront device costs. Surgical rehearsal in orthopedics trimmed average operating-room time by 18 minutes and lowered complications by 15-20%. Manufacturers such as Roche compressed pharmaceutical line validation from six months to eight weeks using digital twins. At scale, fleets above 500 headsets reduce per-seat licensing by 35%, turning previously experimental pilots into standard operating procedure. These gains make the immersive technologies market attractive even to budget-constrained sectors seeking measurable productivity boosts.
Surging Consumer AR and VR Headset Adoption for Gaming and Entertainment
Consumer momentum spills into the enterprise when employees bring headset familiarity to work. China shipped 18 million consumer units in 2025, a 50% jump in one year. Meta’s Ray-Ban smart glasses surpassed 1 million sales by mid-2025, showing that slimmer designs broaden appeal. Japan’s metaverse spending is tracking toward JPY 1 trillion (USD 7.3 billion) in 2026 because virtual concerts and avatar commerce monetize longer engagement. Stand-alone headsets now launch in under three minutes, a usability leap that raised daily active users by 40% in Meta’s ecosystem. The resulting familiarity lowers corporate onboarding time and accelerates project approval for new immersive rollouts.
5G Edge Rendering Enabling Lighter, Cheaper Wearables
Rendering at the network edge shifts compute from the headset to nearby servers, allowing lighter casings and longer battery life. Verizon and AWS delivered sub-20-millisecond latency in fifteen U.S. metros, enabling real-time remote guidance without perceptible lag. China Mobile’s 5G-Advanced footprint reached 95% of prefecture-level cities, supporting synchronized multi-user sessions with five-centimeter positional accuracy. Enterprises can now convert capital purchases into usage-based network fees that flex with demand. Seasonal industries such as retail spin up additional capacity during holiday peaks instead of buying surplus devices. The resulting cost elasticity is a critical driver for the immersive technologies market as firms look to avoid large periodic refreshes.
Photogrammetry-Based Digital Twins Accelerating Design Cycles
High-resolution scanning transforms physical assets into photo-realistic digital replicas. Automotive and aerospace engineers use these twins to test ergonomics and assembly sequences, cutting prototype iterations by 25-30%.[1]MDPI Contributors, “Photogrammetry Digital Twins in Manufacturing,” mdpi.com Pharmaceutical producer Roche reported a 30% acceleration in biologics time-to-market after mapping eight global plants with photogrammetry. The approach removes travel and re-work, letting cross-disciplinary teams collaborate in shared virtual spaces. As more firms embed twin workflows into product-lifecycle management, demand rises for services that maintain models and spatial data. This recurring services layer reinforces the upward trajectory of the immersive technologies market.
Restraints Impact Analysis*
| Restraint | (~) % Impact on CAGR Forecast | Geographic Relevance | Impact Timeline |
|---|---|---|---|
| High upfront capex for enterprise-grade deployments | -4.2% | Global, particularly acute in emerging markets | Short term (≤ 2 years) |
| Health and safety concerns (eye strain, cybersickness) | -2.8% | Global, with stricter regulations in EU & North America | Medium term (2-4 years) |
| Supply-chain reliance on rare-earth magnets for haptics | -1.5% | Global, with concentration risk in China supply chains | Medium term (2-4 years) |
| Spatial-data privacy and sovereignty regulations | -1.1% | EU & North America leading, expanding globally | Long term (≥ 4 years) |
| Source: Mordor Intelligence | |||
High Upfront Capex for Enterprise-Grade Deployments
Comprehensive rollouts often require USD 50,000-USD 500,000 for hardware fleets, software licenses, and integration, which stretches payback beyond typical IT refresh windows. Smaller firms in emerging markets face scarce local integrators and must import expertise at daily rates above USD 2,000, adding 25-30% to project budgets. Financing models such as XR as a Service remain below 15% penetration because three-year minimum terms and double-digit effective interest rates blunt liquidity benefits. CFOs delay fleet orders until pilots prove ROI, slowing conversion from proof of concept to production use. Longer hardware life cycles will gradually ease this restraint, but capital intensity still tempers the near-term outlook for the immersive technologies market.
Health and Safety Concerns (Eye Strain, Cybersickness)
Up to 70% of users experience discomfort during sessions exceeding thirty minutes, especially when frame rates or latency fluctuate. A 2024 longitudinal study found that 22% of enterprise participants reduced session frequency and 8% quit immersive tools entirely because of nausea and eye strain. German regulators now recommend thirty-minute exposure caps with mandatory breaks, conflicting with many sixty-minute training modules.[2]OECD Policy Division, “Emerging Rules for Biometric Data in Immersive Media,” oecd.org Manufacturers raised panel refresh rates from 90 Hz to 120 Hz and adopted gaze-based foveated rendering that cuts GPU load by 30%.[3]Qualcomm Staff, “Snapdragon XR2+ Gen 2 Specifications,” Qualcomm.com Hybrid workflows mixing virtual reality for orientation and augmented overlays for task execution are emerging as a practical mitigation path.
*Our forecasts treat driver/restraint impacts as directional, not additive. The impact forecasts reflect baseline growth, mix effects, and variable interactions.
Segment Analysis
By Technology: Mixed Reality Gains on Virtual Reality Leadership
Virtual reality accounted for 31.8% of revenue in 2025, dominating entertainment and fully immersive training programs. The immersive technologies market share is gradually shifting as mixed reality accelerates at a 32.3% CAGR through 2031, thanks to full-color passthrough that lets users see tools and teammates during digital interaction. Apple Vision Pro and Meta Quest 3 both toggle between VR and MR modes, eliminating procurement dilemmas and cutting device inventory. In manufacturing lines and operating rooms, teams favor MR for multi-hour workflows where physical situational awareness is mandatory. Augmented reality maintains a niche for field-service guidance because it overlays schematics without isolating the wearer. Extended reality serves as procurement shorthand for multi-modal deployments and increasingly appears in enterprise RFPs. Convergence is likely as software platforms speak to device-agnostic runtimes, letting firms deploy the right mode for each task without locking into single-use hardware.
Demand for MR elevates service engagements that integrate computer vision, spatial mapping, and safety certification. Integrators report that MR rollouts take 30% longer than VR because physical-world occlusion and object anchoring must remain precise. Nevertheless, per seat economics improve once deployments reach 500 devices, which is when shared content libraries amortize engineering costs. As vendors refine onboard depth sensors and pass-through latency falls below fifteen milliseconds, user comfort grows and dwell times lengthen. The resulting productivity boost reinforces MR’s position as the primary growth engine for the immersive technologies market.


By Component: Services Accelerate as Integration Dominates Value Creation
Hardware captured 63.9% of 2025 spending, reflecting the headset fleets that launched many proof-of-concept pilots. Yet services are scaling at a 31.8% CAGR because enterprises now purchase multi-year managed offerings that include content refresh, analytics, and user support. The immersive technologies market size for services is projected to outpace device revenue before 2031 as buyers trade capital expense for predictable operating budgets. Integrators bundle hardware leasing, custom 3D asset creation, and 24-hour help desks into contracts priced at USD 100,000-USD 2 million per year. Software platforms benefit indirectly because robust services teams drive higher seat utilization and license renewals.
Inside-out optical tracking has eliminated external base stations, shrinking set-up from forty-five to five minutes and making pop-up classrooms possible on factory floors. Collaborative display walls regain interest for design reviews because ten stakeholders can view a twin without donning separate headsets. Service providers add value by curating these multimodal environments and ensuring data security across devices and cloud endpoints. As regulations tighten around biometric information, compliance consulting further inflates the services opportunity. Hardware vendors respond by opening SDKs and partnering with integrators, a symbiosis that cements services as the fastest-growing slice of the immersive technologies market.
By Application: Training and Simulation Deliver Tangible ROI
Entertainment generated 38.1% of application revenue in 2025, but training and simulation are expanding at a 30.1% CAGR through 2031, the highest among all use cases. A PwC study of 1,500 workers found VR-trained staff completed tasks four times faster and retained knowledge 275% better than classroom learners, edging per-employee savings toward USD 1.2 million for a 10,000-person firm. The immersive technologies market size for training tools captures these gains, convincing line managers to reallocate travel and workshop budgets to headsets and content libraries.
Remote collaboration surged after pandemic restrictions, with shared 3D environments enabling globally dispersed engineers to cut design reviews from weeks to days. Photogrammetry-enabled digital twins reduce prototype iterations by 25-30%, while retail visualization boosts online conversion 20-40%. Patient therapy and surgical planning show the clearest clinical outcomes, achieving 15-20% fewer intraoperative complications. Marketing and virtual showrooms remain exploratory, yet brands continue funding pilots because immersive engagement yields richer customer insight than flat media. Collectively, these use cases underpin sustained demand and deepen wallet share within the immersive technologies market.
By End-User Industry: Healthcare Momentum Builds on Clinical Proof
Gaming and entertainment commanded 44.2% of end-user spending in 2025. Healthcare and life sciences are advancing at a 29.8% CAGR because hospitals now budget for immersive surgical rehearsal after peer-reviewed trials confirmed shorter operations and fewer complications. Pharmaceutical manufacturers deploy digital twins across eight Roche sites, shaving validation time by two-thirds and accelerating biologics releases. Education sectors insert immersive STEM modules that lift test scores 35%, an early indicator of future mainstream adoption.
Industrial firms train assembly technicians in virtual replicas of aircraft, navy vessels, and automotive lines, avoiding downtime on high-value assets. Retailers pilot virtual try-on to raise conversion by up to 40%, but weigh gains against implementation costs of nearly USD 300,000. Energy and utility operators use VR for hazardous-environment rehearsal where physical simulation would be dangerous or impractical. This diversified demand base shields the immersive technologies market from over-reliance on any single vertical and supports steady expansion through 2031.
Geography Analysis
North America generated 27.4% of 2025 revenue and remains a reference region for enterprise best practices in manufacturing, healthcare and defense. Buyers emphasize integration with legacy IT and favor suppliers that document cybersecurity compliance. Federal training budgets and defense research grants ensure a baseline of multi-year demand, even when consumer sentiment fluctuates. Services partners cluster around metropolitan hubs, enabling nationwide coverage without diluting quality.
Asia-Pacific is the fastest climber at a 32.6% CAGR through 2031 as governments classify immersive labs as strategic infrastructure. China achieved 45% domestic device autonomy and 60% component localization in 2025, insulating production from export controls. India earmarked INR 391.15 crore (USD 46.8 million) for the Indian Institute of Creative Technologies and embedded AVGC labs in 15,000 schools and 500 colleges.[4]Press Information Bureau India, “Union Budget 2026 Immersive Technology Allocations,” pib.gov.in Such public investment creates a predictable pipeline demand that venture funding can leverage. Regional vendors like Pico hold more than 25% of China’s unit shipments, showing that local champions can thrive alongside multinationals.
Europe benefits from GDPR and the EU AI Act, which clarify biometric data rules and shorten enterprise procurement cycles in regulated sectors. Clear sovereignty guidelines lift buyer confidence, though compliance adds consulting overhead that favors vendors with dedicated legal teams. South America and the Middle East and Africa trail because 5G build-outs and device import duties raise effective headset prices by up to 50%. Nonetheless, pilot programs in Brazil and Saudi Arabia demonstrate pent-up interest once connectivity barriers fall. Overall, geographic diversification anchors the long-term resilience of the immersive technologies market.

Competitive Landscape
The immersive technologies market exhibits moderate concentration, with major players like Meta Platforms, Microsoft, Apple, Sony, and HTC collectively accounting for approximately 55-60% of hardware revenue in 2025. Despite this dominance in hardware, the software and services segment remains highly fragmented, with hundreds of specialized providers competing for market share. Meta’s Reality Labs reported operating losses of USD 4.4 billion in Q3 2024 but still increased Quest 3 prices in 2025 due to rising component costs. This move highlights Meta’s strategy to prioritize ecosystem lock-in over immediate profit margins. Meanwhile, Apple has positioned its Vision Pro headset at a premium price of USD 3,499, targeting professional creators who value seamless integration with macOS workflows. This approach contrasts sharply with Meta’s subsidized pricing strategy aimed at capturing the mass market.
Emerging disruptors are reshaping the competitive landscape of the immersive technologies market. Pico, for instance, utilized TikTok’s recommendation engine to personalize industrial training modules, enabling it to secure a 25% market share in its home country. Similarly, Varjo achieved significant success in the aviation sector by meeting FAA visual-fidelity standards with its 70 pixels-per-degree resolution technology. These advancements underscore the growing importance of innovation in capturing niche markets. Additionally, strategic alliances are shifting focus from hardware specifications to edge-cloud performance. Unity and AWS, for example, have integrated Wavelength Zones, allowing developers to render scenes closer to users and reduce client power consumption by 40%. Such collaborations are driving efficiency and enhancing user experiences.
Regulatory challenges are also influencing the market dynamics, particularly for smaller entrants. The EU AI Act has introduced compliance complexities that create significant barriers for new players. These regulations indirectly benefit established incumbents, as they often have dedicated regulatory affairs teams to navigate such challenges effectively. This regulatory environment is fostering a competitive advantage for larger firms while limiting opportunities for smaller companies to scale. As a result, the market is witnessing a consolidation of power among key players who can afford to invest in compliance and innovation. The interplay between regulatory frameworks, technological advancements, and strategic partnerships will continue to shape the immersive technologies market in the coming years.
Immersive Technologies Industry Leaders
Meta Platforms (Reality Labs)
Microsoft Corporation
Apple Inc.
HTC Corporation (Vive)
Sony Group Corporation
- *Disclaimer: Major Players sorted in no particular order

Recent Industry Developments
- April 2026: Samsung, Qualcomm, and Google confirmed the Q4 2026 launch of the Galaxy XR headset at a USD 500-USD 700 range, intensifying mid-tier competition.
- December 2025: Unity linked its engine with AWS Wavelength Zones to offer sub-20 millisecond latency across fifteen U.S. metro areas.
- November 2025: Maharashtra announced INR 3,268 crore (USD 390 million) incentives to attract USD 6 billion private XR investment and 200,000 jobs over twenty-five years.
- October 2025: Roche and NVIDIA scaled photogrammetry twins to eight pharmaceutical plants, cutting validation from six months to eight weeks.


Global Immersive Technologies Market Report Scope
The Immersive Technologies Market refers to the ecosystem of hardware, software, and services that enable users to interact with digitally simulated or enhanced environments in a highly engaging and realistic manner. It includes technologies such as virtual reality (VR), augmented reality (AR), mixed reality (MR), and extended reality (XR), which blend physical and digital experiences. These solutions are used across industries, including gaming, entertainment, healthcare, education, manufacturing, and enterprise training.
The Immersive Technologies Market Report is Segmented by Technology (AR, VR, MR, XR), Component (Hardware, Software, Services), Application (Training and Simulation, Remote Collaboration, Product Design and Prototyping, and More), End-User Industry (Gaming and Entertainment, Healthcare and Life Sciences, and More), and Geography. The Market Forecasts are Provided in Terms of Value (USD).
| Augmented Reality (AR) |
| Virtual Reality (VR) |
| Mixed Reality (MR) |
| Extended Reality (XR) |
| Hardware | Head-Mounted Displays (HMDs) |
| Head-Up Displays (HUDs) | |
| Projectors and Display Walls | |
| Sensors and Tracking Systems | |
| Software | AR/VR Content Creation Platforms |
| Simulation Software | |
| Real-Time Rendering Engines | |
| Services | Integration and Deployment |
| Consulting and Training | |
| Support and Maintenance |
| Training and Simulation |
| Remote Collaboration |
| Product Design and Prototyping |
| Marketing and Advertising |
| Retail Visualization |
| Patient Therapy and Surgical Planning |
| Entertainment and Gaming |
| Other Applications |
| Gaming and Entertainment |
| Healthcare and Life Sciences |
| Education and EdTech |
| Manufacturing and Industrial |
| Retail and E-Commerce |
| Aerospace and Defense |
| Automotive |
| Real Estate and Architecture |
| Other End-User Industries |
| North America | United States | |
| Canada | ||
| Mexico | ||
| South America | Brazil | |
| Argentina | ||
| Rest of South America | ||
| Europe | Germany | |
| United Kingdom | ||
| France | ||
| Italy | ||
| Spain | ||
| Russia | ||
| Rest of Europe | ||
| Asia-Pacific | China | |
| Japan | ||
| South Korea | ||
| India | ||
| Australia | ||
| Rest of Asia-Pacific | ||
| Middle East and Africa | Middle East | Saudi Arabia |
| United Arab Emirates | ||
| Turkey | ||
| Rest of Middle East | ||
| Africa | South Africa | |
| Nigeria | ||
| Rest of Africa | ||
| By Technology | Augmented Reality (AR) | ||
| Virtual Reality (VR) | |||
| Mixed Reality (MR) | |||
| Extended Reality (XR) | |||
| By Component | Hardware | Head-Mounted Displays (HMDs) | |
| Head-Up Displays (HUDs) | |||
| Projectors and Display Walls | |||
| Sensors and Tracking Systems | |||
| Software | AR/VR Content Creation Platforms | ||
| Simulation Software | |||
| Real-Time Rendering Engines | |||
| Services | Integration and Deployment | ||
| Consulting and Training | |||
| Support and Maintenance | |||
| By Application | Training and Simulation | ||
| Remote Collaboration | |||
| Product Design and Prototyping | |||
| Marketing and Advertising | |||
| Retail Visualization | |||
| Patient Therapy and Surgical Planning | |||
| Entertainment and Gaming | |||
| Other Applications | |||
| By End-User Industry | Gaming and Entertainment | ||
| Healthcare and Life Sciences | |||
| Education and EdTech | |||
| Manufacturing and Industrial | |||
| Retail and E-Commerce | |||
| Aerospace and Defense | |||
| Automotive | |||
| Real Estate and Architecture | |||
| Other End-User Industries | |||
| By Geography | North America | United States | |
| Canada | |||
| Mexico | |||
| South America | Brazil | ||
| Argentina | |||
| Rest of South America | |||
| Europe | Germany | ||
| United Kingdom | |||
| France | |||
| Italy | |||
| Spain | |||
| Russia | |||
| Rest of Europe | |||
| Asia-Pacific | China | ||
| Japan | |||
| South Korea | |||
| India | |||
| Australia | |||
| Rest of Asia-Pacific | |||
| Middle East and Africa | Middle East | Saudi Arabia | |
| United Arab Emirates | |||
| Turkey | |||
| Rest of Middle East | |||
| Africa | South Africa | ||
| Nigeria | |||
| Rest of Africa | |||


Key Questions Answered in the Report
How large will the immersive technologies market be by 2031?
Mordor Intelligence projects it will reach USD 190.79 billion by 2031, rising from USD 56.85 billion in 2026.
What is the expected CAGR for immersive technologies between 2026-2031?
The market is forecast to grow at a 27.4% CAGR during the 2026-2031 period according to Mordor Intelligence.
Which component category is growing fastest?
Services are advancing at a 31.8% CAGR as enterprises shift from one-time device purchases to managed contracts.
Which region will see the quickest growth?
Asia-Pacific is projected to post a 32.6% CAGR through 2031, driven by large-scale public investment programs.
What end-user industry shows the highest growth momentum?
Healthcare and life sciences are expanding at a 29.8% CAGR as clinical evidence supports immersive surgical planning.
Who are the leading hardware suppliers today?
Meta Platforms, Microsoft, Apple, Sony and HTC collectively held about 55-60% of hardware revenue in 2025.
Page last updated on:


