
Cognitive Analytics Market Size and Share
Market Overview
| Study Period | 2020 - 2031 |
|---|---|
| Market Size (2026) | USD 10.10 Billion |
| Market Size (2031) | USD 46.16 Billion |
| Growth Rate (2026 - 2031) | 35.52 % |
| Fastest Growing Market | Asia Pacific |
| Largest Market | North America |
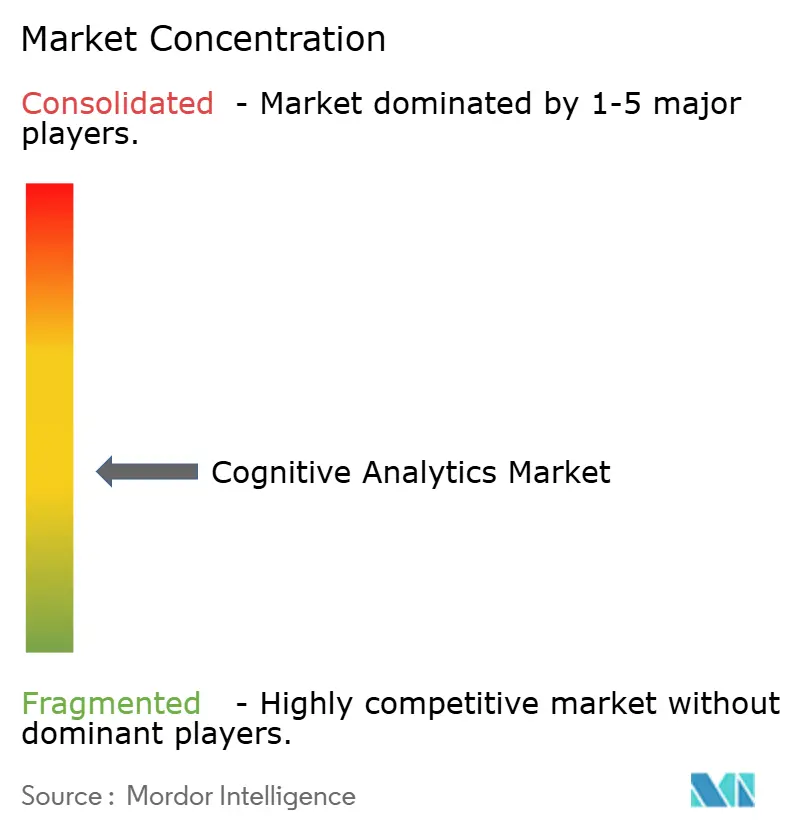
| Market Concentration | Medium |
Major Players *Disclaimer: Major Players sorted in no particular order Image © Mordor Intelligence. Reuse requires attribution under CC BY 4.0. | |
Cognitive Analytics Market Analysis by Mordor Intelligence
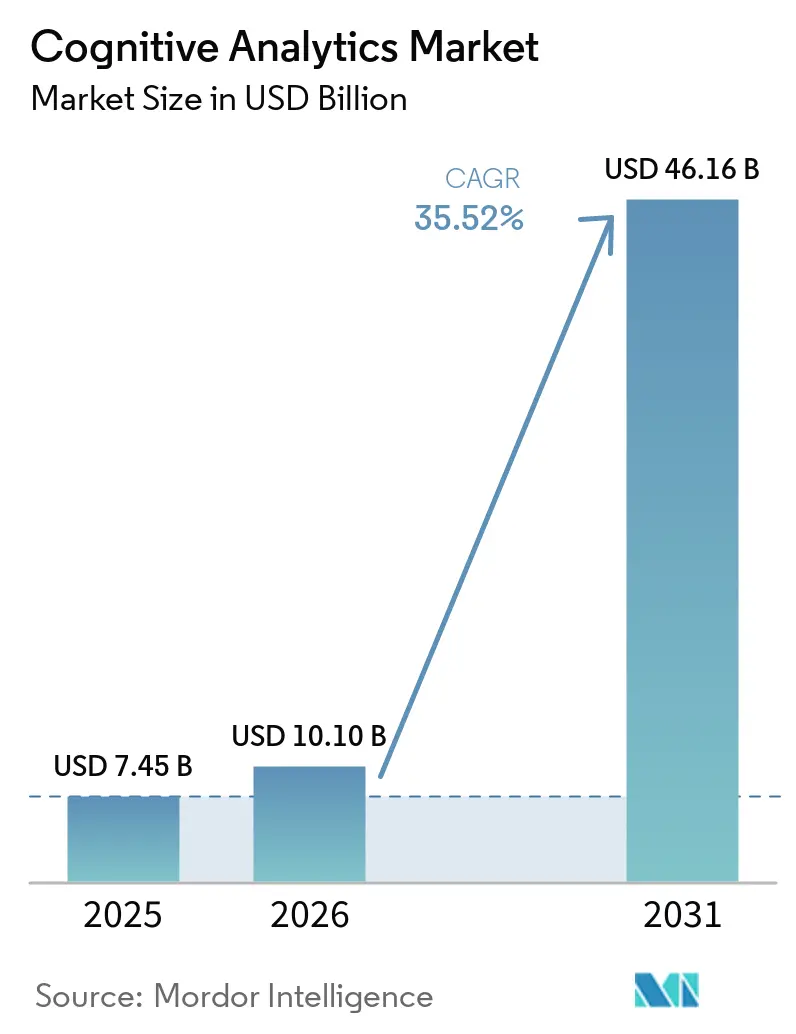
Cognitive Analytics market size in 2026 is estimated at USD 10.1 billion, growing from 2025 value of USD 7.45 billion with 2031 projections showing USD 46.16 billion, growing at 35.52% CAGR over 2026-2031.
The surge draws strength from enterprises acknowledging that 80% of their information assets are unstructured and that traditional BI tools cannot keep pace with this data deluge.[1]IBM Institute for Business Value, “Winning With AI: Pioneers Combine Strategy, Organizational Behavior, and Technology,” ibm.com Lower cloud-infrastructure pricing, enterprises now save up to 80% on data-lake operations, and rapid gains in natural-language processing (NLP) are accelerating adoption, making conversational analytics interfaces a mainstream expectation.[2]DEV Community, “How Lower Cloud Costs Accelerate Enterprise AI Adoption,” dev.to At the same time, compliance pressure from the EU AI Act and the move toward autonomous decisioning elevate governance-ready platforms. North America commands a 46% revenue lead on the back of USD 154 billion in enterprise AI spending, whereas Asia Pacific is expanding fastest at 38.45% CAGR thanks to sovereign-AI programs targeting USD 110 billion by 2026. Cloud/Hosted deployment is the velocity champion at 38.44% CAGR, and Services components are scaling at 37.42% CAGR, underscoring the need for implementation expertise. Technology giants’ USD 300 billion capital outlay on AI infrastructure in 2025 is raising entry barriers even as synthetic-data marketplaces grow 34.8% annually.
Key Report Takeaways
- By deployment, on-premises solutions held 57.20% of the cognitive analytics market share in 2025, while cloud/hosted is forecast to expand at a 37.05% CAGR through 2031.
- By component, tools led with 54.30% revenue share in 2025; services are projected to rise at a 36.02% CAGR to 2031.
- By technology, natural language processing accounted for 39.30% of the cognitive analytics market size in 2025, whereas generative-AI techniques are set to grow at 36.30% CAGR between 2026-2031.
- By end-user industry, BFSI captured 28.40% of the cognitive analytics market size in 2025; healthcare is the fastest-growing industry at 36.15% CAGR to 2031.
- By geography, North America commanded a 45.60% market share in the cognitive analytics market in 2025; the Asia Pacific is advancing at a 37.20% CAGR through 2031.
Note: Market size and forecast figures in this report are generated using Mordor Intelligence’s proprietary estimation framework, updated with the latest available data and insights as of 2026.
Global Cognitive Analytics Market Trends and Insights
Drivers Impact Analysis*
| Driver | (~) % Impact on CAGR Forecast | Geographic Relevance | Impact Timeline |
|---|---|---|---|
| Surge in enterprise adoption of AI-powered solutions | +8.2% | Global, led by North America and Europe | Medium term (2–4 years) |
| Rapid decline in cloud-compute and storage costs | +6.8% | Global, strong effect in Asia-Pacific | Short term (≤ 2 years) |
| Real-time decision-making demand in BFSI and healthcare | +5.4% | North America, Europe, expanding into Asia-Pacific | Medium term (2–4 years) |
| NLP-driven conversational analytics integration | +4.9% | Global, higher use in English-speaking markets | Short term (≤ 2 years) |
| Emergence of autonomous “AI-agent” analytics platforms | +3.7% | North America and Europe first, global later | Long term (≥ 4 years) |
| Synthetic-data marketplaces for model training | +2.8% | Global, compliance-driven uptake | Medium term (2–4 years) |
| Source: Mordor Intelligence | |||
Surge in enterprise adoption of AI-powered solutions
Seventy-two percent of organizations deploy AI in at least one function, signalling a decisive shift from experimentation to scaled roll-outs. Leadership expectations align: 63% foresee noticeable financial impact within two years, and 85% anticipate AI-driven business-model change. Documented returns, 15:1 benefit-cost ratios and 25% revenue uplifts, reinforce further investment. Yet only 21% have redesigned workflows to harness AI, highlighting integration gaps that cognitive analytics platforms must bridge.
Rapid decline in cloud-compute and storage costs
Organizations are slashing data-lake spend by up to 80% using dynamic scaling and spot-instance strategies. The plunge opens the cognitive analytics market to mid-sized enterprises previously priced out of cognitive computing technologies. FinOps engines now auto-optimize spending, turning cost savings into a flywheel for wider analytics deployments.
Real-time decision-making demand in BFSI and healthcare
Sub-second fraud detection and patient-care optimization are mandates. NHS Trust cut missed appointments from 10% to 4%, freeing 700 weekly consultations via AI-driven scheduling. McKinsey pegs generative AI’s upside for banking at USD 200-340 billion in annual profit lift, fuelling urgency for latency-free analytics.
NLP-driven conversational analytics integration
The global conversational-AI market will reach USD 14.29 billion in 2025 and USD 41.39 billion by 2030, growing 23.7% annually. Large language models let non-technical staff query data in plain English, lifting usage rates and broadening the cognitive analytics market.
Restraints Impact Analysis*
| Restraint | (~) % Impact on CAGR Forecast | Geographic Relevance | Impact Timeline |
|---|---|---|---|
| Implementation complexity and skills gap | -4.6% | Global, acute in Asia Pacific and emerging markets | Short term (≤ 2 years) |
| Data-privacy / compliance restrictions | -3.8% | Europe, global spillover | Medium term (2–4 years) |
| Model hallucination and observability risk | -2.9% | Global, high-stakes sectors | Short term (≤ 2 years) |
| Rising carbon footprint of large AI workloads | -1.7% | Europe and North America | Long term (≥ 4 years) |
| Source: Mordor Intelligence | |||
Implementation complexity and skills gap
Eighty percent of IT managers cite talent shortages, and 52% of firms call it the number-one barrier to advanced analytics. Japan alone could face 789,000 vacant software-engineer positions by 2030. No-code workflows, automated model deployment, and vendor-delivered training are becoming essential features.
Data-privacy / compliance restrictions
The EU AI Act adds EUR 29,277 (USD 31,200) in annual compliance cost per AI unit and an industry-wide bill up to USD 3.3 billion.[3]2021.AI, “EU AI Act Compliance Cost Model,” 2021.ai Its extraterritorial reach complicates global roll-outs, steering demand toward governance-ready cognitive platforms.
*Our forecasts treat driver/restraint impacts as directional, not additive. The impact forecasts reflect baseline growth, mix effects, and variable interactions.
Segment Analysis
By Deployment: Cloud momentum outpaces but On-Premise retains scale
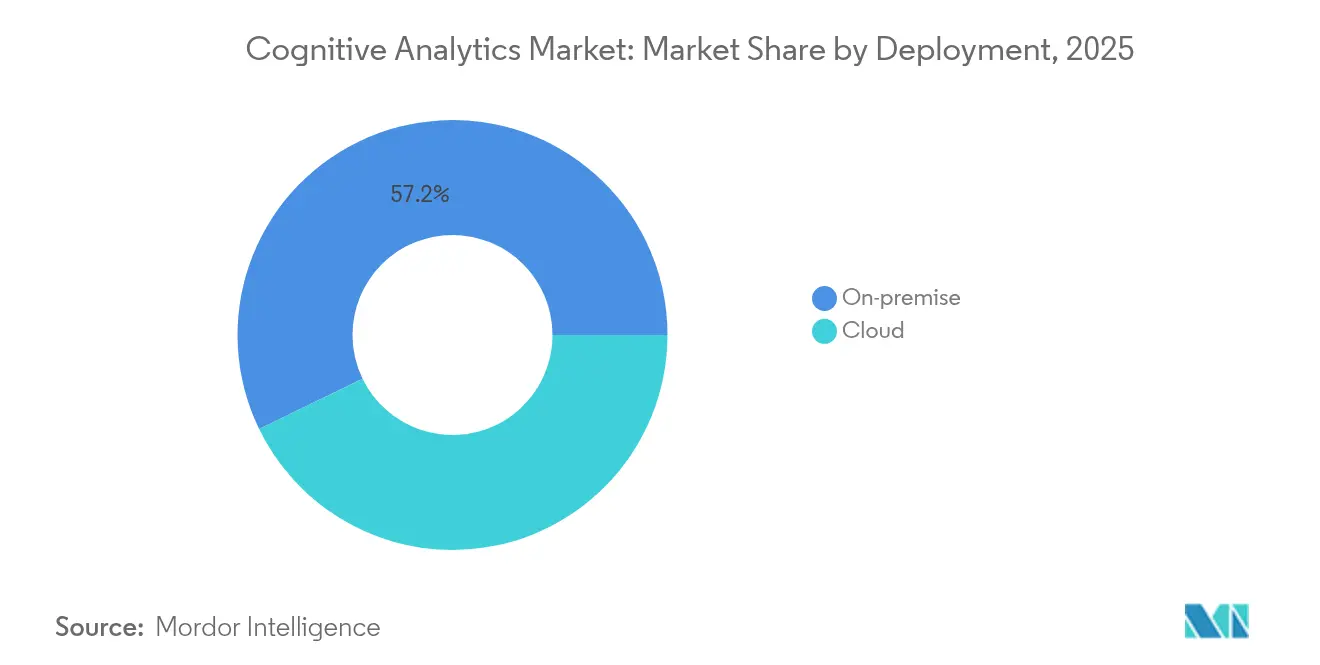
On-Premises architectures controlled 57.20% of the cognitive analytics market share in 2025, driven by data-sovereignty mandates in healthcare and financial services. Cloud/Hosted offerings, however, are forecast to swell at 37.05% CAGR, propelled by 80% infrastructure cost cuts and sovereign-AI programs earmarking USD 110 billion for local clouds in Asia-Pacific. Hybrid set-ups that place sensitive workloads on-site while leveraging cloud analytics engines are proliferating. Microsoft’s USD 80 billion spend on AI-ready data centers underscores the infrastructure race. Regional regulatory differences shape adoption: GDPR pushes Europe toward hybrid models, whereas North American enterprises gravitate to all-cloud estates.
Edge computing enriches these hybrids by processing data locally and forwarding feature sets for model retraining in the cloud, harmonizing latency, compliance, and cost. US defense projects seeking tactical AI insights exemplify use cases demanding both on-device inference and centralized model control. The combined approach is poised to dominate new deployments over the outlook period, solidifying the cognitive analytics market as a blended cloud-edge ecosystem.



By Component Type: Services growth mirrors complexity
Tools captured 54.30% of the cognitive analytics market size in 2025, but Services are expanding at 36.02% CAGR through 2031. Implementation support, training, and managed operations absorb the skills deficit that 80% of IT leaders report. Advisory teams now package change-management and governance consulting to comply with the EU AI Act. Outcome-based contracts, where vendors accept a revenue-share instead of licenses, are gaining appeal, evidenced by Palantir’s recent financial-services deals.
Demand for integration services rises as enterprises mesh cognitive engines with ERP, CRM, and IoT platforms. Vendors respond by launching low-code connectors and pre-built workflow templates. Training services include “train-the-trainer” programs to seed internal expertise, mitigating future dependency on external consultants. Over the forecast, services revenue is set to close the gap with tools as businesses prioritize faster time-to-value.
By Technology Type: Generative AI disrupts analytics fundamentals
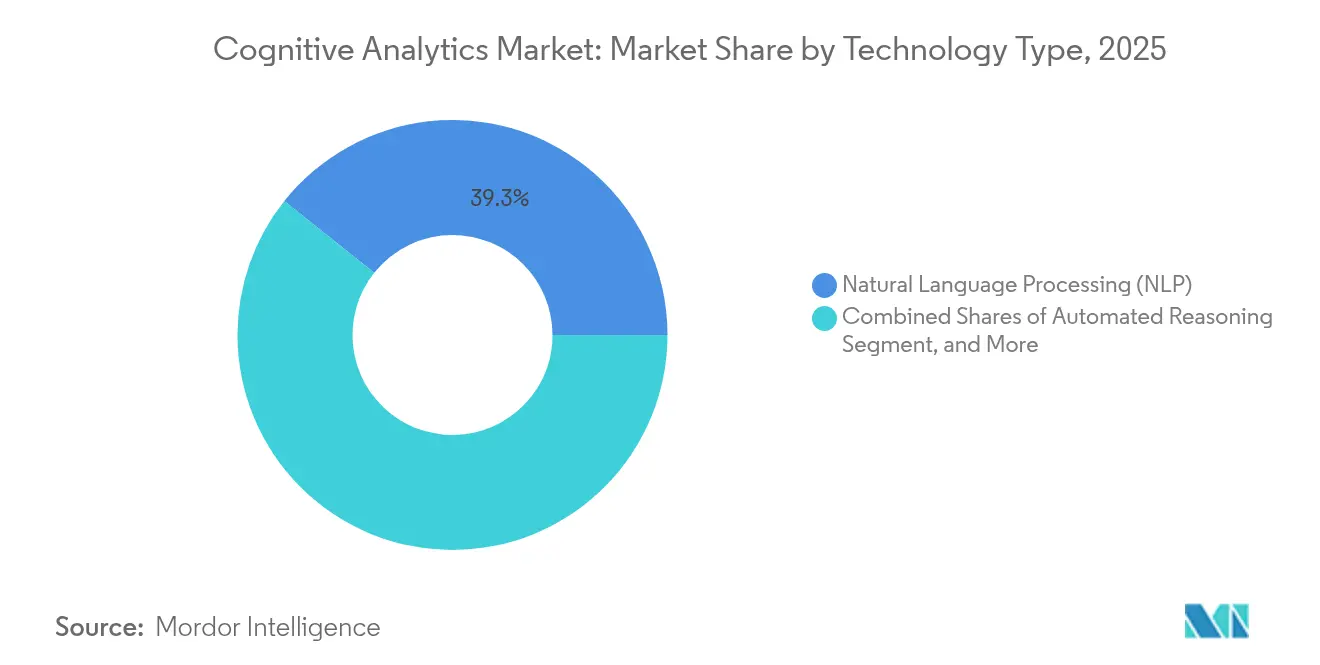
Natural Language Processing held 39.30% share in 2025, underscoring its role as the interface layer for insights delivery. Generative-AI techniques, projected to grow 36.30% annually, are remaking content creation, data augmentation, and scenario simulation. Gartner expects 75% of analytics outputs to embed generative AI by 2027. Synthetic-data generation, a direct offshoot, addresses scarce or sensitive datasets; its market is headed toward USD 6.26 billion by 2033.
Machine and Deep Learning remain foundational for pattern discovery, while Automated Reasoning gains traction for explainable AI, favored by regulators and high-risk industries. Cross-pollination among these technologies enables autonomous AI agents that could automate 70% of office analytical tasks, signaling the next productivity leap within the cognitive analytics market.
By End-user Industry: Healthcare races ahead
BFSI accounted for 28.40% of the cognitive analytics market size in 2025, relying on AI for risk scoring and customer personalization. Healthcare, advancing at 36.15% CAGR, benefits from evidence such as the NHS Trust achieving 700 additional weekly consultations once analytics optimized patient journeys. Manufacturing is moving from pilot to plant-wide predictive-maintenance deployments, while Retail leverages basket-level demand forecasts to cut stock-outs.
Sector-specific regulation shapes feature priorities: banks demand model-risk management, healthcare insists on explainability and HIPAA alignment, manufacturing values real-time edge inference, and the public sector stresses transparency. Vendors increasingly market verticalized solutions with embedded ontologies and pre-trained models to shorten time-to-insight.
Geography Analysis
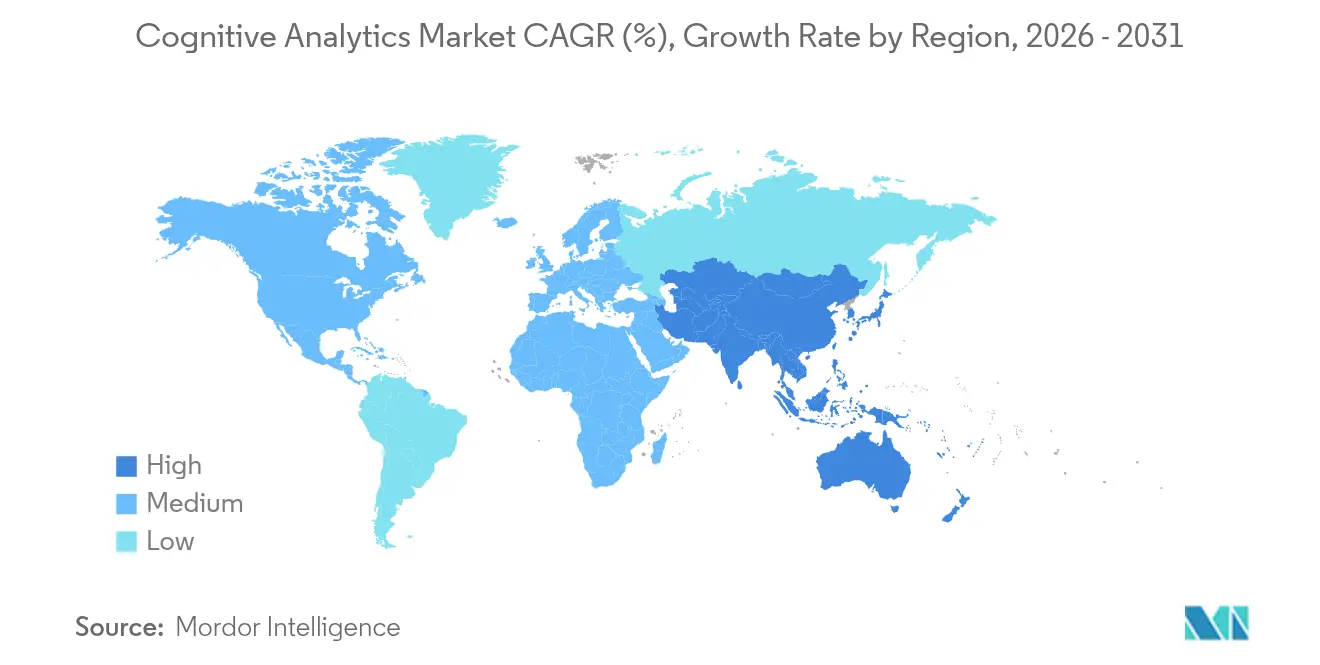
North America held 45.60% of 2025 revenues, anchored by USD 154 billion in enterprise AI spending and technology giants’ USD 300 billion infrastructure commitments. Microsoft’s USD 80 billion investment exemplifies the scale required to maintain latency-free analytics access. Venture funding depth and a regulatory environment that balances innovation with data stewardship have kept adoption steady. Talent shortages remain acute; competitive salaries and reliance on consulting partners typify mitigation strategies, bolstering the services revenue pool.
Asia-Pacific is the growth engine, advancing at 37.20% CAGR as sovereign-AI strategies funnel USD 110 billion toward local compute and algorithm R&D. Japan’s AI market, at USD 4.5 billion in 2024, is set to reach USD 7.3 billion by 2027, while China’s conversational-AI revenues are projected at USD 5.19 billion by 2030. India’s 17.8% CAGR demonstrates widespread digital-transformation agendas. Hyperscaler data-center roll-outs and locally trained large-language models answer linguistic diversity and data-residency rules, widening the regional addressable market.
Europe’s trajectory intertwines with the AI Act. Compliance spending, up to USD 3.3 billion, reshapes budgeting and vendor selection. Governance-built-in solutions gain preference, turning regulation into a moat for capable providers. Market fragmentation arises as member states refine risk categories, demanding modular architectures. Meanwhile, emerging markets in South America and the Middle East and Africa register steady progress, leveraging smart-city and financial-inclusion initiatives though impeded by infrastructure and skills constraints.

Regulatory Landscape
Regulation for cognitive analytics is tightening around AI risk management, transparency, and data governance, with the EU AI Act serving as a key extraterritorial anchor for global deployments. In July 2026, the EU adopted a Digital Omnibus on AI that amended elements of AI Act implementation timing, while certain obligations, including transparency and prohibited-practice requirements, still apply from 2 August 2026. Amended timelines defer parts of the high-risk regime to later dates, including 2 December 2027 for stand-alone high-risk systems and 2 August 2028 for product-embedded high-risk systems such as in medical-device contexts. This sequencing pushes vendors to separate near-term transparency controls from longer-horizon high-risk conformity roadmaps, particularly for regulated end users such as BFSI and healthcare.
Outside the EU, governance is shaped by a patchwork of frameworks and national laws that influence procurement and audit requirements for cognitive analytics platforms. The NIST AI Risk Management Framework (AI RMF) is widely referenced for operational governance, organized around four functions (Govern, Map, Measure, Manage), and it provides a common structure for controls such as model risk documentation and monitoring. At the same time, as of June 2026 around 150 AI-related statutes have been enacted at the US state level, increasing compliance variability for providers selling into multi-state enterprises. South Korea brought its Basic AI Act into force on 22 January 2026, reinforcing the trend toward jurisdiction-specific AI governance obligations that affect model deployment, logging, and assurance practices.
Value Chain Analysis
The cognitive analytics value chain spans data origination and preparation (enterprise data lakes, unstructured content, telemetry), compute and platform layers (cloud/hosted and hybrid cloud-edge infrastructure), foundation-model and tooling providers (NLP and generative AI capabilities), and solution delivery through application vendors and systems integrators. In TMT-heavy use cases, operators and vendors increasingly treat network data and OSS/BSS logs as differentiating inputs for domain-specific models. These deployments require connectors, orchestration, and observability across hybrid environments, while services partners remain central due to implementation complexity and skills gaps that increase demand for configuration, workflow redesign, governance setup, and managed operations.
Recent telecom deployments show the chain shifting toward agentic automation and co-innovation among hyperscalers, network vendors, and operators. In June 2026, Nokia and Google Cloud deployed specialized Gemini-powered agents to automate network operations. In July 2026, Deutsche Telekom moved its OpenAI partnership from pilot to production for network management and internal tools, while AT&T began deploying an agent platform to orchestrate large-scale operational workflows. Across these efforts, common bottlenecks include fragmented customer data, integration across legacy stacks, and hybrid cloud-edge complexity. The pattern also points to sovereign and operator-controlled AI foundry approaches, where sensitive data stays under local governance while partners provide scale.
Competitive Landscape
Capital intensity is rising. Technology majors are injecting over USD 300 billion into AI infrastructure during 2025, crowding smaller entrants yet enlarging the overall cognitive analytics market by democratizing cloud access. Microsoft’s USD 80 billion data-center plan and McKinsey’s acquisition of Iguazio illustrate vertical integration and capability expansion. Outcome-based models shift risk to suppliers; Palantir’s revenue-share deals confirm the trend.
Patent filings show focus on multimodal intent discovery and explainable analysis frameworks. Synthetic-data marketplaces, growing at 34.8% CAGR, open revenue lines for model providers and address data-scarcity, while boosting platform stickiness. Healthcare presents white-space growth; the U.S. military’s USD 500 billion Project Stargate underscores demand for AI-enabled operational medicine, inviting niche players.
Consolidation is evident: Verint acquired four AI firms in 2024, and ChapsVision bought Sinequa to enhance neural search. Strategic investments, such as Accenture’s stake in Aaru, extend consulting reach into consumer-behavior simulation. Competitive differentiation now hinges on governance tooling, autonomous-agent orchestration, and industry-specific pre-configurations rather than raw algorithmic prowess.
Cognitive Analytics Industry Leaders
Google LLC
Oracle Corporation
SAS Institute
IBM Corporation
Microsoft Corporation
- *Disclaimer: Major Players sorted in no particular order

Market Opportunities and Future Outlook
Governance-ready and audit-friendly cognitive analytics is a whitespace area as the EU AI Act timeline evolves and organizations need to operationalize risk controls without stalling deployments. The July 2026 EU Digital Omnibus on AI adjustments, paired with obligations applying from 2 August 2026, increases demand for platforms that embed documentation, monitoring, and traceability by design. It also raises alignment requirements with widely adopted control structures such as the NIST AI RMF (Govern, Map, Measure, Manage). Vendors that package AI governance with implementation services can capture budgets being redirected toward compliance engineering, model observability, and standardized risk workflows.
Telecom and other data-intensive infrastructure industries also offer a high-throughput opportunity for cognitive analytics that extends beyond dashboards into closed-loop operations and agentic automation. Nokia introduced agentic AI capabilities for fixed-network product lines in May 2026, and operators in Asia have publicly committed to large capital programs for AI data centers. In July 2026, KT announced an 18 trillion won (USD 11.73 billion) plan that includes AI data center capacity and submarine cable expansion. These moves widen the addressable footprint for real-time analytics and AI-agent orchestration across distributed edge and cloud environments, creating openings for vendors that can operationalize unstructured telemetry at scale, integrate into OSS/BSS, and support intent-driven automation with controls for latency, reliability, and data residency.
Recent Industry Developments
- July 2026: Deutsche Telekom scaled its partnership with OpenAI from pilot to production, integrating AI into network management as well as internal tools and voice-call related workflows. Moving beyond experimentation, the rollout increases demand for cognitive analytics that can process high-volume, real-time telecom telemetry while meeting operational reliability requirements.
- June 2026: IBM and Google Cloud announced a strategic partnership to create a new Google Cloud Practice aimed at scaling AI with a mix of human expertise and AI-powered delivery. The move strengthens enterprise implementation capacity for cognitive analytics programs that require integration, governance setup, and managed operations across hybrid environments.
- November 2024: ChapsVision acquired Sinequa to deepen capabilities in unstructured-data analytics and neural search. The combination broadens end-to-end offerings for enterprises dealing with large unstructured data estates, a core input to cognitive analytics deployments.


Research Methodology Framework and Report Scope
Market Definition and Coverage
For this study, the cognitive analytics market is defined as software and related services that use AI-driven techniques to interpret data (including text and speech) and generate insights that support business decisions, risk control, and operational improvements.
Scope exclusions: This sizing excludes general IT outsourcing that is not tied to cognitive analytics delivery, and it also excludes pure data storage or basic reporting tools without cognitive capabilities.
Segmentation Overview
- By Deployment
- On-Premises
- Cloud / Hosted
- By Component Type
- Tools
- Services
- By Technology Type
- Natural Language Processing (NLP)
- Machine and Deep Learning
- Automated Reasoning
- Generative-AI Techniques
- By End-user Industry
- BFSI
- Manufacturing
- IT and Telecommunication
- Aerospace and Defense
- Healthcare
- Retail and Consumer Goods
- Government and Public Sector
- By Geography
- North America
- United States
- Canada
- Mexico
- South America
- Brazil
- Argentina
- Rest of South America
- Europe
- United Kingdom
- Germany
- France
- Rest of Europe
- Asia-Pacific
- China
- Japan
- India
- Australia
- South Korea
- Rest of Asia-Pacific
- Middle East and Africa
- Middle East
- Saudi Arabia
- United Arab Emirates
- Rest of Middle East
- Africa
- South Africa
- Nigeria
- Rest of Africa
- Middle East
- North America
Data Sources, Market Sizing, and Validation
Desk Research
To set the foundation, we start by collecting publicly available signals that show how fast analytics and AI adoption is moving across industries. Sources typically reviewed include the US Bureau of Labor Statistics (analytics and data roles), US Census and BEA digital economy releases, OECD ICT indicators, World Bank macro series, and standards and guidance bodies such as NIST for AI risk and governance references.
Next, we use vendor annual reports, SEC filings, investor decks, earnings transcripts, and credible press to understand product positioning and pricing direction (for example, cloud subscription versus on-prem licenses). Patent databases are also checked to spot where cognitive techniques such as NLP and machine learning are being emphasized. In addition, paid subscriptions for company financials and intelligence, news and financials, and patent databases are used selectively to cross-check timelines and scale signals. The desk sources listed here are illustrative, and additional public references were used for data collection, validation, and clarification.
Primary Interviews and Surveys
Primary interviews and structured surveys are used to stress-test assumptions that are difficult to read cleanly from public sources, especially around adoption pace, deal sizing, and how cognitive features are bundled into broader analytics contracts. We typically speak with solution providers, implementation partners, cloud and data consultants, and buyer-side analytics leaders across APAC, EMEA, and the Americas, so regional pricing and demand patterns are not overgeneralized.
Distribution of primary research fieldwork respondents
| Company type | Respondent position | Region |
|---|---|---|
| Top tier: 35% | CXOs: 13% | APAC: 50% |
| Mid tier: 51% | Functional/Unit leaders: 35% | EMEA: 30% |
| Smaller Players: 14% | Managers: 52% | Americas: 20% |
Market-Sizing & Forecasting
Sizing is built using top-down and bottom-up logic, where the demand pool is first reconstructed from enterprise analytics and AI spending patterns and then narrowed using cognitive analytics penetration rates by deployment preference and industry usage. Once the demand pool is shaped, the totals are cross-checked through selective bottom-up approximations such as sampled contract values, channel checks with implementers, and a sanity roll-up of supplier-reported analytics revenue that is directly tied to cognitive workloads.
Key inputs that influence the model include cloud migration intensity for analytics stacks, adoption of NLP and machine learning features in enterprise reporting, average subscription price movement by seat or workload, services-to-software attachment rates for deployments, and the pace of regulated-industry adoption (such as BFSI and healthcare). For forecasting, scenario analysis is used, because growth depends on a few changeable levers such as AI governance readiness, IT budget cycles, and the speed at which pilots convert into scaled rollouts. When bottom-up signals are incomplete for smaller geographies, gaps are handled through ratio-based assumptions anchored to IT spend and validated through expert feedback before totals are finalized.
Data Validation & Update Cycle
Model outputs are checked against independent indicators, and large variances are reviewed until the drivers are clear, which helps avoid growth rates that look attractive but are not explainable. We also run internal peer reviews where assumptions, unit economics, and regional splits are challenged, and then corrected when supporting evidence is weak.
The report is refreshed on an annual cycle, and interim updates are triggered when material events occur, such as major platform pricing shifts or meaningful regulatory changes affecting AI use. Before final delivery, a fresh validation pass is completed so the published numbers reflect the latest available disclosures and market signals.
Mordor Intelligence's Cognitive Analytics Market Size Compared Against Other Published Estimates
Published market numbers for cognitive analytics often vary because the timing and mechanics behind the estimates are not aligned, even when the market name looks identical. Differences usually come from the currency conversion date used for global roll-ups, how subscription price expansion is treated over the forecast, and whether services tied to implementation are counted fully or only partially.
A refresh-led point that drives the gap is how often pricing and deal-mix assumptions are re-checked as cloud contracts evolve, because small changes in ASP progression can compound quickly in a high-growth software market. When exchange rates are applied using a fixed point in time and validation checks are not revisited after major earnings cycles, the model can drift away from what buyers and partners are seeing in the field, which is where Mordor Intelligence keeps the estimate anchored through periodic re-validation and currency timing discipline.
Benchmark comparison
| Source | Market Size | Gaps in Research Methodology |
|---|---|---|
| Mordor Intelligence | USD 10.10 B (2026) | |
| Industry Research Publisher A | USD 6.89 B (2025) | Uses a 2025 base year with a longer horizon, and the scope commonly blends broader enterprise analytics bundles where cognitive features are embedded, which can shift the starting value depending on what is treated as cognitive-only revenue. |
| Industry Research Publisher B | USD 5.16 B (2025) | Reports a 2025 base and may apply more conservative early-stage adoption and pricing ramps, which can lower the base year when cloud subscription expansion and services attachment are not updated frequently. |
Across the three published figures, the main spread is explained by base-year choice, how subscription pricing is stepped forward, and how tightly cognitive-only revenue is separated from broader analytics and AI programs. With clear scope boundaries and repeatable checks tied to adoption and pricing signals, the final market total stays easier to trace and re-create when assumptions are revisited.


Key Questions Answered in the Report
What is the current size of the cognitive analytics market in 2026?
The cognitive analytics market stands at USD 10.1 billion in 2026.
How fast will the cognitive analytics market grow through 2031?
It is forecast to expand at a 35.52% CAGR, reaching USD 46.16 billion by 2031.
Which deployment model is growing the fastest?
Cloud/Hosted deployment is advancing at 37.05% CAGR as organizations capitalize on lower infrastructure costs and scalability.
Which region will register the highest growth rate?
Asia Pacific leads with a projected CAGR of 37.20% through 2031, fuelled by sovereign-AI investments.
Which end-user industry is expected to be the most dynamic?
Healthcare is set to grow at 36.15% CAGR, propelled by proven gains in patient-care optimization.
What is the biggest barrier to broader cognitive analytics adoption?
The primary hurdle is the skills gap—80% of IT managers report shortages in AI talent, driving demand for services and no-code solutions.
Page last updated on:





