Graphic Design Market Size and Share
Market Overview
| Study Period | 2020 - 2031 |
|---|---|
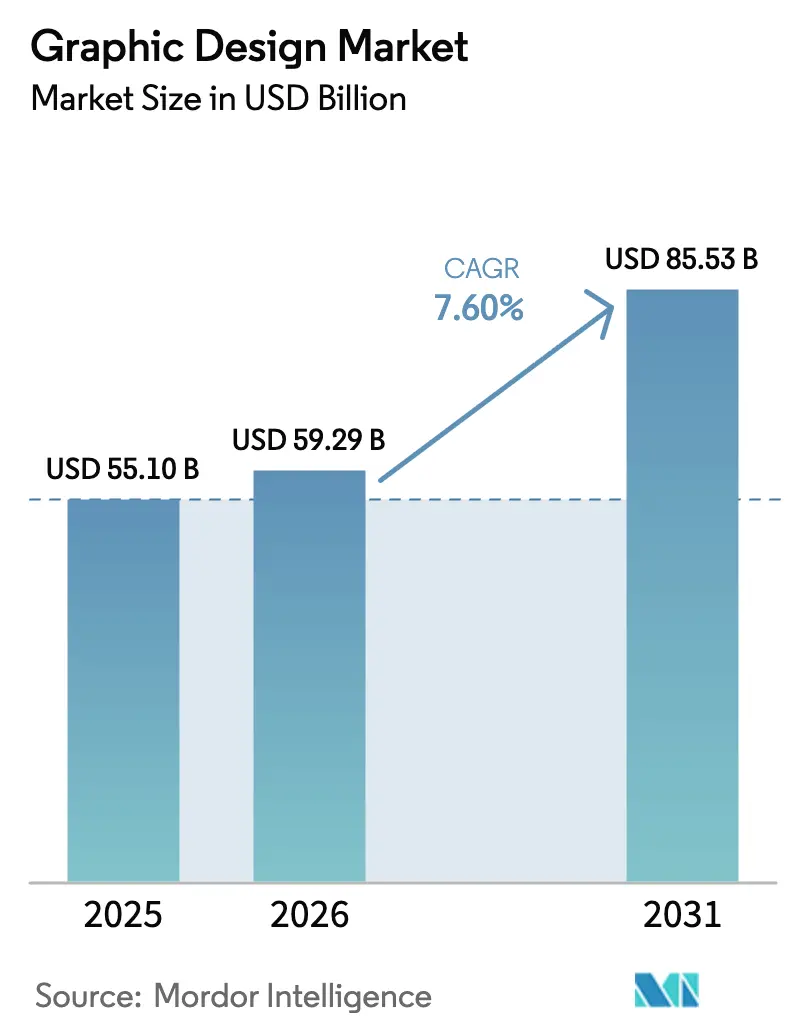
| Market Size (2026) | USD 59.29 Billion |
| Market Size (2031) | USD 85.53 Billion |
| Growth Rate (2026 - 2031) | 7.60% CAGR |
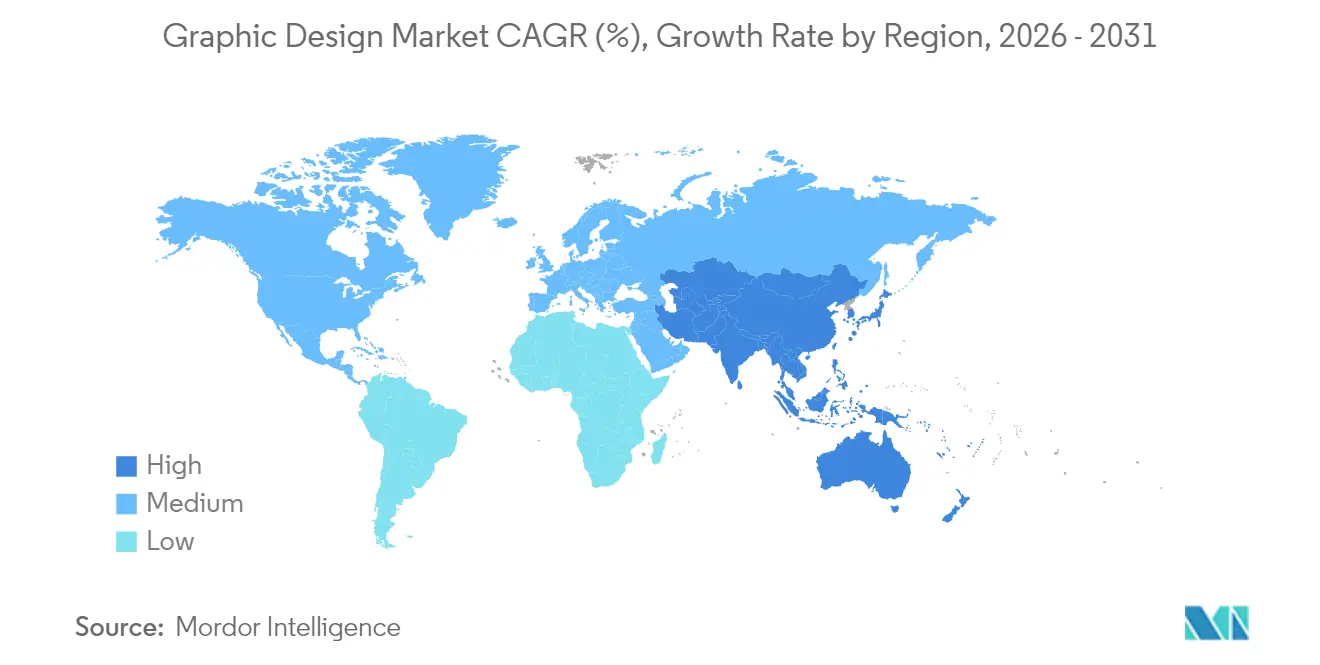
| Fastest Growing Market | Asia Pacific |
| Largest Market | North America |
| Market Concentration | Low |
Major Players*Disclaimer: Major Players sorted in no particular order Image © Mordor Intelligence. Reuse requires attribution under CC BY 4.0. | |
Graphic Design Market Analysis by Mordor Intelligence
graphic design market size in 2026 is estimated at USD 59.29 billion, growing from 2025 value of USD 55.1 billion with 2031 projections showing USD 85.53 billion, growing at 7.60% CAGR over 2026-2031. The current expansion is underpinned by AI-enhanced subscription platforms that shorten design turnarounds while widening access for enterprises and SMEs. Digital content volume continues to climb as brands manage always-on omnichannel campaigns, and the need for a consistent visual identity is intensifying. Generative-AI tools now automate routine production, freeing designers to focus on strategic creativity; Adobe’s Firefly platform alone generated USD 125 million in annualized recurring revenue during 2025. Freelance marketplaces broaden talent reach and keep pricing transparent, while ESG-reporting rules create specialist demand for data-heavy visualization. North America leads regional momentum, yet Asia-Pacific shows the fastest growth as businesses embrace e-commerce and mobile-first marketing.
Key Report Takeaways
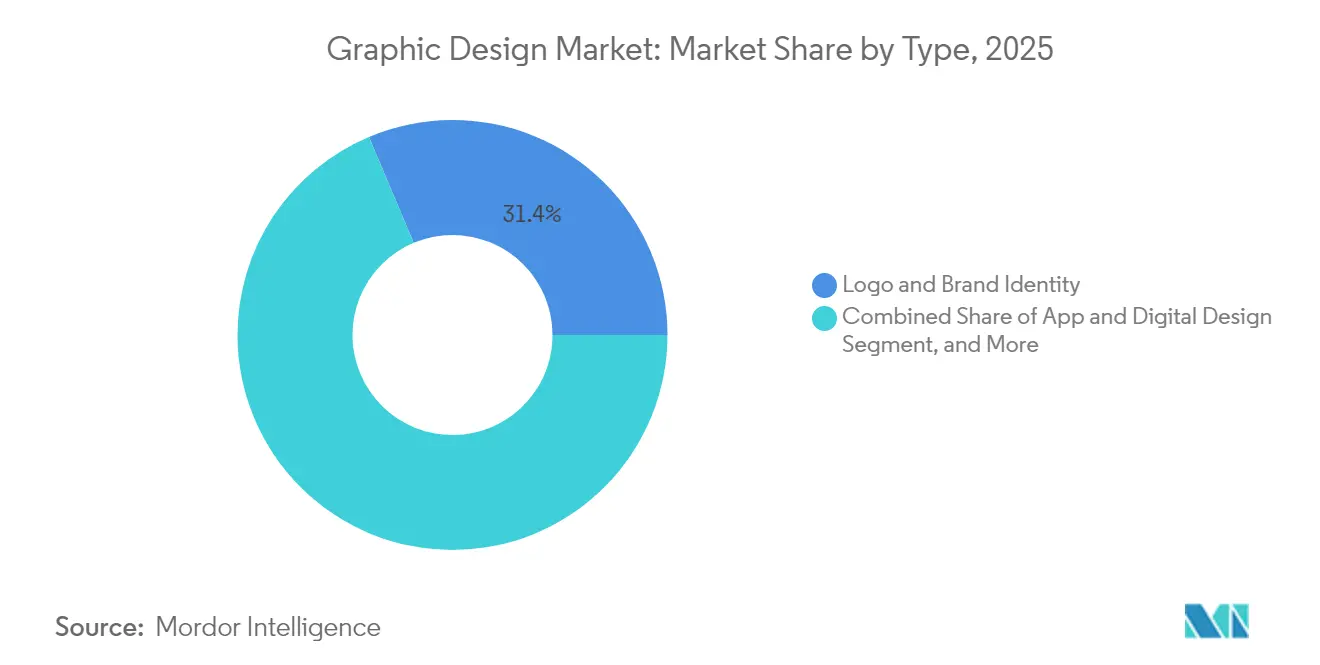
- By service type, logo and brand identity held 31.35% of graphic design market share in 2025, whereas AR/VR and 3D visual design is projected to expand at a 14.30% CAGR through 2031.
- By platform, online design platforms commanded 63.60% share of the graphic design market size in 2025; freelancer marketplaces record the highest projected CAGR at 12.10% to 2031.
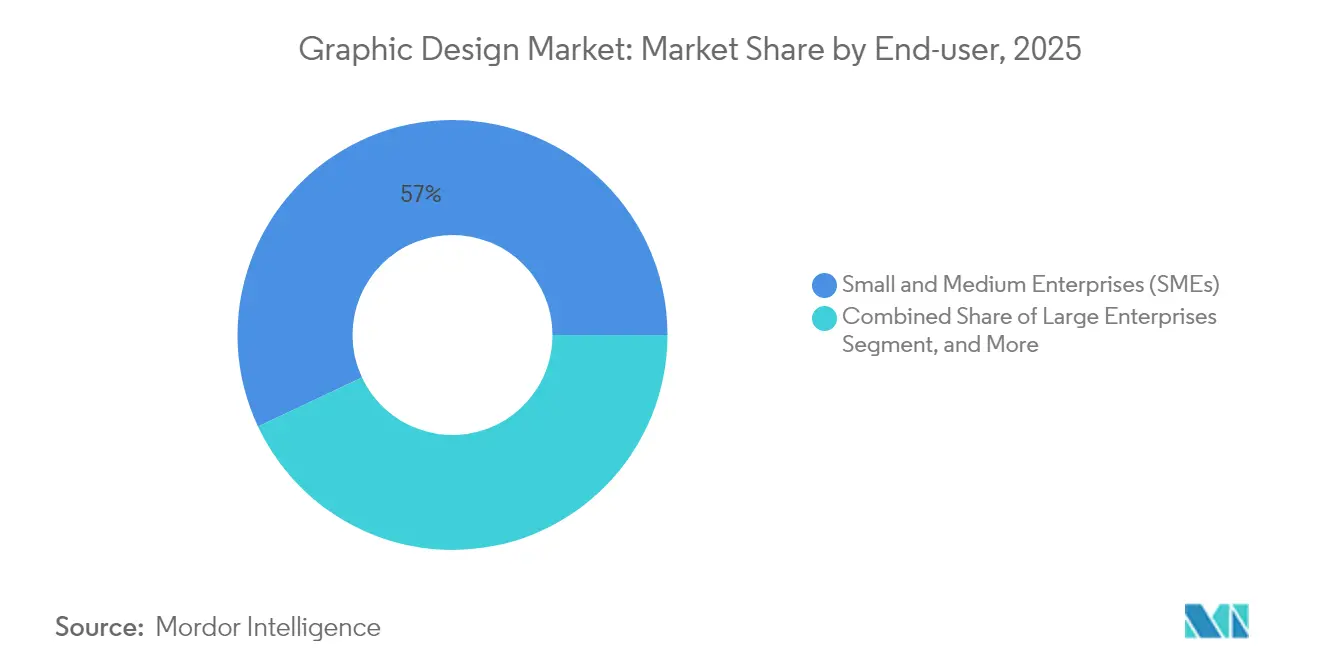
- By end-user, SMEs accounted for 57.00% of graphic design market size in 2025, while large enterprises are advancing at an 10.90% CAGR through 2031.
- By service model, DIY SaaS Tools captured 44.60% share of the graphic design market size in 2025; subscription design services are growing fastest at 13.20% CAGR.
- By geography, North America led with 39.10% graphic design market share in 2025; Asia-Pacific is set to rise at an 11.10% CAGR to 2031.
Note: Market size and forecast figures in this report are generated using Mordor Intelligence’s proprietary estimation framework, updated with the latest available data and insights as of 2026.
Global Graphic Design Market Trends and Insights
Drivers Impact Analysis*
| Driver | (~) % Impact on CAGR Forecast | Geographic Relevance | Impact Timeline |
|---|---|---|---|
| Rising demand for digital content & omnichannel marketing | +2.1% | Global, concentrated in North America & Europe | Medium term (2–4 years) |
| SME e-commerce surge requiring affordable design assets | +1.8% | Global, strong in APAC & Latin America | Short term (≤ 2 years) |
| Global freelance & remote talent pools expand reach | +1.4% | Global, widespread impact | Long term (≥ 4 years) |
| Generative-AI fuels “design-as-subscription” models | +2.3% | North America & Europe first, spreading to APAC | Medium term (2–4 years) |
| ESG-reporting rules spur data-visualisation demand | +0.9% | Europe & North America, emerging in APAC | Long term (≥ 4 years) |
| Source: Mordor Intelligence | |||
Rising Demand for Digital Content & Omnichannel Marketing
Omnichannel marketing now obliges brands to maintain uniform design across social media, websites, apps, and print. Creative Cloud subscriptions climbed to USD 4.23 billion revenue in Q1 2025, underscoring how firms equip teams for continuous, cross-platform creation.[1]Adobe Inc., “Adobe Delivers Record Q1 Results,” news.adobe.com Content personalization further multiplies asset requirements, and agile design systems that preserve brand integrity at scale are therefore prioritized within the graphic design market.
SME E-commerce Surge Requiring Affordable Design Assets
Seventy-two percent of SMEs use data to guide decisions and rely on professional visuals for higher conversion rates.[2]Organisation for Economic Co-operation and Development, “SME Digitalisation to Manage Shocks and Transitions,” oecd.org Unlimited-request subscriptions priced between USD 549 and USD 1,299 per month appeal to cash-conscious owners while feeding steady demand into the graphic design market.
Global Freelance & Remote Talent Pools Expand Reach
Enhanced collaboration tools remove location barriers, letting firms tap niche skills worldwide. Upwork enabled USD 4.1 billion in gross services volume during 2025 and served 812,000 active clients seeking creative work. This borderless labor pool injects both pricing flexibility and richer expertise into the graphic design market.
Generative-AI Fuels “Design-as-Subscription” Models
AI now drafts layouts, adapts formats, and polishes variants within seconds, making fixed-fee unlimited packages commercially viable. Adobe Firefly illustrates the revenue upside, and platforms package human oversight with automated production to deliver rapid turnarounds at scale. Such integration aligns cost certainty for clients with predictable recurring income for providers.
Restraints Impact Analysis*
| Restraint | (~) % Impact on CAGR Forecast | Geographic Relevance | Impact Timeline |
|---|---|---|---|
| Fierce price competition commoditises services | −1.6% | Global, acute in mature markets | Short term (≤ 2 years) |
| IP infringement / plagiarism concerns deter clients | −0.8% | Global, with regulatory focus in North America & Europe | Medium term (2–4 years) |
| AI template saturation erodes perceived value | −1.2% | Global, challenging mid-tier providers | Medium term (2–4 years) |
| Source: Mordor Intelligence | |||
Fierce Price Competition Commoditises Services
Thousands of providers on open marketplaces encourage side-by-side price checks, squeezing margins for mid-level studios. Upwork’s 2024 workforce reduction aimed to cut USD 60 million in costs and sharpen enterprise positioning against this backdrop.
IP Infringement / Plagiarism Concerns Deter Clients
Unclear ownership of AI-generated images worries risk-averse enterprises. Adobe’s Content Credentials initiative attempts to certify provenance, yet legal gray areas still prolong procurement cycles. Hesitant buyers can delay or scale back commitments inside the graphic design market.
*Our forecasts treat driver/restraint impacts as directional, not additive. The impact forecasts reflect baseline growth, mix effects, and variable interactions.
Segment Analysis
By Type: AR/VR Growth Builds on Brand Identity Base
Logo and brand identity dominated the graphic design market size in 2025 at USD 17.27 billion, equal to 31.35% share. Businesses continue refreshing core marks to stay relevant, keeping this segment a revenue anchor. AR/VR & 3D visual design, though smaller, is forecast to rise at 14.30% CAGR as training, retail preview, and experiential commerce need immersive content. These applications require specialist pipelines, letting studios charge premium rates and easing exposure to price wars.
AR/VR’s momentum signals a broader pivot toward mixed-reality engagement. Automotive firms, for example, now render digital twins for remote customer walk-throughs, while real-estate developers stage virtual tours that accelerate purchase decisions. As headset ownership expands, demand will tilt further toward spatial design expertise, feeding sustained growth into the graphic design market.


By Platform: Marketplaces Narrow the Gap with Integrated Suites
Online design platforms posted USD 35.04 billion in revenue and held 63.60% share of the graphic design market in 2025. Their drag-and-drop simplicity plus subscription tiers suit non-designers who seek quick turnaround. Freelancer marketplaces, projected to grow 12.10% CAGR, leverage global talent pricing and varied skill depth. Offline studios now concentrate on complex briefs where real-time workshops and strategic input outweigh speed.
The platform split reflects clear buyer preferences. Self-service users accept template consistency to minimize cost, whereas custom seekers value direct collaboration. Cross-platform bundles that merge automated tooling with human freelancers are emerging as hybrid models designed to keep clients within a single ecosystem, further intensifying competition inside the graphic design market.
By End-user: Public Sector Digital Mandate Lifts Government Spend
SMEs injected USD 31.41 billion into the graphic design market size in 2025 and will stay the core volume contributor because online storefronts depend on persuasive visuals for conversion. Large Enterprises, already saturated, expand more slowly yet commission higher-value engagements such as multi-language brand governance and immersive product demos. Large enterprises, growing at 10.90% CAGR, mobilize budgets to upgrade citizen-facing portals and comply with accessibility standards, leading to fresh procurement pipelines.
Public agencies lean on frameworks like OASIS+ that earmark small-business suppliers, widening opportunity for mid-sized design firms. ESG reporting and open-data mandates drive sophisticated infographics, and successful vendors combine policy literacy with storytelling craft-traits that command premium fees in the graphic design market.
By Service Model: Subscriptions Reshape Revenue Predictability
DIY SaaS Tools accounted for 44.60% of preferences in 2025, reflecting widespread comfort with self-edited templates. Yet Subscription Design Services, climbing at 13.20% CAGR, align with finance departments seeking fixed monthly spends. Unlimited request queues backed by AI deliver two-day turnarounds, and providers maintain margins through automated variant generation. Full-Service Agencies now position themselves as strategic partners, targeting high-impact campaigns that justify bespoke pricing.
Subscription adoption widens as enterprises roll design into operating-expense budgets rather than capex-style project fees. ManyPixels and similar operators refine workflow orchestration, routing basic tasks through AI and reserving human experts for nuanced briefs. That dual-layer model lifts throughput while preserving craft, reinforcing scale economy advantages within the graphic design market.
Geography Analysis
North America contributed USD 21.55 billion, equating to 39.10% of the graphic design market share in 2025. Spending is buoyed by enterprise social advertising volumes and a mature creator economy. Creative Cloud net-new ARR reached USD 504 million in 2024, confirming appetite for premium tool suites. Federal initiatives, such as OASIS+, embed design service categories, ensuring structural demand among public agencies.
Asia-Pacific is forecast to grow at 11.10% CAGR, elevating its contribution to USD 27.19 billion by 2031. China’s live-commerce boom, India’s SaaS expansion, and Southeast Asian mobile retail uptake each intensify the need for multilingual, mobile-optimized creative assets. Cross-border freelancing also funnels APAC talent into Western projects, diversifying incomes while injecting competitive rate pressure that reverberates across the graphic design market.
Europe posts steady gains backed by ESG-reporting directives that legally obligate improved data visualization. The British Council framework exemplifies public-sector willingness to pre-allocate design budgets. Meanwhile, Latin America and the Middle East remain nascent yet attractive: rising internet penetration and SME digitization fuel first-time outsourcing of professional visual tasks, laying the groundwork for future share growth.

Competitive Landscape
The competitive field remains moderately fragmented. Adobe anchors the technology side, integrating Firefly into Creative Cloud and broadening AI-powered content pipelines. The platform accrued USD 125 million in new AI recurring revenue during 2025. Canva emphasizes accessibility through browser-based tools, incrementally adding AI but still relying on a freemium funnel.
Marketplaces like Upwork and Fiverr facilitate direct matching; Upwork reported a 105% surge in net income for Q1 2025 as AI-related job posts rose 25% year-over-year. Subscription specialists such as Design Pickle and ManyPixels compete on service breadth and speed, advertising unlimited tasks delivered within 1-2 days. Traditional agencies (Pentagram, Landor & Fitch) safeguard premium positioning by bundling research, strategy, and high-stakes brand work.
Three strategic clusters are now visible: automation-first platforms, talent marketplaces, and consultative studios. White-space lies in AR/VR design, government accessibility projects, and ESG visualization-areas needing domain fluency and thus less prone to price erosion. Providers that integrate AI responsibly while preserving creative oversight are best placed to capture incremental share in the graphic design market
Graphic Design Industry Leaders
ArtVersion
Max Media Group
Bates Design Inc.
VerdanaBold
Pentagram Inc.
- *Disclaimer: Major Players sorted in no particular order


Recent Industry Developments
- March 2025: Adobe launched an AI-powered Customer Experience Orchestration suite, integrating analytics, targeting, and content creation in a unified workflow.
- March 2025: Adobe also posted record Q1 2025 revenue of USD 5.71 billion; Digital Media contributed USD 4.23 billion, and Firefly reached USD 125 million ARR
- October 2024: Upwork executed a 21% workforce reduction to save USD 60 million annually and sharpen its enterprise focus.
- June 2024: British Council awarded a GBP 1.5–2 million creative design framework covering visual, art direction, and digital assets.


Research Methodology Framework and Report Scope
Market Definitions and Key Coverage
Mordor Intelligence defines the graphic design market as the aggregate spending, expressed in USD, on professional visual-communication services and cloud or desktop tools that enable the creation of logos, marketing collateral, packaging artwork, digital interfaces, and immersive 3D or AR/VR assets. Spend linked only to standalone stock-image licensing or printing hardware is excluded from this view, which spans agencies, freelancers, in-house teams, and subscription design platforms across every major industry.
Scope exclusion: Template-driven DIY design apps that monetize solely through advertising are outside this study's baseline.
Segmentation Overview
- By Type
- Logo and Brand Identity
- App and Digital Design
- Advertising and Marketing Collateral
- Packaging and Label
- Clothing and Merchandise
- Book, Magazine and Editorial
- AR/VR and 3D Visual Design
- By Platform
- Online Design Platforms
- Offline / Studio-based Design
- Freelancer Marketplaces
- By End-user
- Small and Medium Enterprises (SMEs)
- Large Enterprises
- Government and Non-profits
- By Service Model
- DIY SaaS Tools
- Subscription Design Services
- Crowdsourced Marketplaces
- Full-Service Agencies/Studios
- By Geography
- North America
- United States
- Canada
- Mexico
- South America
- Brazil
- Argentina
- Rest of South America
- Europe
- Germany
- United Kingdom
- France
- Italy
- Spain
- Russia
- Rest of Europe
- Asia-Pacific
- China
- Japan
- South Korea
- India
- Australia and New Zealand
- Rest of Asia-Pacific
- Middle East
- Israel
- Saudi Arabia
- United Arab Emirates
- Turkey
- Rest of Middle East
- Africa
- South Africa
- Egypt
- Nigeria
- Rest of Africa
- North America
Detailed Research Methodology and Data Validation
Primary Research
Conversations with senior designers, procurement leads, and SaaS product managers across North America, Europe, and Asia helped us validate average project values, cloud-subscription churn, and regional adoption curves for AI-augmented tools. Follow-up surveys with SMB owners offered clarity on budget reallocation from print to digital assets.
Desk Research
Our analysts began with structured reviews of authoritative data sets such as the U.S. Bureau of Labor Statistics Occupational Outlook, Eurostat's Structural Business Statistics, and UNESCO's creative-economy dashboards, which illuminate employment, wage, and firm counts inside design services. We then pulled trade-flow details from UN Comtrade to quantify outsourced artwork production and examined annual reports filed under NAICS 541430 to map enterprise demand. Paid databases, including D&B Hoovers and Dow Jones Factiva, supplied revenue splits for publicly listed tool vendors and large studios, while Questel patent analytics signaled emerging AI-assisted workflows. Numerous other secondary sources supported cross-checks and contextual color and are not exhaustively listed here.
Market-Sizing & Forecasting
A calibrated top-down model starts with national creative-industry output, employment counts, and average billable rates, which are then adjusted for software-subscription penetration and pass-through costs. Selective bottom-up cross-checks, agency revenue roll-ups and sampled price-per-design transactions align the totals. Key variables include: 1) freelance utilization ratio, 2) SaaS subscription renewal rate, 3) average software seat price, 4) marketing spend as a share of corporate revenue, and 5) regional GDP per-capita growth that influences design outsourcing. Forecasts are generated through multivariate regression layered with scenario analysis to capture AI-driven productivity gains and currency volatility. Data gaps on informal freelancers are bridged with weighted proxies from platform transaction volumes.
Data Validation & Update Cycle
Outputs pass a three-layer review: automated anomaly scans, peer analyst audits, and senior-editor sign-off. We refresh every twelve months, re-contacting sources when material events, large M&A, pricing shifts, or regulatory changes occur, so clients receive the latest view.
Why Mordor's Graphic Design Baseline Commands Reliability
Published figures often diverge because firms pick different service mixes, treat software and services separately, or lock forecasts to static currency assumptions.
Key gap drivers include narrower tool-only scopes, conservative AI-adoption curves, or infrequent data refreshes that miss rapid subscription upticks. Mordor triangulates service and software spend, applies rolling currency averages, and updates annually, yielding a balanced baseline.
Benchmark comparison
| Market Size | Anonymized source | Primary gap driver |
|---|---|---|
| USD 55.1 B (2025) | Mordor Intelligence | - |
| USD 65.3 B (2024) | Global Consultancy A | Excludes freelance gig fees; uses fixed FX rates; five-year refresh cadence |
| USD 43.9 B (2024) | Industry Association B | Omits SaaS subscriptions; relies on enterprise surveys only |
The comparison shows that when software, freelance, and agency spend are integrated and validated through continual source engagement, Mordor's numbers provide decision-makers with the most dependable starting point for strategic planning.


Key Questions Answered in the Report
What is the current value of the graphic design market?
The market stands at USD 59.29 billion in 2026 and is set to grow to USD 85.53 billion by 2031 at an 7.60% CAGR.
Which region leads the graphic design market?
North America leads with 39.10% market share, supported by mature enterprise spending and advanced creative tech adoption.
Why are subscription design services growing so fast?
AI automation permits unlimited-request packages at fixed fees, giving clients budget predictability while ensuring speedy turnaround.
How big is demand from SMEs?
SMEs account for 57.00% of market revenue because online retail success relies heavily on professional visual presentation.
What segment is growing quickest?
AR/VR & 3D Visual Design is expanding at a 14.30% CAGR as immersive experiences move beyond entertainment into training and commerce.
How are ESG rules influencing design needs?
Mandatory sustainability reporting has elevated demand for data-rich visualization so stakeholders can easily interpret complex metrics.
Page last updated on:


