Hong Kong Warehousing Market Size and Share
Market Overview
| Study Period | 2020 - 2031 |
|---|---|
| Forecast Data Period | 2026 - 2031 |
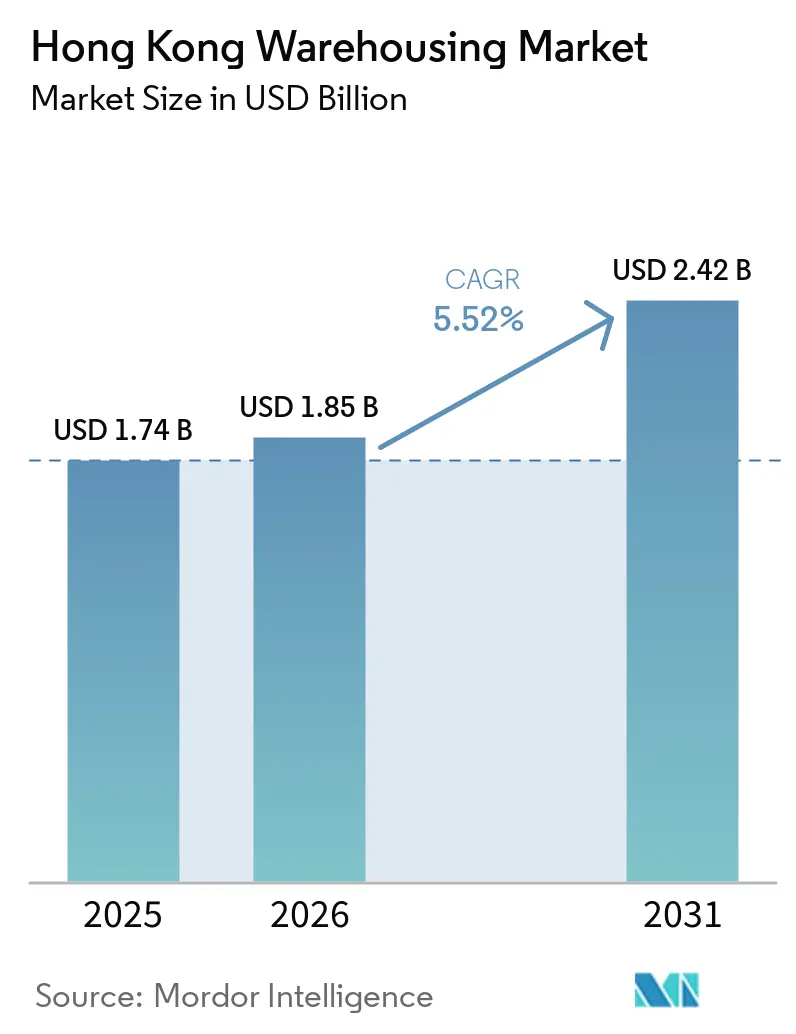
| Base Year Market Size (2025) | USD 1.74 Billion |
| Market Size (2026) | USD 1.85 Billion |
| Market Size (2031) | USD 2.42 Billion |
| Growth Rate (2026 - 2031) | 5.52% CAGR |
| Market Concentration | Low |
Major Players *Disclaimer: Major Players sorted in no particular order Image © Mordor Intelligence. Reuse requires attribution under CC BY 4.0. | |
Hong Kong Warehousing Market Analysis by Mordor Intelligence
The Hong Kong Warehousing Market size is expected to grow from USD 1.74 billion in 2025 to USD 1.85 billion in 2026 and is forecast to reach USD 2.42 billion by 2031 at 5.52% CAGR over 2026-2031. This growth in market size stems from sustained e-commerce penetration, escalating pharmaceutical imports that demand temperature-controlled infrastructure, and cross-border fulfillment routed through the Hong Kong-Zhuhai-Macau Bridge.[1]Census and Statistics Department, “Hong Kong External Merchandise Trade,” censtatd.gov.hk Cold-chain facilities, automated multi-story warehouses, and bonded logistics parks are capturing investment as operators race to meet same-day delivery mandates and tighter drug-safety rules. Scarcity of large land parcels, surging labor costs, and stringent fire codes continue to pressure margins, pushing firms toward robotics and artificial intelligence to raise throughput and lower error rates. Competitive intensity is moderate yet rising, with global logistics real-estate investment trusts and mainland e-commerce platforms accelerating spend on smart facilities while smaller incumbents pivot to niche cold-storage and value-added services.
Key Report Takeaways
- By facility type, refrigerated warehousing led with 37% revenue share in 2025 and is forecast to expand at a 6.57% CAGR to 2031.
- By ownership model, the private segment held 46.50% of the Hong Kong warehousing market share in 2025 and is projected to expand at a 6.49% CAGR through 2031.
- By end-user industry, retail and e-commerce accounted for 29.40% of the Hong Kong warehousing market in 2025 and are advancing at a 5.97% CAGR through 2031.
- By temperature control, cold storage accounted for 54% of the Hong Kong warehousing market in 2025 and is projected to grow at a 6.17% CAGR through 2031.
- By service type, fulfillment and distribution captured 38.70% revenue share in 2025 and is forecast to post the 6.39% CAGR through 2031.
Note: Market size and forecast figures in this report are generated using Mordor Intelligence’s proprietary estimation framework, updated with the latest available data and insights as of January 2026.
Hong Kong Warehousing Market Trends and Insights
Drivers Impact Analysis*
| Driver | (~) % Impact on CAGR Forecast | Geographic Relevance | Impact Timeline |
|---|---|---|---|
| Rise in E-commerce Adoption | +1.8% | Territory-wide, dense in Kowloon and New Territories | Medium term (2-4 years) |
| Expansion of Cross-border E-fulfillment via Hong Kong-Zhuhai-Macau Bridge | +1.2% | New Territories and Lantau Island | Medium term (2-4 years) |
| Surge in Cold Chain Demand from Pharmaceutical Imports | +1.4% | Territory-wide, early gains in Kwai Chung and Chai Wan | Long term (≥ 4 years) |
| Integration of Smart Warehouse Management Systems | +0.9% | Territory-wide, led by New Territories and Lantau Island | Long term (≥ 4 years) |
| Growth of Bonded Logistics in Free Trade Zones | +0.7% | New Territories, Lantau Island | Medium term (2-4 years) |
| Government Incentives for Autonomous Mobile Robots Deployment | +0.6% | Territory-wide, concentrated in facilities above 100,000 sq ft | Short term (≤ 2 years) |
| Source: Mordor Intelligence | |||
Rise In E-commerce Adoption
E-commerce participation touched 18.3% of retail sales in 2025 and continues to lift demand for urban micro-fulfillment sites under 20,000 square feet that sit within five kilometers of dense consumption clusters. Mainland operators such as Cainiao and JD Logistics installed 12 cross-border hubs that each handle over 50,000 daily parcels, most with refrigerated zones for fresh groceries and pharmaceuticals. Two-hour order-to-dispatch windows are now routine, pushing retailers to split inventories across multiple nodes and pay premium rents in exchange for a 30-40% cut in last-mile transport costs. Autonomous mobile robots deployed in these hubs trim labor counts by more than one-third while sustaining 99%-plus picking accuracy. Online grocery orders rose 22% year-over-year in 2025, forcing ambient facilities to carve out chilled zones to meet Food Safety Center temperature mandates.[2]Customs and Excise Department, “Hong Kong Trade Statistics,” customs.gov.hk
Expansion Of Cross-border E-fulfillment Via Hong Kong-Zhuhai-Macau Bridge
Daily truck runs across the 55-kilometer span jumped 28% in 2024, slashing transit times from four hours to under 45 minutes and prompting operators to enlarge bonded capacity in Tuen Mun and Yuen Long. Customs data show HKD 42 billion (USD 5.38 billion) worth of bonded goods passed through Hong Kong in 2024, most routed to Guangdong manufacturing clusters. Reverse-logistics volumes are also climbing as e-commerce returns funnel back to Hong Kong for inspection and relabeling, a service earning margin premiums above 25%.
Surge In Cold Chain Demand From Pharmaceutical Imports
Pharmaceutical imports hit USD 8.2 billion in 2024, with biologics representing 42% of that total. Department of Health Good Distribution Practice rules oblige real-time temperature logging and backup power in 2-8°C zones, disqualifying roughly 70% of ambient stock. Zuellig Pharma’s three licensed sites recorded full occupancy through 2025 and a new 40,000 square-foot Tuen Mun extension will add minus 80°C chambers for mRNA vaccines. IoT sensors paired with blockchain audit trails are now common as global drug firms demand end-to-end provenance.
Integration Of Smart Warehouse Management Systems
Artificial-intelligence-enabled WMS platforms covered 22% of territorial floor space in 2025, double the 2023 level. Government subsidies defray up to half of system costs, luring 87 sites, mostly multi-story New Territories facilities, onto autonomous robot and computer-vision sortation. SF Express reports 99.5% routing precision at its 500,000 square-foot hub after deploying 200 robots. Still, sites under 50,000 square feet struggle with the HKD 5 million (USD 640,000) minimum spend, widening the technology gap between large and mid-tier players.
Restraints Impact Analysis*
| Restraint | (~) % Impact on CAGR Forecast | Geographic Relevance | Impact Timeline |
|---|---|---|---|
| Acute Shortage of Large Land Parcels | -1.1% | Territory-wide, most acute in Hong Kong Island and Kowloon | Long term (≥ 4 years) |
| Rising Real Estate Costs in Urban Districts | -0.9% | Hong Kong Island and Kowloon, emerging in New Territories | Medium term (2-4 years) |
| Shortage of Skilled Labor | -0.6% | Territory-wide | Medium term (2-4 years) |
| Stringent Fire Safety Codes for High-Bay Facilities | -0.4% | Territory-wide, sites above 18 meters | Short term (≤ 2 years) |
| Source: Mordor Intelligence | |||
Acute Shortage Of Large Land Parcels
Industrial land shrank to 1,420 hectares in 2025 as rezoning for housing intensified, cutting supply of 50,000-square-foot lots needed for multi-story automated facilities. Kwai Chung’s inventory dropped 18% from 2023 to 2025, pushing bids in Tuen Mun and Yuen Long past HKD 8,500 per square foot (USD 1,090) at recent auctions.[3]Lands Department, “Government Land Sale Results,” landsales.gov.hk Longer build cycles, now 28-36 months, drive operators to retrofit obsolete factories, though most lack the ceiling height and floor loading for dense racking or AS-RS installations.
Rising Real Estate Costs In Urban Districts
Kowloon rents averaged HKD 18 per square foot monthly (USD 2.31) in 2025, a 22% premium to the New Territories yet five to ten percent below 2024 levels as automation-ready space became the defining preference. Hong Kong Island leads at HKD 24 (USD 3.08) but vacancy reached 12% as tenants decamped to lower-cost, tech-enabled sites. High values, HKD 6,800 per square foot (USD 872) in 2025, compress yields to 3.2%, discouraging speculative builds and nudging global firms toward cross-border warehouse-sharing in Shenzhen where rates are 75% cheaper.
*Our forecasts treat driver/restraint impacts as directional, not additive. The impact forecasts reflect baseline growth, mix effects, and variable interactions.
Segment Analysis
By Facility Type: Cold-Chain Infrastructure Propels Expansion
Refrigerated space captured 37% of 2025 revenue and is on track to post a 6.57% CAGR to 2031, far outpacing ambient facilities that grow around 4%. The Hong Kong warehousing market share advantage is rooted in vaccine stockpiling and fresh-food e-grocery, both of which require 2-8 °C handling. General warehouses still hold the largest absolute footprint but face commoditization as tenants favor specialized units packing IoT probes and backup chillers. Strict Dangerous Goods Ordinance rules confine hazardous storage to estates in Tsing Yi and Tuen Mun, kneecapping growth but keeping margins high.
Cold-chain operators such as China Resources Logistics and Chevalier reported full occupancy in 2025, with expansions adding 60,000 square feet of minus 20 °C and below capacity. The Department of Health’s 2024 GDP update has disqualified 70% of ambient stock, accelerating bifurcation between licensed specialists and lagging godowns. General warehousing’s older stock struggles under sub-10-meter ceilings while farm-product storage remains niche, tied to Guangdong produce inflows.


By Ownership Model: Private Control Supports Automation
Private warehouses held 46.50% revenue in 2025 and should record a 6.49% CAGR to 2031 as multinational retailers and pharmaceutical firms lock in capacity and embed proprietary WMS. Public sites that offer flexible leases grow more slowly at 4.8% because they cannot tailor robotics roadmaps or data segregation. Bonded warehouses are expanding at 8.3% on the back of deferred-duty flows through the bridge link.
Large operators such as SF Express and JD Logistics each injected over USD 100 million into New Territories private hubs outfitted with more than 200 robots, underlining how automation dictates site selection. Hong Kong warehousing market size pressures favor players willing to shoulder HKD 800 million (USD 103 million) outlays for chilled blockchain-enabled sites. Public stock in Kowloon suffers rent contractions of five to ten percent as tenants flock to smarter premises.
By End-user Industry: Retail and E-commerce Drive Volume
Retail and e-commerce already command 29.40% revenue and will grow at a 5.97% CAGR through 2031, the steepest among user groups. Same-day delivery clauses force inventory to be split across micro-fulfillment outposts, particularly near dense Kowloon precincts. The shift toward micro-fulfillment centers, typically 10,000 to 20,000 square feet, is fragmenting warehouse footprints and driving demand for urban locations within 5 kilometers of consumption clusters, where rental premiums reach HKD 24 per square foot per month (USD 3.08) yet reduce last-mile transport costs by 30 to 40 percent.
Retail and e-commerce already command 29.40% revenue and will grow at a 5.97% CAGR through 2031, the steepest among user groups. Same-day delivery clauses force inventory to be split across micro-fulfillment outposts, particularly near dense Kowloon precincts. The shift toward micro-fulfillment centers, typically 10,000 to 20,000 square feet,is fragmenting warehouse footprints and driving demand for urban locations within 5 kilometers of consumption clusters, where rental premiums reach HKD 24 per square foot per month (USD 3.08) yet reduce last-mile transport costs by 30 to 40 percent.
By Temperature Control: Cold Storage Becomes Majority Capacity
Cold storage holds 54% of 2025 revenue and is set for a 6.17% CAGR through 2031. Ambient capacity remains material at 38% but grows below 4% as older godowns fall short on ceiling height and floor strength. Controlled humidity racks up 8% share, catering to electronics and luxury goods needing 40-60% relative humidity.
The Hong Kong warehousing market size advantage of cold chain rests on biologics imports, ultra-low-temperature vaccine programs, and IoT-linked provenance audits. Ambient facilities modernize slowly, accumulating vacancy when tenants migrate to taller, automation-ready blocks.
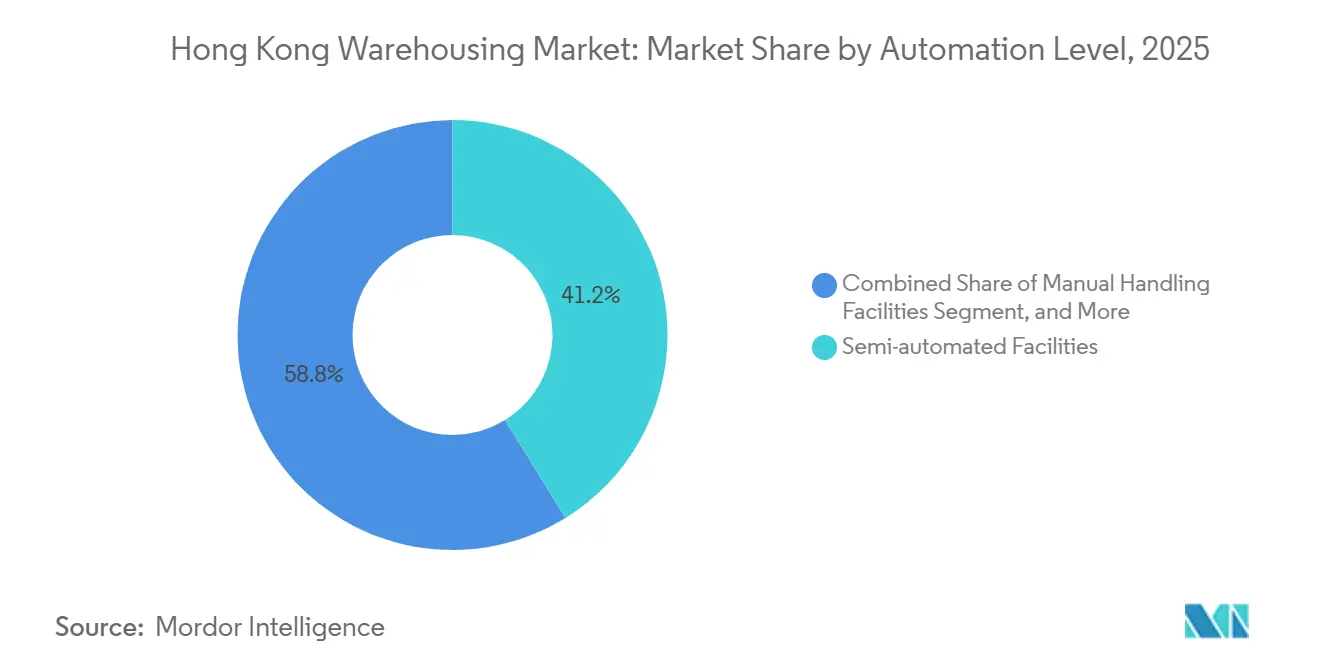
By Automation Level: Fully Automated Sites Outpace Semi-Automated Stock
Semi-automated facilities embody 41.20% of the installed base in 2025 yet fully automated nodes are expanding at a 6.23% CAGR, marking the fastest trajectory among automation levels in the Hong Kong warehousing market. Manual handling lingers on 35% share with sub-3% growth, largely within wine vaults and precious-metal vaults that value human verification.
Capital hurdles keep small players from adopting HKD 5-12 million (USD 640,000-1.54 million) robot packages, even as government funds offset half the outlay for qualifying footprints above 100,000 square feet. The widening tech chasm tilts share toward listed REITs and mainland e-commerce giants.
By Service Type: Fulfillment And Distribution Lead Value Creation
Fulfillment and distribution account for 38.70% of revenue and will accelerate at a 6.39% CAGR through 2031 as brand owners demand kitting, customs brokerage, and returns processing in one facility. Storage-only contracts rise by under 4% due to commoditization, while value-added services also expand strongly, particularly in quality inspection for Guangdong-made exports.
JD Logistics’ eight hubs illustrate the pivot, offering same-day kitting and rework for electronics and cosmetics. Reverse logistics, often 15-20% of parcel flows, enjoys 30%-plus margins, cementing its place in the Hong Kong warehousing market.
Geography Analysis
By District: New Territories Benefits From Bridge Access
New Territories currently delivers the largest slice of the Hong Kong warehousing market and retain momentum thanks to cheaper rent, multi-story land banks, and rapid bridge access into Guangdong. Bonded capacity climbed by 180,000 square feet in 2025, while SF Express launched a 500,000-square-foot robotized hub posting 99.5% order accuracy.
Kowloon remains a key node for last-mile delivery yet struggles with aging stock. Prime areas such as Kowloon Bay witnessed five to ten percent rent cuts in 2025 after tenants decamped for tech-ready blocks in Yuen Long. Twelve new Cainiao and JD sorting hubs keep parcel density high, but most inherited buildings lack 10-meter clear heights.
Hong Kong Island faces land scarcity as warehouse acreage converts to housing. Chilled operators enjoy tight occupancy yet pay the highest rents at HKD 24 per square foot monthly. Lantau Island benefits from airport cargo expansions that will take handling to 1 million tonnes by 2028, encouraging adjacent bonded parks that cater to time-critical drugs and electronics.
Competitive Landscape
The five largest operators, ESR, Goodman, Link REIT, Kerry Logistics, and SF Express, control roughly 38% of the Hong Kong warehousing market, keeping the field moderately fragmented. Land auctions in 2025 fetched record HKD 8,500 per square foot as bidders fought for scalable plots in Tuen Mun and Yuen Long, signaling intensifying competition. ESR’s USD 800 million bet on data-center-linked warehouses underscores a push toward AI-enabled storage.
Mainland entrants pose fresh pressure: Cainiao and JD Logistics use proprietary WMS and blockchain customs clearance to bypass traditional 3PLs, processing 50,000 daily parcels per site. Smaller incumbents must modernize or risk margin erosion as Kowloon rents soften. White-space niches remain in minus 80 °C vaccine storage and hazardous-goods sites governed by Cap 295 rules.
Hong Kong Warehousing Industry Leaders
Kerry Logistics Network Limited
Goodman Hong Kong Logistics Partnership
ESR Cayman Limited
Dragon Crown Group Holdings Limited
Sun Wah Cold Storage Limited
- *Disclaimer: Major Players sorted in no particular order


Recent Industry Developments
- December 2025: ESR Cayman Limited acquired a 280,000 square-foot Tsuen Wan facility for USD 220 million to anchor new Greater Bay Area fulfillment services.
- May 2025: SF Express completed a HKD 950 million (USD 122 million) extension of its Tuen Mun hub, adding 150,000 square feet and 80 robots.
- October 2023: Kerry Logistics opened a 300,000 square-foot ultra-low-temperature cold store in Tuen Mun, costing HKD 800 million (USD 103 million).
- September 2025: Goodman secured a 50-year Yuen Long lease for a 400,000 square-foot bonded park scheduled to open in Q4 2027.
- August 2025: Link REIT sold two aging Kwai Chung warehouses for HKD 420 million (USD 54 million) to redeploy capital into automation-ready stock.


Hong Kong Warehousing Market Report Scope
The Hong Kong Warehousing Market Report is Segmented by Facility Type (General, Refrigerated, Farm Product, Hazardous Goods, Bonded), Ownership Model (Private, Public, Bonded), End-user Industry (Manufacturing, Consumer Goods, Food and Beverage, Retail and E-commerce, Healthcare and Pharmaceuticals, Other), Temperature Control (Ambient, Cold, Controlled Humidity), Automation Level (Manual, Semi-automated, Fully Automated), Service Type (Storage Only, Fulfillment and Distribution, Value-added Services), and Geography. The Market Forecasts are Provided in Terms of Value (USD).
| General Warehousing |
| Refrigerated Warehousing |
| Farm Product Warehousing |
| Hazardous Goods Warehousing |
| Bonded Warehousing |
| Private Warehouses |
| Public Warehouses |
| Bonded Warehouses |
| Manufacturing |
| Consumer Goods |
| Food and Beverage |
| Retail and E-commerce |
| Healthcare and Pharmaceuticals |
| Other End-user Industries |
| Ambient Storage |
| Cold Storage |
| Controlled Humidity Storage |
| Manual Handling Facilities |
| Semi-automated Facilities |
| Fully Automated Facilities |
| Storage Only |
| Fulfilment and Distribution Services |
| Value-added Services (Kitting, Labelling, etc.) |
| By Facility Type | General Warehousing |
| Refrigerated Warehousing | |
| Farm Product Warehousing | |
| Hazardous Goods Warehousing | |
| Bonded Warehousing | |
| By Ownership Model | Private Warehouses |
| Public Warehouses | |
| Bonded Warehouses | |
| By End-user Industry | Manufacturing |
| Consumer Goods | |
| Food and Beverage | |
| Retail and E-commerce | |
| Healthcare and Pharmaceuticals | |
| Other End-user Industries | |
| By Temperature Control | Ambient Storage |
| Cold Storage | |
| Controlled Humidity Storage | |
| By Automation Level | Manual Handling Facilities |
| Semi-automated Facilities | |
| Fully Automated Facilities | |
| By Service Type | Storage Only |
| Fulfilment and Distribution Services | |
| Value-added Services (Kitting, Labelling, etc.) |


Key Questions Answered in the Report
How large is the Hong Kong warehousing and storage market in 2026?
The market is valued at roughly USD 1.85 billion in 2026, continuing a 5.52% CAGR toward USD 2.42 billion by 2031.
Which segment is growing the fastest?
Fulfillment and distribution services are expanding at 6.39% CAGR as brands demand end-to-end kitting, labeling, and returns processing.
Why is cold storage receiving so much investment?
Pharmaceutical imports and online grocery sales require 2-8°C or lower environments, pushing cold storage to a 6.17% CAGR and 54% revenue share in 2025.
What role does the Hong Kong-Zhuhai-Macau Bridge play?
The bridge cuts transit to Guangdong under 45 minutes, boosting bonded warehousing in the New Territories and enabling same-day cross-border delivery.
How automated are Hong Kong’s warehouses?
Fully automated sites represent a growing minority but post a 6.23% CAGR, driven by robotics that lift accuracy above 99% and cut labor 30-40%.
Which districts offer the best growth prospects?
New Territories lead with a 6.29% CAGR thanks to larger land parcels and proximity to both the container port and the bridge landing.
Page last updated on:


