Home Shopping Market Size and Share
Market Overview
| Study Period | 2021 - 2031 |
|---|---|
| Market Size (2026) | USD 7.41 Trillion |
| Market Size (2031) | USD 13.08 Trillion |
| Growth Rate (2026 - 2031) | 12.05% CAGR |
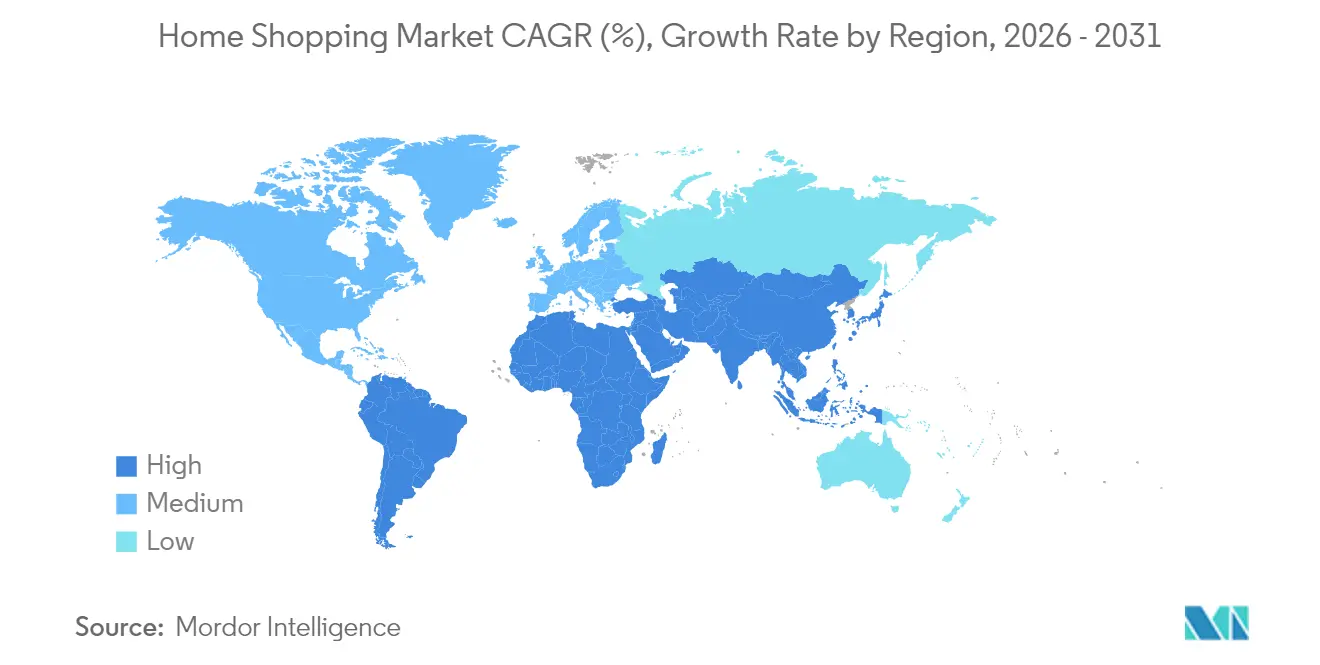
| Fastest Growing Market | Middle East and Africa |
| Largest Market | Asia-Pacific |
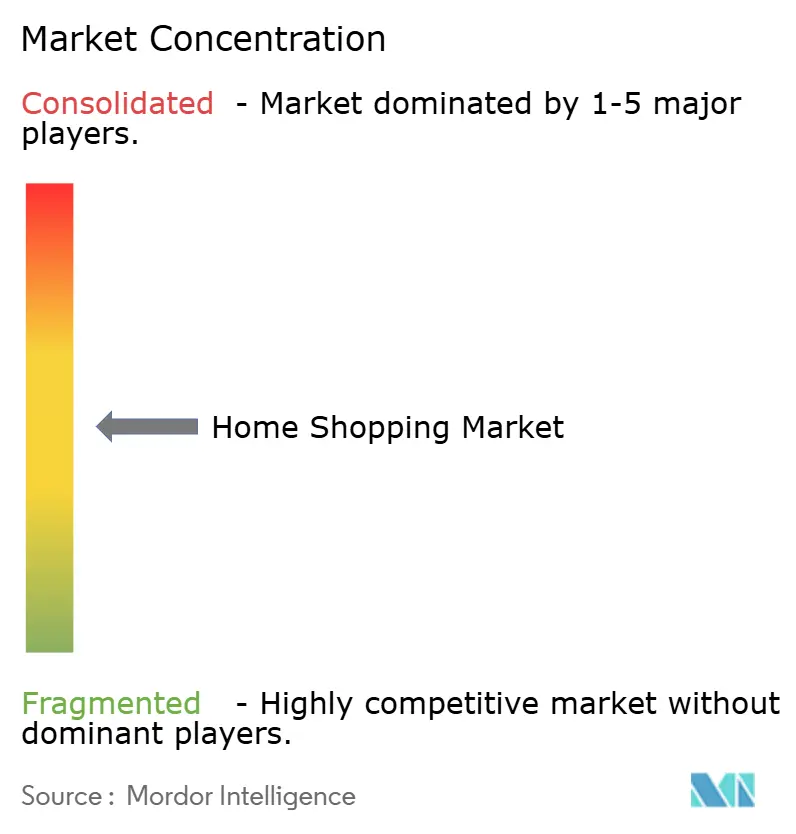
| Market Concentration | Medium |
Major Players
*Disclaimer: Major Players sorted in no particular order Image © Mordor Intelligence. Reuse requires attribution under CC BY 4.0. |
|
Home Shopping Market Analysis by Mordor Intelligence
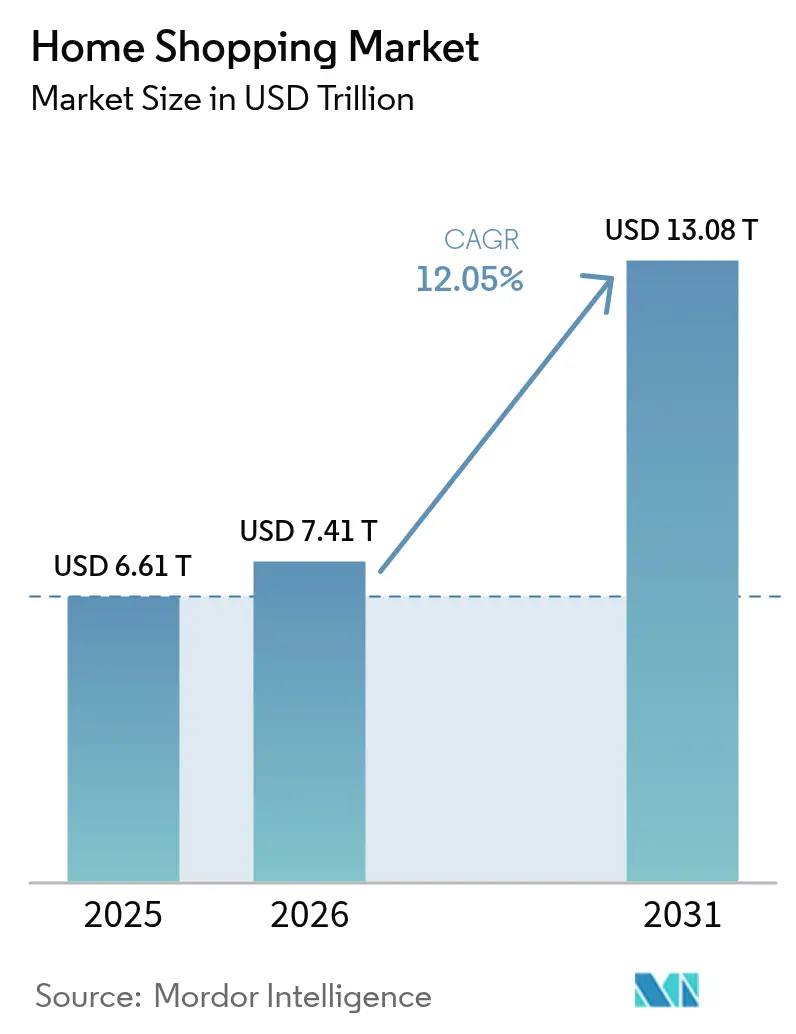
The home shopping market size is expected to grow from USD 6.61 trillion in 2025 to USD 7.41 trillion in 2026 and is forecast to reach USD 13.08 trillion by 2031 at 12.05% CAGR over 2026-2031. This growth reflects the rapid development of digital-first retail ecosystems globally. Key drivers include the increasing adoption of e-commerce and mobile shopping platforms, advancements in digital payment systems, and the growing impact of social media-driven commerce. Consumers are increasingly attracted to the convenience, variety, and personalized experiences provided by home shopping channels. Additionally, subscription-based delivery services and advancements in logistics are fostering repeat purchases and enhancing customer loyalty. The market is also shifting toward omnichannel integration, retail media monetization, and data-driven personalization, enabling retailers to improve customer engagement and explore new revenue opportunities.
Key Report Takeaways
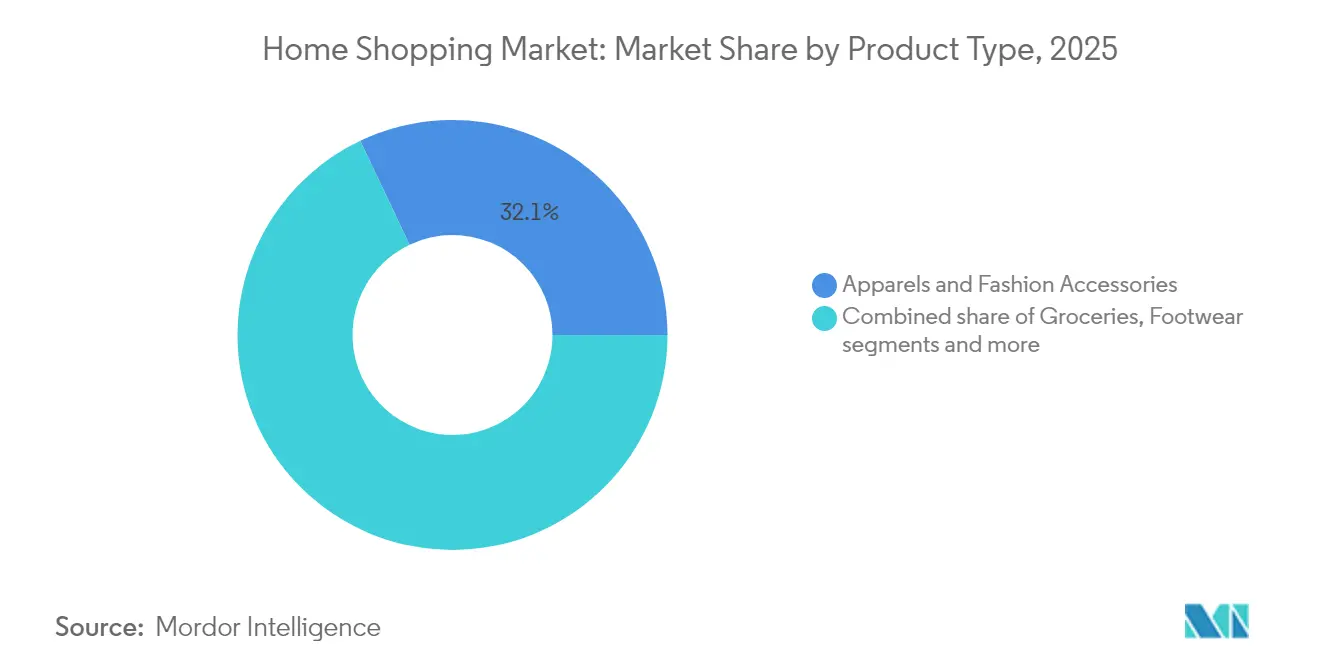
- By product category, apparel and fashion accessories led with 32.06% of the home shopping market share in 2025, while groceries are projected to post the fastest 12.38% CAGR through 2031.
- By market type, online shopping held 72.10% of the home shopping market size in 2025, and mobile shopping is advancing at a 12.02% CAGR to 2031.
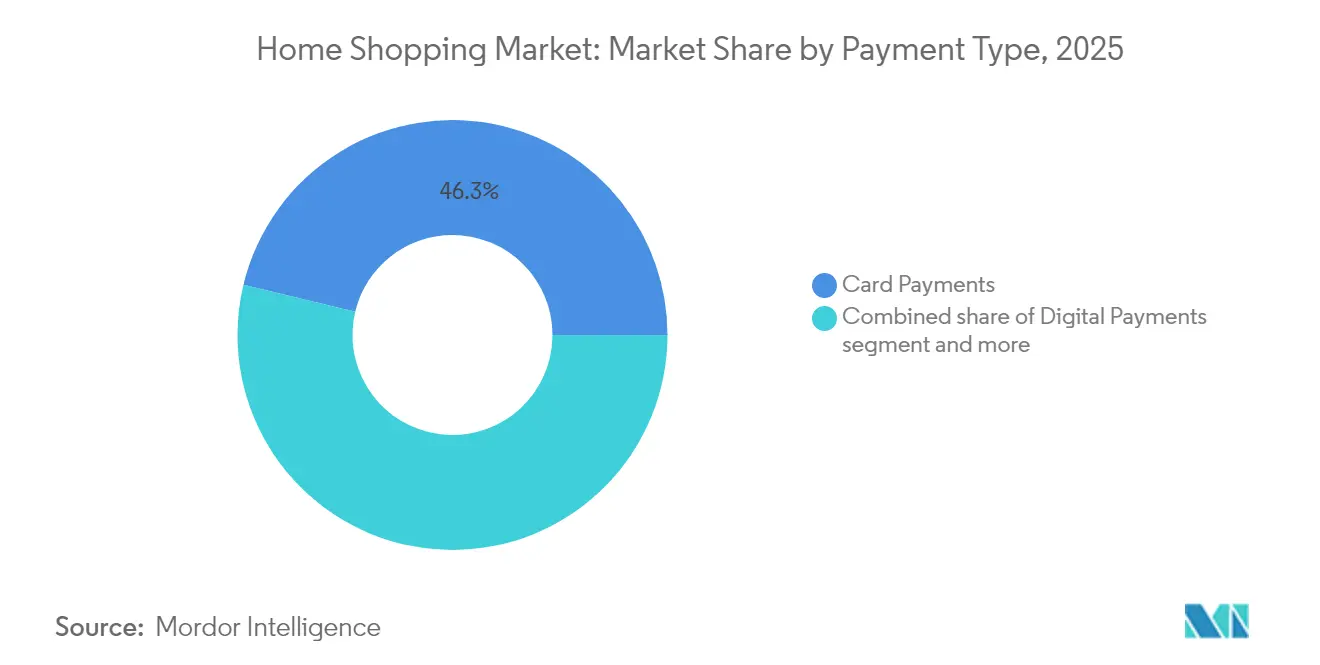
- By payment type, card payments commanded a 46.25% share of the home shopping market size in 2025; digital payments will register the highest 12.41% CAGR through 2031.
- By geography, Asia-Pacific accounted for 35.84% of 2025 revenue, whereas the Middle East and Africa are forecast to expand at an 11.79% CAGR to 2031.
Note: Market size and forecast figures in this report are generated using Mordor Intelligence’s proprietary estimation framework, updated with the latest available data and insights as of 2026.
Global Home Shopping Market Trends and Insights
Drivers Impact Analysis*
| Driver | (~) % Impact on CAGR Forecast | Geographic Relevance | Impact Timeline |
|---|---|---|---|
| Rapid penetration of E-commerce platforms | +2.3% | Global, with acceleration in Asia-Pacific and the Middle East and Africa | Medium term (2-4 years) |
| Advancements in digital payment infrastructure | +1.8% | Asia-Pacific core, spillover to the Middle East and Africa and Latin America | Short term (≤ 2 years) |
| Increasing spend on social media advertising | +1.6% | North America and Europe, expanding to Asia-Pacific | Medium term (2-4 years) |
| Development of subscription-based delivery services | +1.4% | North America and Europe mature markets, emerging in Asia-Pacific | Long term (≥ 4 years) |
| Personalization through AI and data analytics | +1.2% | Global, led by North America and China | Medium term (2-4 years) |
| Rising demand for convenience and time efficiency | +1.0% | Global, strongest in urban centers | Short term (≤ 2 years) |
| Source: Mordor Intelligence | |||
Rapid penetration of E-Commerce platforms
The rapid growth of e-commerce platforms is a significant driver of the home shopping market. The widespread availability of user-friendly platforms has reduced entry barriers for both consumers and sellers, offering anytime, anywhere access to a wide range of products. Features such as personalized recommendations, real-time price comparisons, and customer reviews have bolstered consumer confidence and accelerated online purchasing behavior. Additionally, e-commerce platforms allow retailers to scale quickly, expand geographically without substantial physical infrastructure, and adapt to changing consumer preferences using data-driven insights. This growth is further supported by advancements in last-mile logistics and omnichannel integration, enhancing convenience and reliability. According to the European Commission, 77% of internet users in the European Union purchased goods or services online in 2024, highlighting the extensive adoption of digital commerce in mature markets [1]Source: European Commission, "E-commerce statistics for individuals", ec.europa.eu. As e-commerce platforms continue to evolve and expand in both developed and emerging regions, they remain a key driver of the sustained growth of the home shopping market.
Advancements in digital payment infrastructure
Advancements in digital payment infrastructure are a key driver of the home shopping market, significantly reducing friction in the purchasing process and enhancing consumer trust in online transactions. The availability of secure, fast, and interoperable payment solutions such as digital wallets, real-time bank transfers, contactless cards, and in-app payment systems has made online shopping more accessible to a wider consumer base. These solutions facilitate instant payments, seamless checkout experiences, and improved transaction transparency, leading to higher conversion rates and repeat purchases. Enhanced security measures, including tokenization, biometric authentication, and multi-factor verification, have further reduced fraud concerns, encouraging a shift away from cash-based and manual payment methods. Additionally, digital payment infrastructure supports innovative commerce models such as subscriptions, buy-now-pay-later (BNPL), and cross-border transactions, broadening the applications of home shopping platforms.
Increasing spend on social media advertising
Increasing expenditure on social media advertising is driving the market by enhancing brand visibility, consumer engagement, and purchase conversions across digital channels. Retailers and e-commerce platforms are dedicating larger portions of their marketing budgets to social media due to its ability to deliver highly targeted and data-driven campaigns. Social media platforms facilitate immersive shopping experiences through features such as shoppable posts, live commerce, influencer collaborations, and integrated checkout options, effectively reducing the time from product discovery to purchase. This form of advertising is particularly effective in encouraging impulse buying and reaching mobile-first consumers. Supporting this trend, the Interactive Advertising Bureau (IAB) reported that online advertising revenue in the United States reached USD 258.6 billion in 2024, underscoring the scale and growing investment in digital and social media advertising. As brands increasingly utilize social platforms to build awareness, drive traffic, and boost sales, the rising expenditure on social media advertising is playing a critical role in expanding the reach and growth of the home shopping market.
Development of subscription-based delivery services
The growth of subscription-based delivery services is a key driver in the home shopping market, as it enhances customer retention, increases purchase frequency, and provides retailers with predictable revenue streams. These models offer consumers value through benefits such as free or discounted shipping, faster delivery, exclusive deals, and bundled services, fostering long-term loyalty to platforms. Subscription services simplify repeat purchases, particularly for frequently needed items like groceries, household essentials, and personal care products, while also enabling automatic replenishment and personalized recommendations. For retailers, these models enhance demand forecasting, improve logistics efficiency, and strengthen customer engagement through data-driven insights. Supporting this trend, Amazon.com Inc.’s 2024 annual report indicates that Amazon Prime delivered approximately 300 million items, showcasing the scale, efficiency, and widespread consumer adoption of subscription-based fulfillment systems. As more retailers implement similar membership and subscription strategies, these services are emerging as a significant driver of sustained growth and competitive advantage in the home shopping market.
Restraints Impact Analysis*
| Restraint | (~) % Impact on CAGR Forecast | Geographic Relevance | Impact Timeline |
|---|---|---|---|
| Data privacy and cybersecurity concerns | -0.9% | Global, most acute in Europe and North America | Short term (≤ 2 years) |
| Limited consumer trust in certain product categories | -0.7% | Global, varies by product category and region | Medium term (2-4 years) |
| Infrastructure limitations may hamper growth | -0.6% | Middle East and Africa, rural Asia-Pacific, Latin America | Long term (≥ 4 years) |
| Regulatory and compliance challenges | -0.5% | Global, fragmented by jurisdiction | Medium term (2-4 years) |
| Source: Mordor Intelligence | |||
Data privacy and cybersecurity concerns
Data privacy and cybersecurity concerns serve as a significant restraint on the growth of the home shopping market. The rise in digital transactions increases the risk of data breaches, identity theft, and online fraud for both consumers and retailers. Home shopping platforms depend heavily on collecting and processing personal, financial, and behavioral data, and any perceived weaknesses in data protection systems can erode consumer trust and discourage online purchases. High-profile cyberattacks, incidents of payment fraud, and unauthorized data sharing have raised consumer awareness of privacy risks, prompting some users to reduce digital engagement or avoid storing payment information online. Additionally, stricter data protection regulations and compliance requirements add to operational complexity and costs, particularly for smaller retailers with limited cybersecurity resources. The ongoing need for investments in encryption, fraud detection, and secure infrastructure further pressures profit margins. Together, these factors contribute to consumer hesitation and pose challenges to market growth.
Limited consumer trust in certain product categories
Limited consumer trust in specific product categories continues to act as a significant restraint on the home shopping market, particularly for products requiring physical inspection, trial, or sensory evaluation before purchase. Categories such as high-value electronics, luxury fashion, cosmetics, furniture, and perishable goods often encounter skepticism regarding product authenticity, quality, fit, durability, or freshness when purchased remotely. Concerns about discrepancies between online descriptions and actual products, counterfeit items, and the complexity of returns and refunds can deter online purchases or result in abandoned shopping carts. This trust deficit is further exacerbated in markets with inconsistent regulatory oversight, quality assurance mechanisms, or seller verification processes. While platforms are making efforts to mitigate these concerns through reviews, ratings, guarantees, and return policies, persistent doubts continue to hinder adoption in certain categories. Consequently, limited consumer trust restricts deeper penetration of home shopping in high-involvement or experience-driven product segments, posing a structural challenge to overall market growth.
*Our forecasts treat driver/restraint impacts as directional, not additive. The impact forecasts reflect baseline growth, mix effects, and variable interactions.
Segment Analysis
By Product Type: Fashion Leads, Groceries Accelerate
Apparel and fashion accessories accounted for 32.06% of the market share in 2025, establishing themselves as the leading product segment. This dominance is attributed to their strong alignment with changing consumer lifestyles, frequent purchase cycles, and high visual appeal. The segment benefits from consistent demand driven by fashion trends, seasonal variations, and heightened style consciousness, which promote repeat purchases and sustain year-round consumption. Apparel and accessories cater to a wide demographic range across various age groups, income levels, and usage occasions, making them more resilient compared to niche categories. Additionally, the ease of showcasing designs, fabrics, and styling combinations enhances consumer engagement and encourages impulse buying behavior.
Groceries are projected to achieve the fastest growth, with a 12.38% CAGR through 2031. This growth is driven by their essential nature, high consumption frequency, and the increasing preference for convenient purchasing formats. The segment benefits from consistent, repeat demand, making it a stable yet rapidly expanding category. Growth is further supported by the rising adoption of packaged and branded food products, improved product assortments, and a greater focus on quality, safety, and shelf life. Consumers are increasingly opting for convenience-oriented solutions such as ready-to-cook, ready-to-eat, and portion-controlled grocery items, accelerating category penetration. Moreover, the expansion of private labels, value packs, and bundled offerings has improved affordability and accessibility while maintaining profit margins.


By Market Type: Mobile Closes the Gap
Online shopping accounted for 72.10% of the market share in 2025, establishing itself as the leading channel due to its convenience, extensive product range, and seamless purchasing experience. The shift toward digital retail has been driven by growing consumer familiarity with online platforms, improved user interfaces, personalized recommendations, and competitive pricing. Online shopping enables consumers to compare products, access exclusive deals, and shop at any time, significantly increasing purchase frequency across both essential and discretionary categories. Supporting this trend, the India Brand Equity Foundation (IBEF) reports that the number of online shoppers in India surged from 140 million in 2020 to nearly 260 million in 2024, underscoring the rapid growth of the digital consumer base and the structural shift toward online channels .
Mobile shopping is expected to grow at a compound annual growth rate (CAGR) of 12.02% through 2031, fueled by the widespread adoption of smartphones, increasing mobile internet penetration, and a preference for app-based purchasing. Consumers are increasingly drawn to mobile shopping for its ease of use, speed, and the ability to shop anytime and anywhere, making it particularly attractive for impulse purchases and frequent, low-value transactions. The rise of retailer and marketplace apps offering personalized recommendations, app-exclusive discounts, and streamlined checkout options has further boosted adoption. Additionally, advancements in mobile payment technologies, such as digital wallets, UPI, and one-click payment features, have minimized purchasing barriers and enhanced consumer trust.
By Payment Type: Digital Gains on Cards
Card payments accounted for 46.25% of the transaction share in 2025, maintaining their position as the most widely used payment method due to their speed, reliability, and broad acceptance across both online and offline retail channels. Consumers prefer card payments for their ease of use, enhanced security features such as two-factor authentication, and seamless integration with e-commerce platforms, mobile applications, and contactless point-of-sale systems. The popularity of card payments is further bolstered by their suitability for both high-value and routine transactions. Additionally, the widespread availability of credit and debit cards, combined with loyalty rewards, cashback offers, and fraud protection, has increased consumer trust and repeat usage. Supporting this trend, data from the United Kingdom Finance indicates that nearly 2.21 billion credit and debit card transactions were recorded in the United Kingdom in August 2025, highlighting the scale, maturity, and continued reliance on card-based payments in advanced retail ecosystems .
Digital payments are projected to grow at a robust CAGR of 12.41% through 2031, driven by the accelerating shift toward cashless transactions and the widespread adoption of digital-first financial ecosystems. Consumers are increasingly opting for digital payment methods such as mobile wallets, UPI, QR-based payments, and app-integrated payment solutions due to their speed, convenience, and enhanced security features. This growth is further supported by the deeper integration of digital payments across e-commerce platforms, mobile shopping applications, and omnichannel retail environments, enabling seamless and frictionless checkout experiences. Advancements in encryption, tokenization, and real-time authentication have also strengthened consumer trust, leading to higher transaction volumes and increased repeat usage.
Geography Analysis
Asia-Pacific accounted for 35.84% of the market share in 2025, establishing itself as the leading regional contributor. This dominance is attributed to its large digital consumer base, rapid urbanization, and widespread adoption of online and mobile commerce platforms. The region benefits from a dynamic retail ecosystem, supported by extensive smartphone usage, improved internet accessibility, and the presence of major e-commerce marketplaces offering diverse product assortments at competitive prices. Consumers in Asia-Pacific exhibit high engagement with digital channels for both essential and discretionary purchases, facilitated by a variety of payment options and a rapidly evolving logistics infrastructure. Additionally, the region's robust manufacturing base and dense supplier networks enable efficient fulfillment and frequent product updates, reinforcing its leadership in the global market.
The Middle East and Africa are projected to achieve the fastest regional CAGR of 11.79% through 2031. This growth is primarily driven by the rapid adoption of smartphones, which is outpacing fixed broadband deployment, and a strong emphasis on digital transformation. Governments in the region are actively promoting digitization initiatives to modernize commerce, financial services, and public infrastructure, accelerating consumer adoption of online shopping and digital payments. For instance, Saudi Arabia’s Vision 2030 focuses on developing the digital economy, encouraging cashless transactions, and fostering technology-enabled retail ecosystems. These efforts, combined with a young, mobile-first population and expanding fintech solutions, position the Middle East and Africa as the most rapidly growing regional market during the forecast period.
North America and Europe continue to experience steady growth, supported by high digital maturity, well-established e-commerce ecosystems, and strong consumer trust in online platforms and digital payment systems. In these regions, growth is driven more by increasing purchase frequency, omnichannel integration, and the adoption of advanced retail technologies, such as AI-driven personalization and same-day delivery, rather than first-time adoption. Consumers increasingly demand seamless experiences across online, mobile, and physical channels, prompting retailers to invest in platform optimization and logistics efficiency. While growth rates are moderate compared to other regions, North America and Europe remain strategically significant markets due to their high transaction values, demand for premium products, and ongoing innovation in digital commerce models.

Competitive Landscape
The home shopping market demonstrates a moderate level of concentration, with a mix of dominant global players and a diverse range of regional and niche operators. Key companies in the market include Amazon.com Inc., Walmart Inc., Alibaba Group Holding Limited, and Qurate Retail Inc. These major players leverage their scale, advanced logistics capabilities, and robust digital ecosystems to maintain a competitive edge. Competition in the market revolves around factors such as product assortment, pricing, delivery speed, customer experience, and the integration of technology across online, mobile, and televised shopping formats. While large platforms hold a significant share of the market, opportunities for differentiation remain through specialized offerings, regional focus, and innovative fulfillment models, preventing excessive market consolidation.
Strategic partnerships, acquisitions, and ecosystem expansion are critical for companies aiming to enhance customer engagement and unlock new revenue streams. For instance, Walmart’s acquisition of Vizio for USD 2.3 billion in 2024 enabled the company to compete more effectively in the retail media space by embedding advertising directly into smart TV interfaces. This move aligns with a broader industry trend of monetizing first-party data, content, and consumer touchpoints beyond traditional commerce. Additionally, leading players continue to invest in private labels, fulfillment infrastructure, data analytics, and advertising platforms to diversify revenue streams and increase customer retention.
Despite the dominance of established players, significant opportunities exist in underserved segments such as B2B industrial procurement, cross-border luxury resale, and hyper-local grocery delivery. These areas often present structural challenges for incumbents, including fragmented supplier networks, complex regulatory environments, and localized operational requirements that hinder scalability. Such constraints create opportunities for specialized platforms and regional players to develop tailored solutions that address specific customer needs more effectively. Consequently, competition is expected to intensify not only among major global platforms but also from agile new entrants targeting these niche, high-growth segments, gradually reshaping the competitive landscape of the home shopping market.
Home Shopping Industry Leaders
-
Amazon.com Inc.
-
Alibaba Group Holding Limited
-
Walmart Inc.
-
QVC Group
-
JD.com Inc.
- *Disclaimer: Major Players sorted in no particular order

Recent Industry Developments
- December 2025: Flipkart has acquired a majority stake in Minivet AI, a provider of Artificial Intelligence and Machine Learning solutions. This acquisition is a strategic initiative aimed at developing and investing in core Generative AI capabilities, as e-commerce increasingly transitions towards visual, conversational, and AI-driven discovery.
- July 2025: JD.com has announced a strategic investment partnership with CECONOMY to develop a next-generation consumer electronics platform in Europe. Through this collaboration, both companies aim to establish Europe’s leading platform in the consumer electronics market.
- June 2025: Amazon India has launched five new fulfillment centers (FCs) to expand its operations network in the country. These centers are located in Indore, Bhubaneshwar, Kochi, Rajpura, and one in the Delhi-NCR region, offering a combined storage capacity of over 1.8 million cubic feet.
- January 2024: Walmart introduced new generative AI-powered features aimed at enhancing the experience for both shoppers and associates. These capabilities are designed to interpret the context of customer queries and provide personalized responses.


Global Home Shopping Market Report Scope
Home shopping is the electronic retailing and home shopping channels industry, including billion-dollar television-based and e-commerce companies, traditional mail orders, and brick-and-mortar retailers.
The home shopping market is segmented by type and geography. Based on type, the market is segmented into teleshopping, e-commerce and mobile shopping, and other types. Based on geography, the market is segmented into North America, Europe, Asia-Pacific, South America, the Middle East and Africa.
For each segment, the market sizing and forecasts have been done on the basis of value (in USD million).
| Groceries | |||
| Apparel and Fashion Accessories | |||
| Footwear | |||
| Beauty and Personal Care | |||
| Furniture and Home Decor | |||
| Electronic Goods | |||
| Others | Toys, Games, | Books, Stationery, | Health, Welness |
| Television Home Shopping Channels |
| Online Shopping |
| Mobile Shopping |
| Others |
| Card Payments |
| Digital Payments |
| Cash Payments |
| Others |
| North America | United States |
| Canada | |
| Mexico | |
| Rest of North America | |
| Europe | Germany |
| United Kingdom | |
| Italy | |
| France | |
| Spain | |
| Netherlands | |
| Poland | |
| Belgium | |
| Sweden | |
| Rest of Europe | |
| Asia-Pacific | China |
| India | |
| Japan | |
| Australia | |
| Indonesia | |
| South Korea | |
| Thailand | |
| Singapore | |
| Rest of Asia-Pacific | |
| South America | Brazil |
| Argentina | |
| Colombia | |
| Chile | |
| Peru | |
| Rest of South America | |
| Middle East and Africa | South Africa |
| Saudi Arabia | |
| United Arab Emirates | |
| Nigeria | |
| Egypt | |
| Morocco | |
| Turkey | |
| Rest of Middle East and Africa |
| By Product Type | Groceries | |||
| Apparel and Fashion Accessories | ||||
| Footwear | ||||
| Beauty and Personal Care | ||||
| Furniture and Home Decor | ||||
| Electronic Goods | ||||
| Others | Toys, Games, | Books, Stationery, | Health, Welness | |
| By Market Type | Television Home Shopping Channels | |||
| Online Shopping | ||||
| Mobile Shopping | ||||
| Others | ||||
| By Payment Type | Card Payments | |||
| Digital Payments | ||||
| Cash Payments | ||||
| Others | ||||
| By Geography | North America | United States | ||
| Canada | ||||
| Mexico | ||||
| Rest of North America | ||||
| Europe | Germany | |||
| United Kingdom | ||||
| Italy | ||||
| France | ||||
| Spain | ||||
| Netherlands | ||||
| Poland | ||||
| Belgium | ||||
| Sweden | ||||
| Rest of Europe | ||||
| Asia-Pacific | China | |||
| India | ||||
| Japan | ||||
| Australia | ||||
| Indonesia | ||||
| South Korea | ||||
| Thailand | ||||
| Singapore | ||||
| Rest of Asia-Pacific | ||||
| South America | Brazil | |||
| Argentina | ||||
| Colombia | ||||
| Chile | ||||
| Peru | ||||
| Rest of South America | ||||
| Middle East and Africa | South Africa | |||
| Saudi Arabia | ||||
| United Arab Emirates | ||||
| Nigeria | ||||
| Egypt | ||||
| Morocco | ||||
| Turkey | ||||
| Rest of Middle East and Africa | ||||


Key Questions Answered in the Report
How large is the global home shopping market in 2026?
The home shopping market size is USD 7.41 trillion in 2026.
What is the expected compound annual growth rate through 2031?
The market is forecast to expand at a 12.05% CAGR over 2026-2031.
Which product segment is growing the fastest?
Groceries will record the highest 12.38% CAGR through 2031 as cold-chain logistics mature.
Why are digital payments gaining on card transactions?
Open-banking mandates and real-time payment rails lower merchant fees, fueling a 12.41% CAGR for digital payments.
Page last updated on:


