
Technology, Media and Telecom
5th MayPricing Strategy for Semiconductor Components
3 Min Read
Home Theatre System Market is Segmented by Type (Home Theatre-In-A-Box, Component System, Soundbar System, and More), Connectivity (Wired, Wireless), End User (Residential, Commercial, and More), Distribution Channel (Online Retail, Direct / System Integrators, and More), and Geography. The Market Forecasts are Provided in Terms of Value (USD).
Market Overview
| Study Period | 2020 - 2031 |
|---|---|
| Market Size (2026) | USD 11.42 Billion |
| Market Size (2031) | USD 17.81 Billion |
| Growth Rate (2026 - 2031) | 9.32 % CAGR |
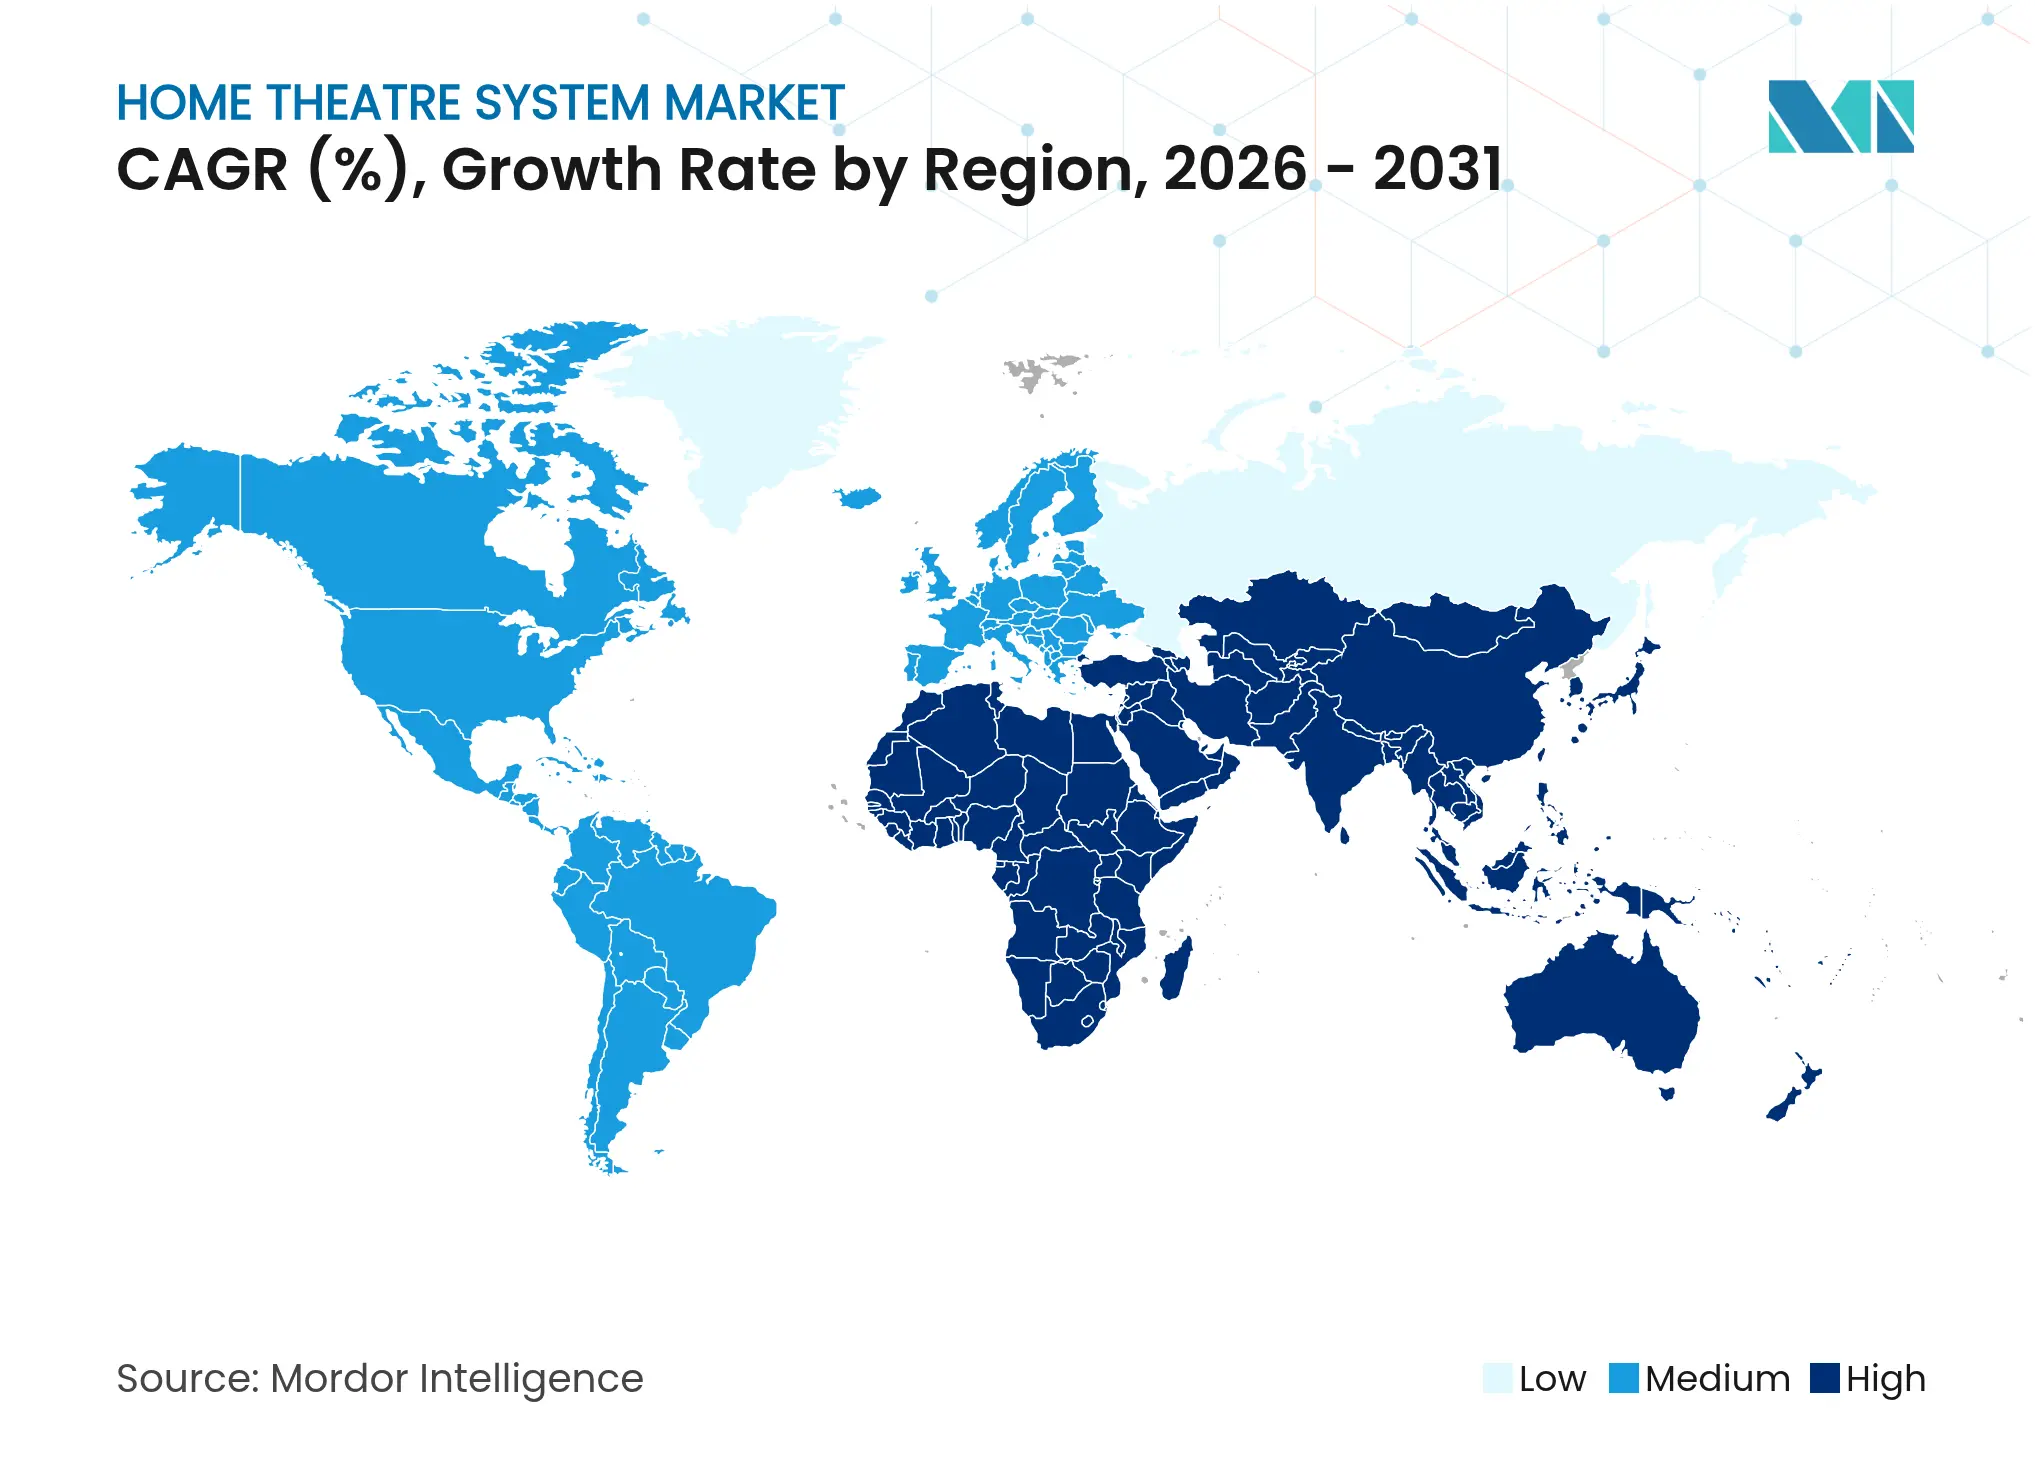
| Fastest Growing Market | Asia |
| Largest Market | Middle East |
| Market Concentration | Low |
Major Players *Disclaimer: Major Players sorted in no particular order. Image © Mordor Intelligence. Reuse requires attribution under CC BY 4.0. |
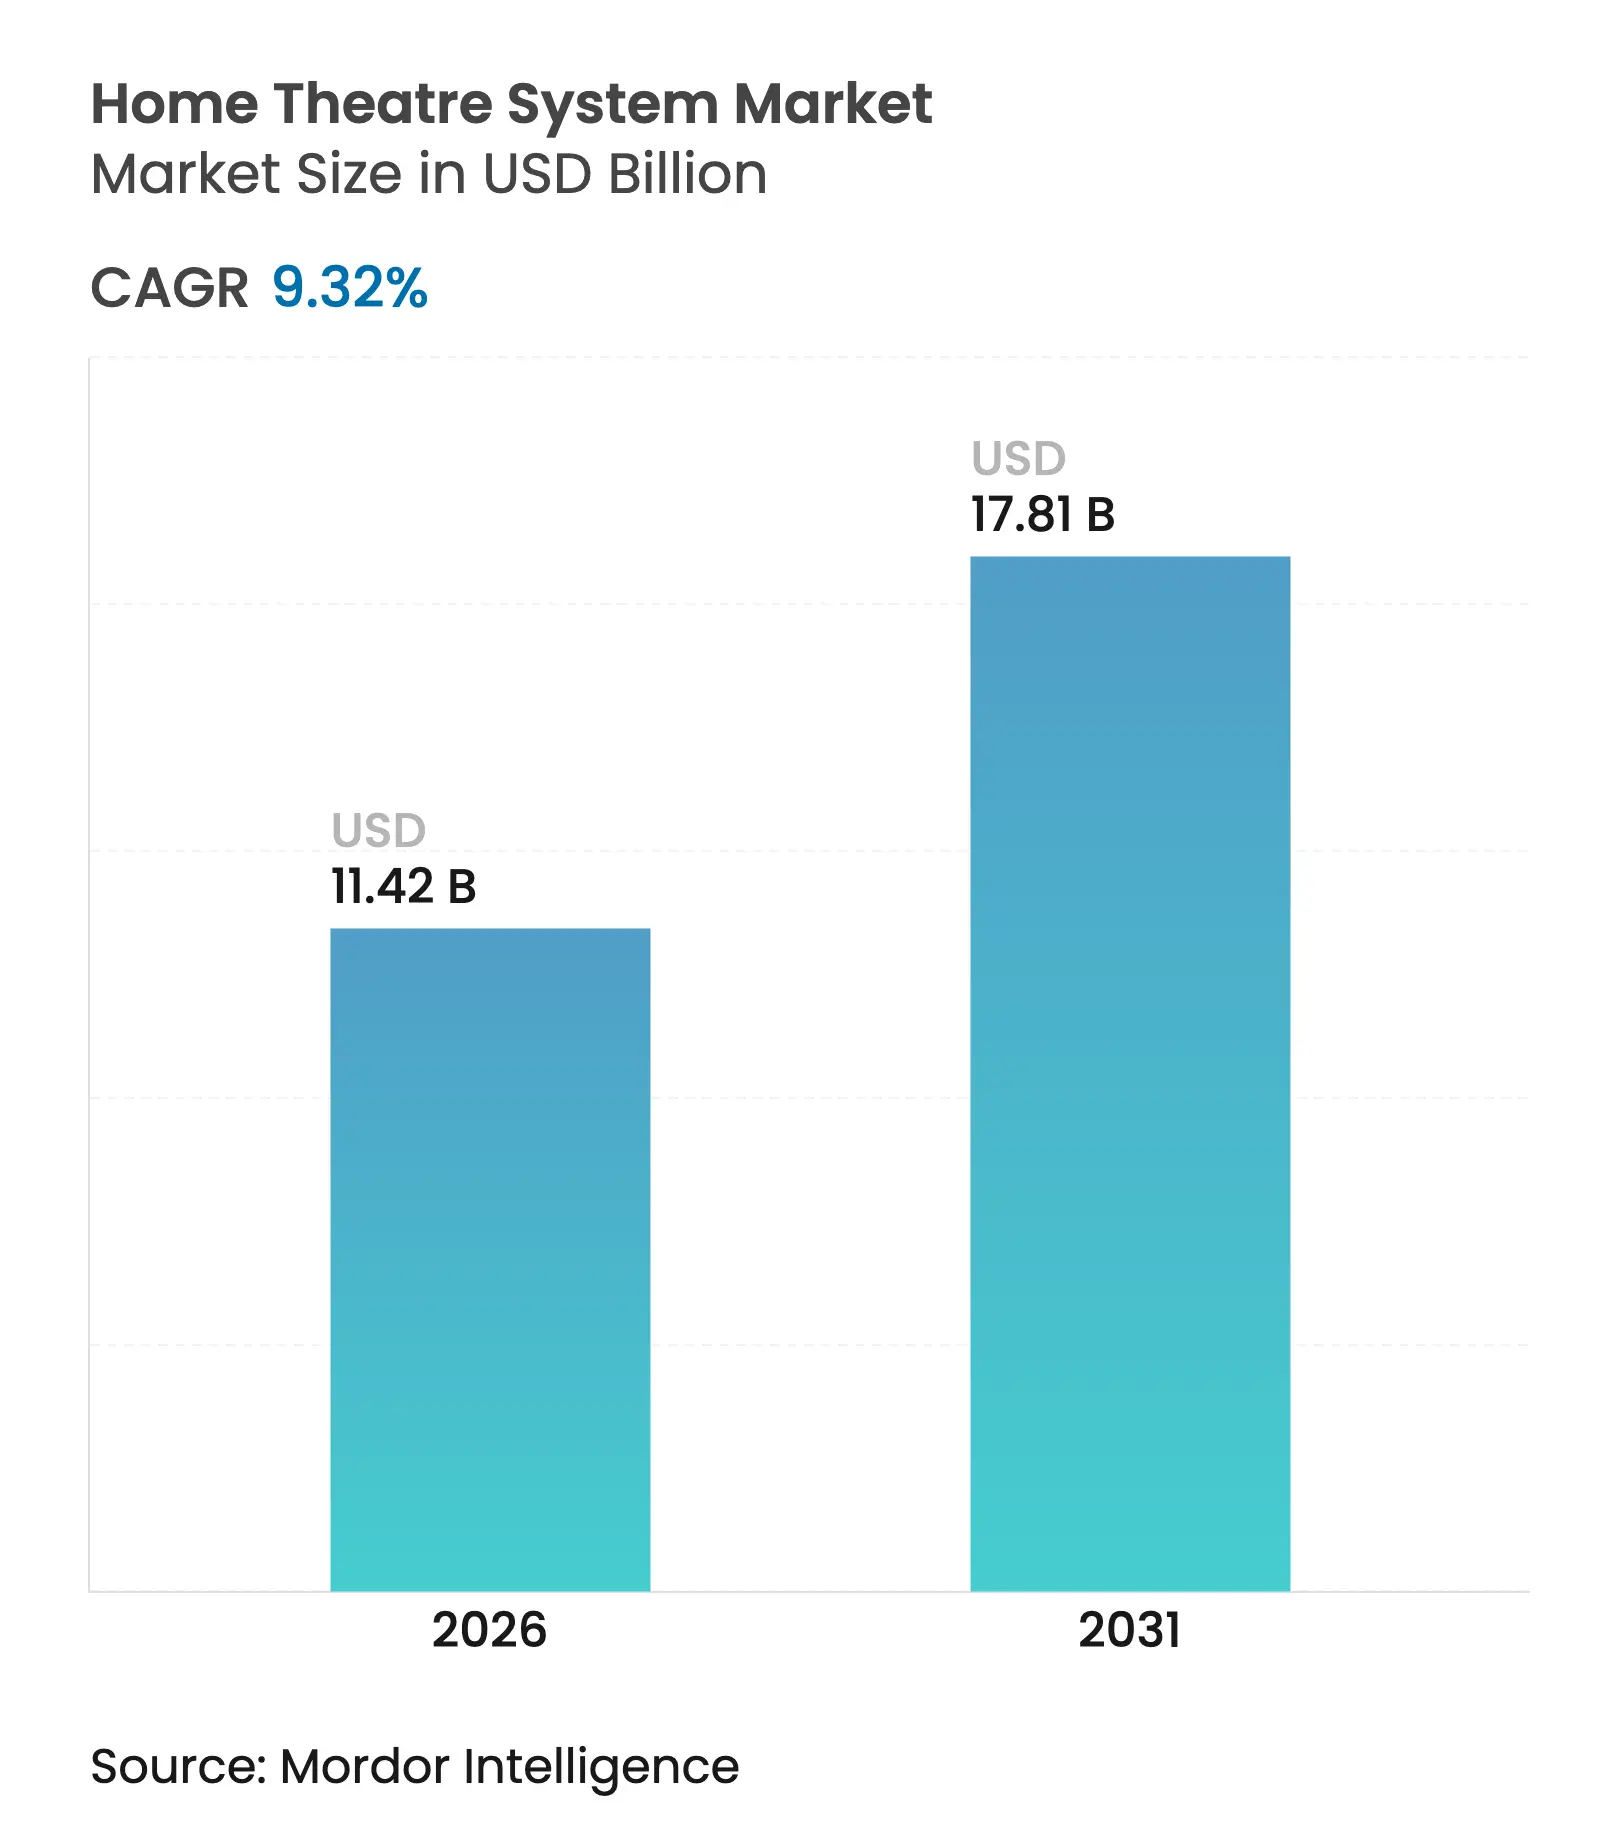
The home theatre systems market size is expected to grow from USD 10.45 billion in 2025 to USD 11.42 billion in 2026 and is forecast to reach USD 17.81 billion by 2031 at 9.32% CAGR over 2026-2031. Continuous household spending on streaming services, rapid wireless-audio innovation, and smarter integration with connected-home platforms give the category reliable tailwinds even when other discretionary electronics slow. Slimmer drivers and lower-profile enclosures now match modern televisions, making the upgrade path obvious when screens are refreshed. Partnerships between hardware makers and streaming providers ensure that each new surround-sound codec becomes a timely incentive for consumers to replace or supplement existing units. In effect, the home theatre systems market operates as a flywheel: richer content libraries spark hardware demand, higher installed bases attract fresh engineering investment, and the cycle repeats.
Key Report Takeaways
Note: Market size and forecast figures in this report are generated using Mordor Intelligence's proprietary estimation framework, updated with the latest available data and insights as of 2026.
Drivers Impact Analysis
| Driver | (~) % Impact on CAGR Forecast | Geographic Relevance | Impact Timeline | |||
|---|---|---|---|---|---|---|
Growing OTT Dolby-Atmos Content Growing OTT Dolby-Atmos Content | +2.1% | North America, Europe, developed APAC | Short term (≤2 yrs) | (~) % Impact on CAGR Forecast :+2.1% | Geographic Relevance :North America, Europe, developed APAC | Impact Timeline :Short term (≤2 yrs) |
Affordable Chinese Wireless Systems Affordable Chinese Wireless Systems | +1.4% | Europe, emerging APAC, Latin America | Medium term (3-4 yrs) | |||
Luxury Real-Estate Bundling Luxury Real-Estate Bundling | +0.8% | GCC, Singapore | Medium term (3-4 yrs) | |||
Rising eSports Audio Demand Rising eSports Audio Demand | +1.2% | South Korea, Germany, China, North America | Short term (≤2 yrs) | |||
Post-Pandemic Suburban US Spend Post-Pandemic Suburban US Spend | +0.9% | North America, Australia, UK | Medium term (3-4 yrs) | |||
Urban APAC All-in-One Soundbars Urban APAC All-in-One Soundbars | +1.8% | Japan, Hong Kong, Singapore, China, South Korea | Short term (≤2 yrs) | |||
| Source: Mordor Intelligence | ||||||
Growing OTT Dolby Atmos Content
Streaming platforms released exponentially more Atmos titles in 2024, with Netflix alone surpassing 1,200 immersive entries. Viewers experiencing down-mixed stereo on older equipment found an immediate incentive to upgrade, prompting United States retailers to report a 43% jump in Atmos-enabled soundbar shipments. The resulting cascade accelerated manufacturer roadmaps; most mid-tier models launching in early 2025 list Atmos as a standard feature, underscoring how codec availability reshapes baseline expectations. Lower entry pricing below USD 300 further broadens the addressable audience, lifting first-time adoption in the home theatre systems market.
Affordable Chinese Wireless Systems
TCL and Hisense bundled Atmos-ready soundbars with mid-range televisions throughout Europe in 2024, together capturing 17% of regional wireless-audio revenue [1]TCL Technology Group, “Investor Update 2024–25,” tcl.com. Retailers benefited from simplified merchandising—one box met both picture and sound needs—while households welcomed cable-free convenience. Established European brands pivoted to sustainability messaging, marketing low-carbon supply chains, and modular repairability to defend their share. The pricing wedge, however, remains significant enough to steer price-sensitive consumers toward Chinese entrants, reinforcing the disruptive role of vertical integration inside the home theatre systems market.
Luxury Real-estate Bundling
Developers in Dubai fitted 68% of homes priced above USD 2 million with media rooms in 2024 [2]Dubai Land Department, “Annual Luxury Housing Report 2024,” dubailand.gov.ae. Singapore mirrored the pattern, with 52% of upscale condominiums offering turnkey cinema packages [3]Urban Redevelopment Authority Singapore, “Private Residential Statistics Q4 2024,” ura.gov.sg. By embedding audio costs into mortgage financing, property firms guarantee hardware placement at scale, smoothing revenue for premium brands even when consumer sentiment weakens elsewhere. Residents increasingly pay upgrade fees for invisible in-wall arrays, proving that hidden hardware now signals prestige alongside fidelity.
Rising eSports Audio Demand
Competitive gamers prioritise latency and positional accuracy over pure loudness. In 2024, 43% of Korean shoppers cited directional clarity as their top purchase criterion, mirrored by 38% of German gaming households [4]Samsung Electronics, “Gaming Soundbar Sales Performance 2024,” news.samsung.com. Manufacturers reacted with variable head-tracking modes and sub-5 ms wireless links. Retail observations confirm that once gamers test these functions in-store, attach rates for matching wireless subwoofers rise. The halo effect enlarges the home theatre systems market among the gaming demographic.
Restraints Impact Analysis
| Restraint | (~) % Impact on CAGR Forecast | Geographic Relevance | Impact Timeline | |||
|---|---|---|---|---|---|---|
Neodymium Price Inflation Neodymium Price Inflation | –1.3% | Global | Medium term (3-4 yrs) | (~) % Impact on CAGR Forecast :–1.3% | Geographic Relevance :Global | Impact Timeline :Medium term (3-4 yrs) |
Space Constraints in Urban Apartments Space Constraints in Urban Apartments | –0.7% | Global Urban Centres | Long term (≥5 yrs) | |||
Audiophile Skepticism over Wireless Audiophile Skepticism over Wireless | –0.4% | Premium Segment | Short term (≤2 yrs) | |||
Smart-TV Integrated Speakers Smart-TV Integrated Speakers | –0.9% | Global | Medium term (3-4 yrs) | |||
| Source: Mordor Intelligence | ||||||
Neodymium Price Inflation
Rare-earth magnets cost 32% more in 2024, inflating premium-soundbar bills of material by 11%. Manufacturers reduced magnet mass and, in some entry units, switched to ferrite, but average retail tags still rose 5%. Consumers so far accept modest increases, meaning the restraint dampens but does not derail the home theatre systems market growth.
Space Constraints in Urban Apartments
Tokyo’s new-build average fell to 58.3 m² in 2024, while Hong Kong’s stood at 45.7 m². Multi-box layouts remain impractical, giving soundbars and virtual-surround solutions the advantage. Although the trend encourages compact designs, it restricts the adoption of larger, higher-margin configurations, moderating overall value growth.
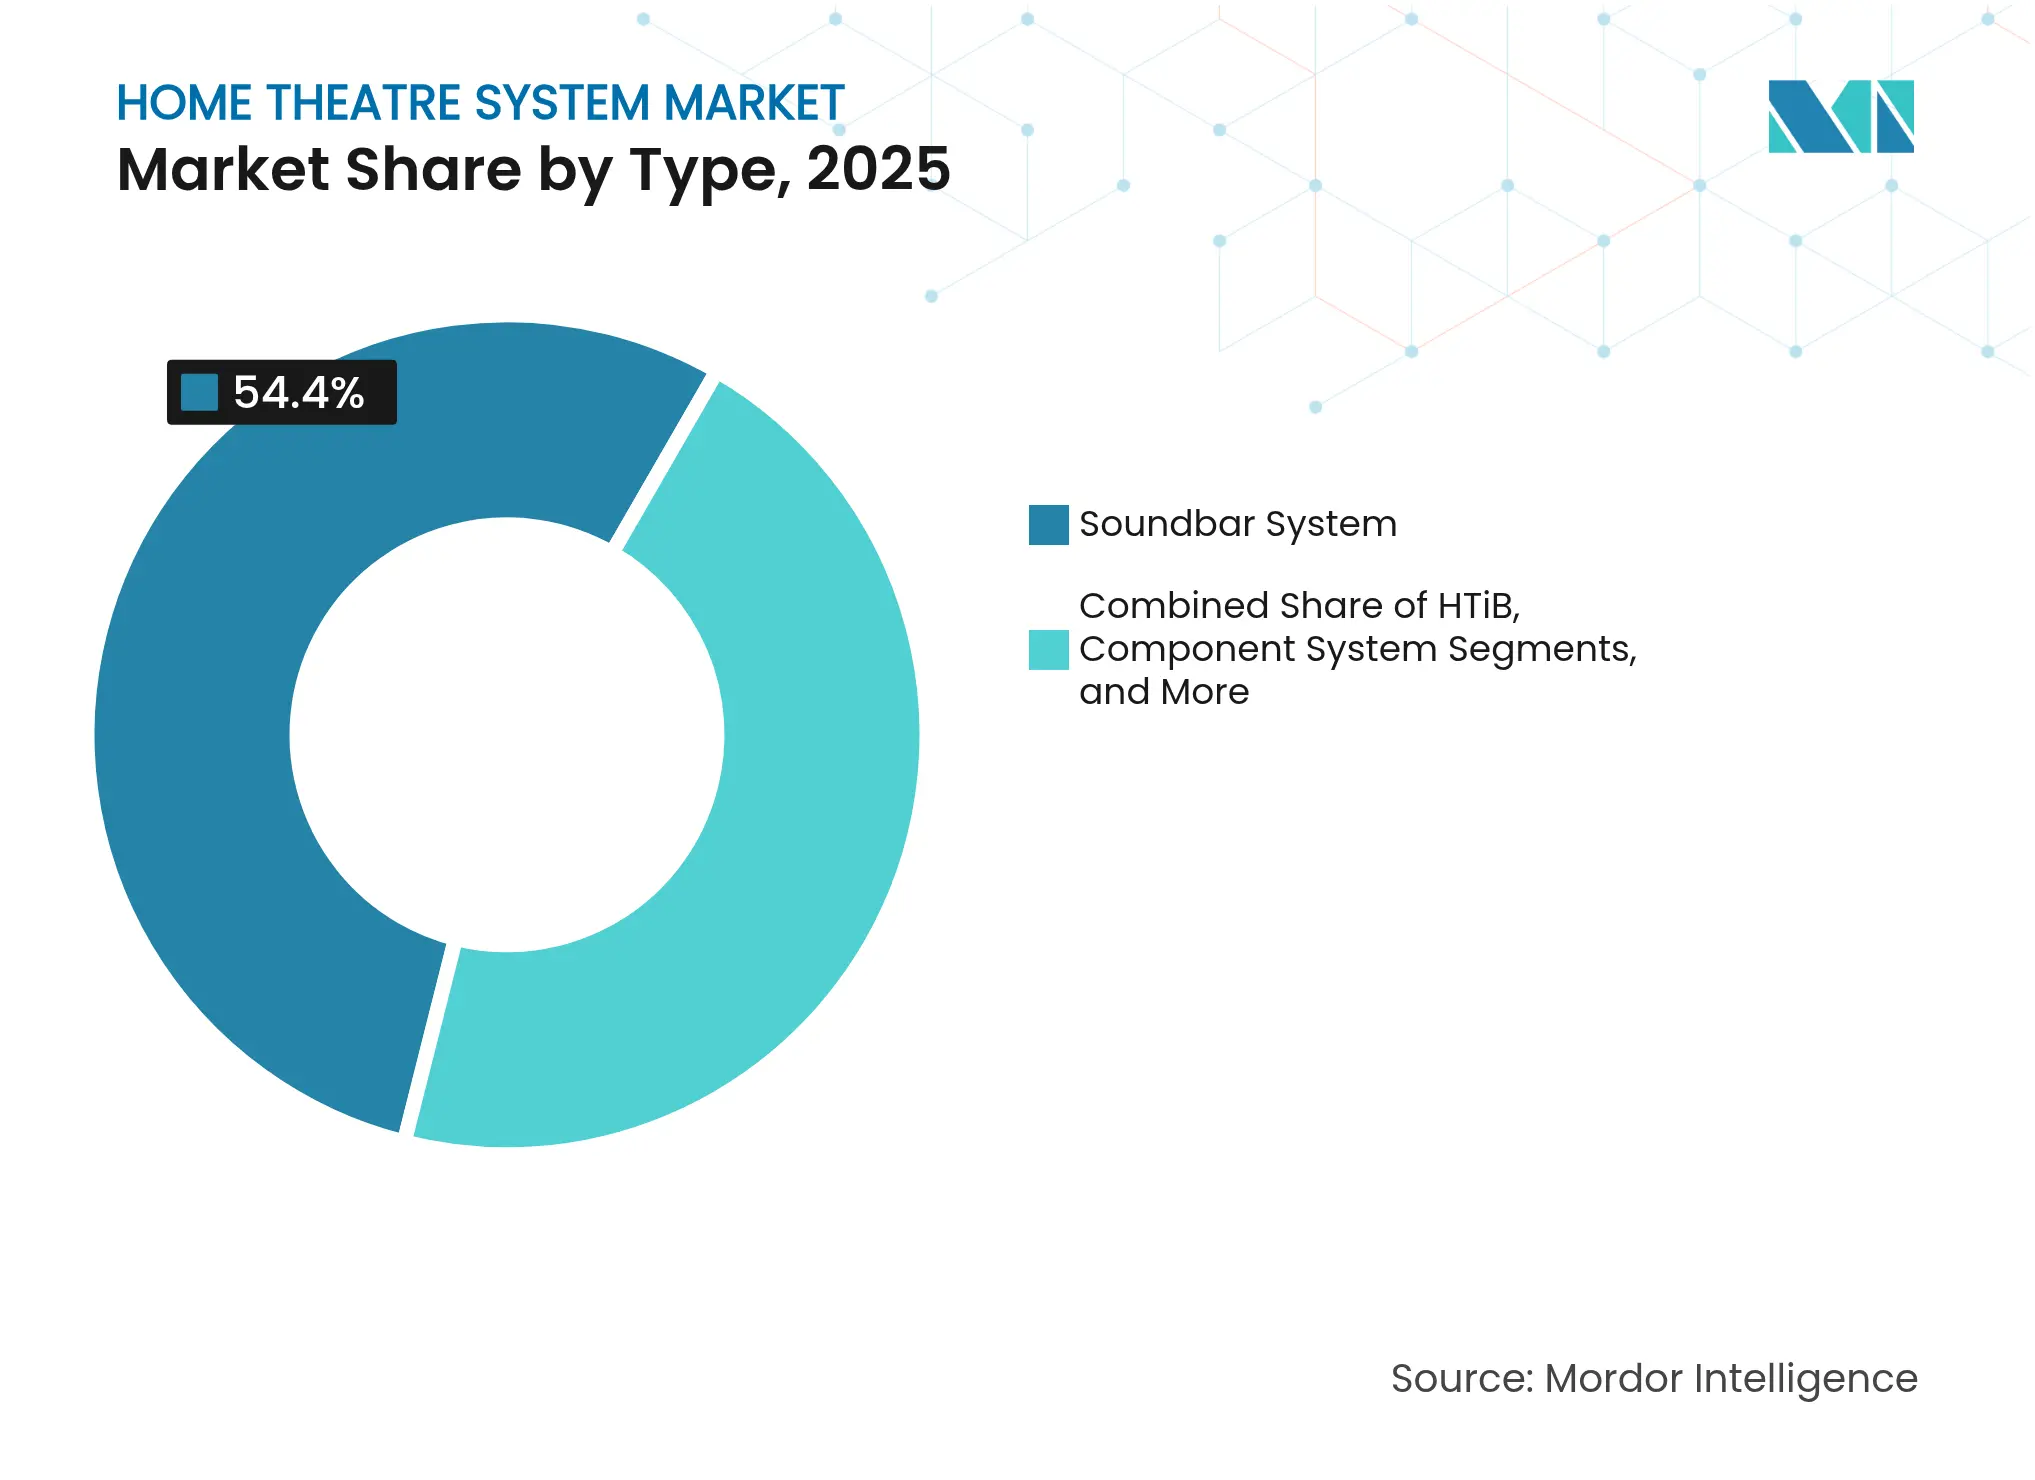
By Type: Soundbars dominate, but convergence reshapes demand
Soundbars captured a 54.40% home theatre systems market share in 2025, equal to USD 5.68 billion. Replacement cycles now mirror televisions because consumers swap bars whenever screens acquire new HDR or codec capabilities. The home theatre systems market size for soundbars is, therefore, intimately linked to streaming service updates. Home theatre PC/media-centre systems, though smaller, are projected to expand at a 12.08% CAGR, reflecting gamers’ desire to consolidate control across entertainment and smart-home domains. Component receivers regain relevance among suburban buyers who leverage the same amplifier for conference calls and family movie nights. In-wall theatres thrive in luxury construction where hidden grids fit architectural plans, proving that convenience and personalisation trump sheer channel count.
Note: Segment shares of all individual segments available upon report purchase
By Connectivity: Wired steadiness meets wireless acceleration
Wired setups generated 61.20% of the home theatre systems market size, or USD 6.39 billion, in 2025 as cinephiles trust physical links for uncompromised throughput. Installers prefer cables inside new-build drywall, guaranteeing clean aesthetics before occupancy. Wireless systems, however, will grow at a 14.62% CAGR to 2031. Standards such as Wi-Fi 6E and WiSA 2.0 now achieve latency under 5 ms, while battery-powered rears allow patio movie nights without extension cords. Hybrid receivers entering 2025 catalogues bridge the gap, supporting future-proof installations and illustrating how wired and wireless cease to be mutually exclusive.
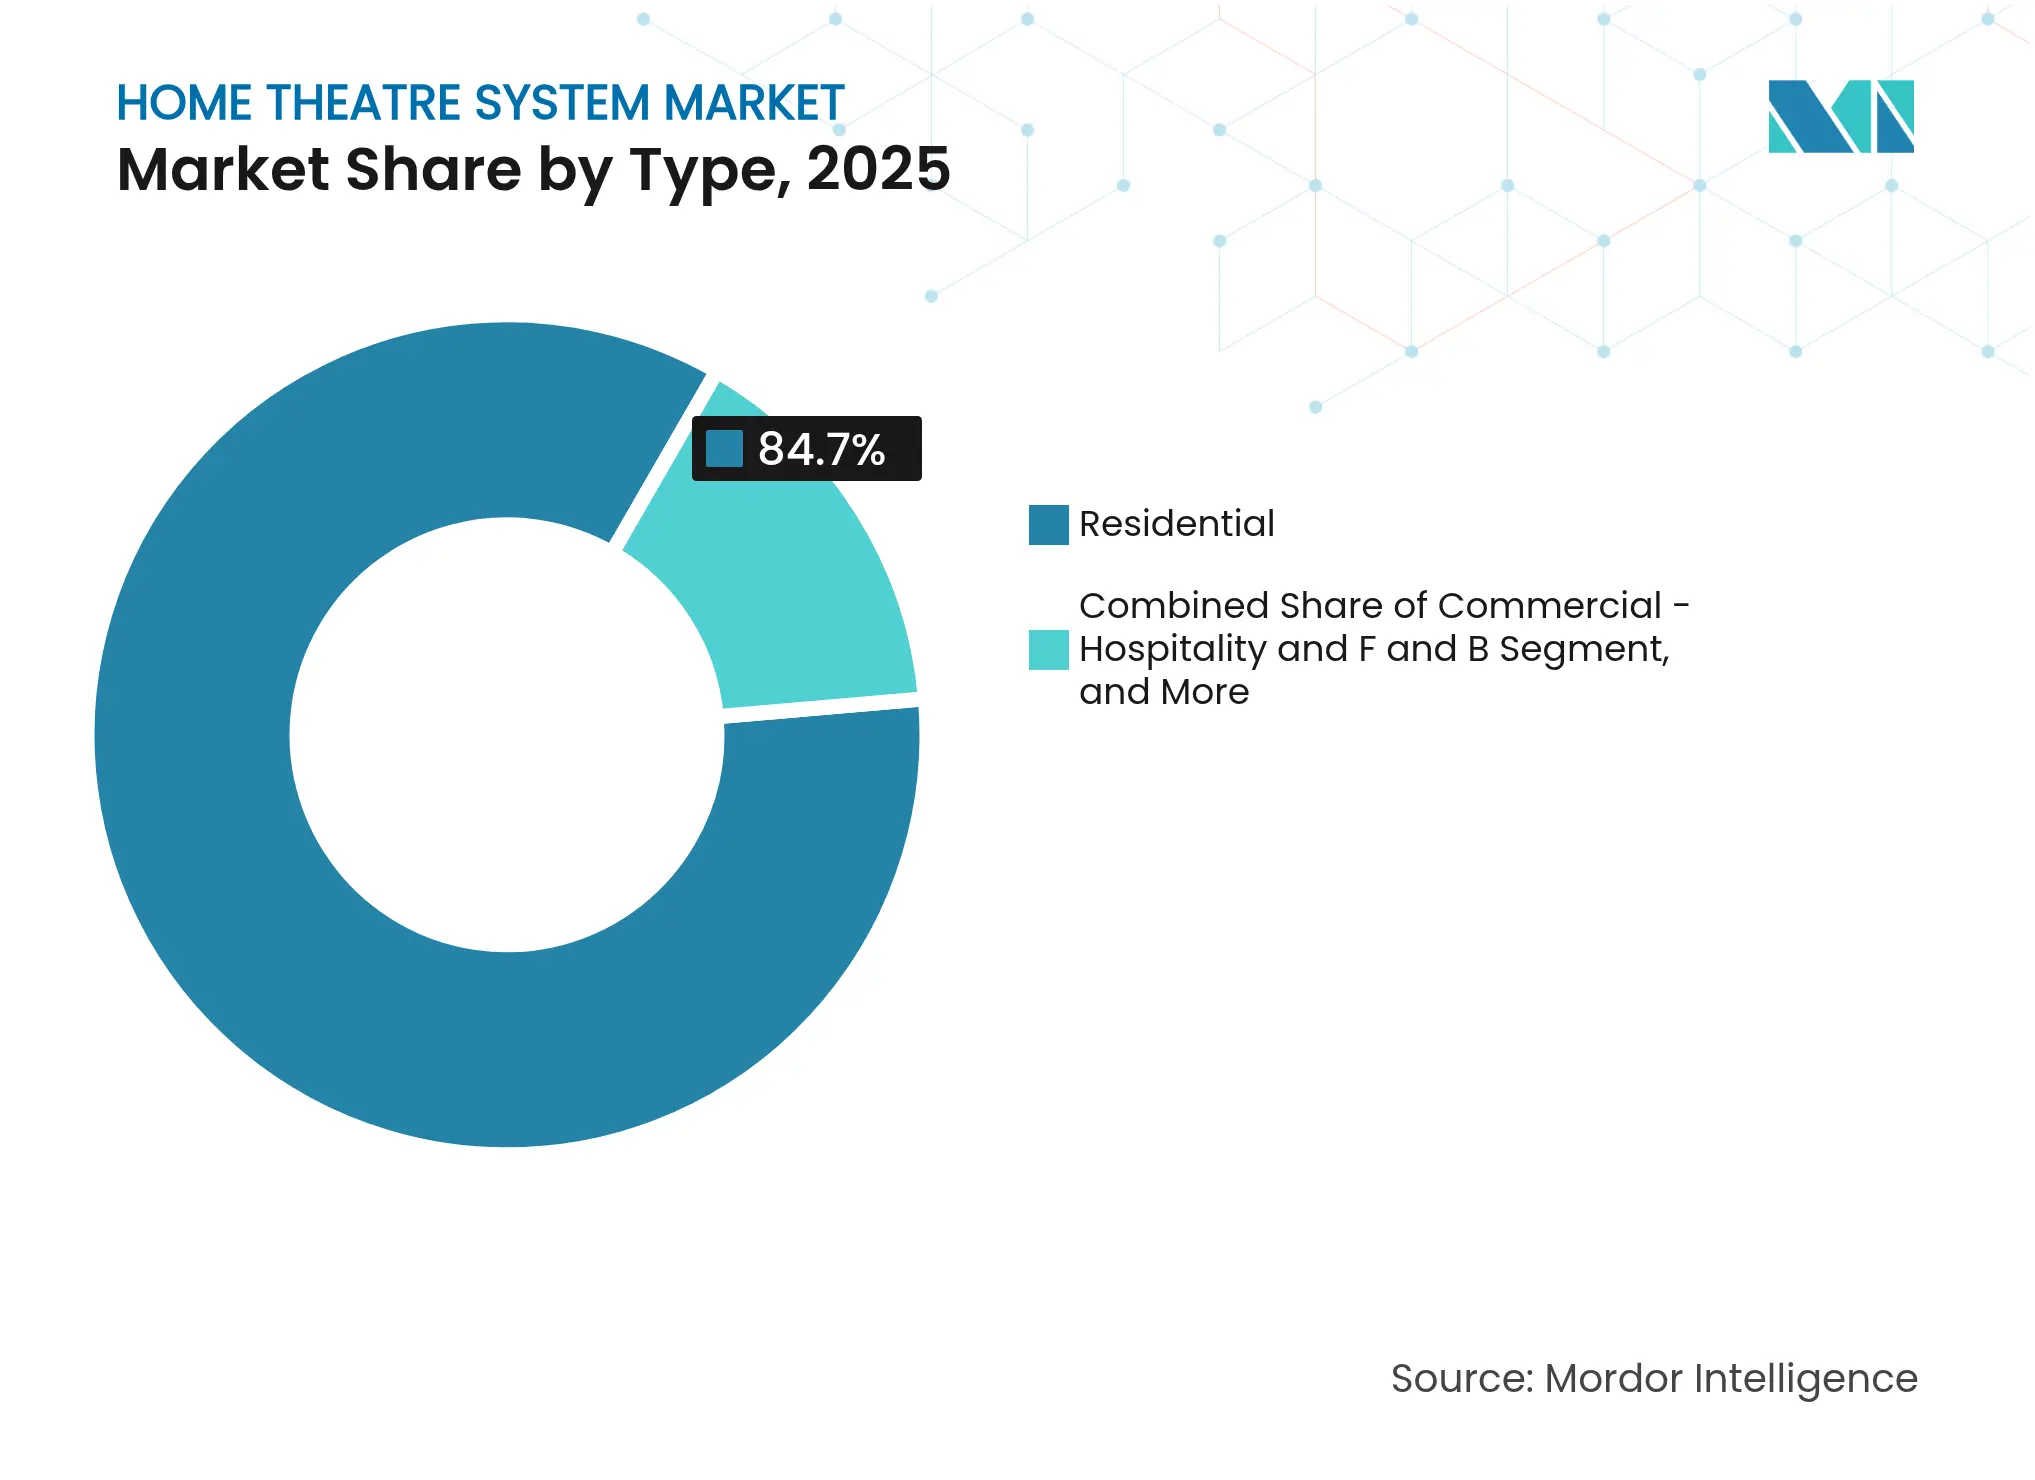
By End User: Residential still leads, but commercial use gains
Residential buyers delivered 84.70% of 2025 revenue, worth USD 8.85 billion, and remain dominant. Urban renters gravitate to single-bar solutions, whereas detached-home owners invest in multi-zone receivers feeding backyard speakers. Commercial hospitality and food-and-beverage venues will expand at an 11.55% CAGR through 2031, with upscale restaurants using directional ceiling arrays and boutique hotels adding sensor-triggered lobby soundscapes. Luxury vehicles and yachts integrate APIs compatible with home gear, hinting at cross-environment audio strategies that extend the home theatre systems market beyond the living room.
Note: Segment shares of all individual segments available upon report purchase
By Distribution Channel: Showrooms retain influence while e-commerce scales
Offline consumer-electronics stores held 45.90% of the home theatre systems market share in 2025 (USD 4.80 billion) because customers want to audition bass response physically. Retailers introduced isolated demo booths in 2025, raising conversion on premium bars. Online retail will climb at a 13.28% CAGR as augmented-reality previews and verified reviews build trust. Specialist AV dealers stay essential for calibration-heavy installations, proving that human expertise sustains margin even in a digitised landscape.
Asia generated USD 3.25 billion in 2025 and remains the prime growth engine for the home theatre systems market. Rising disposable income in China boosts festival-season bulk purchases, while Japanese urban micro-apartments fuel demand for ultra-slim bars. South Korean retailers dedicate gaming-audio kiosks, acknowledging that latency benchmarks sway local buying decisions. Regional manufacturing clusters keep costs low, allowing price tiers that resonate across diverse cities.
North America posted USD 2.86 billion in 2025, with suburban lifestyles supporting dedicated media rooms. Component systems find new life as hybrid work setups require high-clarity conferencing. Canada’s strict energy labels push auto-standby features, nudging brands to embed power dashboards inside companion apps. Broad voice-assistant adoption raises multi-room add-on purchases and elevates unit values.
Europe delivered USD 2.55 billion, balancing design finesse and eco concerns. Scandinavian fabric-wrapped bars influence colour palettes elsewhere, while German minimalism steers cable-routing accessories. Competitive pressure from Chinese entrants prompts local brands to emphasise circular-economy credentials and extended firmware support. Modular speaker blocks that retailers accept for trade-in gain traction, aligning consumption with sustainability goals.
Market Concentration
Samsung, Sony, LG, Bose, and Sonos together control 58% of the home theatre systems market share in 2024. Their vertical integration—often pairing display or smartphone units with audio gear—creates ecosystem stickiness. Patent filings intensified; Samsung alone filed 37 wireless-audio patents in 2024 at the US Patent and Trademark Office. Smaller challengers innovate through software: AI calibrators learn user preferences and auto-tweak EQ, narrowing performance gaps without matching hardware budgets. Subscription services that unlock personalised tuning or multi-room features generate recurring revenue, cushioning raw-material volatility. Outdoor weather-proof cinemas, senior-friendly voice-amplifying bars, and wellness soundscapes tuned to reduce stress present white-space niches. Strategic acquisitions and partnerships already signal incumbent interest in specialised start-ups, underscoring how software and situational design, not driver count, will dictate future competitive leverage inside the home theatre systems industry.

*Disclaimer: Major Players sorted in no particular order
1. INTRODUCTION
2. RESEARCH METHODOLOGY
3. EXECUTIVE SUMMARY
4. MARKET LANDSCAPE
5. MARKET SIZE AND GROWTH FORECASTS (VALUE)
6. COMPETITIVE LANDSCAPE
7. MARKET OPPORTUNITIES AND FUTURE OUTLOOK
Market Definitions and Key Coverage
Segmentation Overview
Detailed Research Methodology and Data Validation
Primary Research
Desk Research
Market-Sizing & Forecasting
Data Validation & Update Cycle
Why Mordor's Home Theatre System Baseline Commands Reliability
Benchmark comparison
| Market Size | Anonymized source | Primary gap driver | ||
|---|---|---|---|---|
USD 10.45 B (2025) | Mordor Intelligence | - | Anonymized source:Mordor Intelligence | Primary gap driver:- |
USD 13.53 B (2024) | Global Consultancy A | Includes stand-alone soundbars and lump-sum aftermarket speakers | ||
USD 32.69 B (2023) | Industry Association B | Combines broader home-audio devices and uses producer-price, not retail revenue | ||
USD 37.70 B (2024) | Regional Consultancy C | Applies aggressive multi-room uptake assumption and double-counts custom installs |
Pricing Strategy for Semiconductor Components
3 Min Read
Accelerating Additive Manufacturing Adoption in India
3 Min Read
Wealth Management Intelligence for the Middle East
4 Min Read
When decisions matter, industry leaders turn to our analysts. Let’s talk.