Near Field Communication Market Size and Share
Market Overview
| Study Period | 2020 - 2031 |
|---|---|
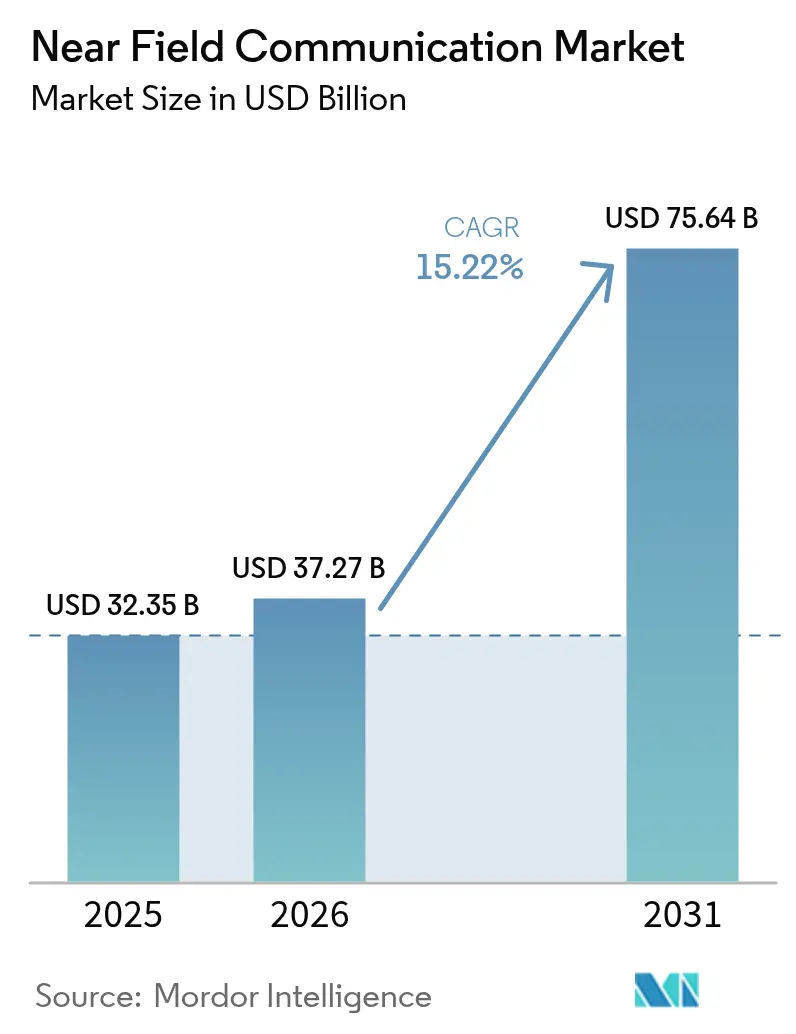
| Market Size (2026) | USD 37.27 Billion |
| Market Size (2031) | USD 75.64 Billion |
| Growth Rate (2026 - 2031) | 15.22% CAGR |
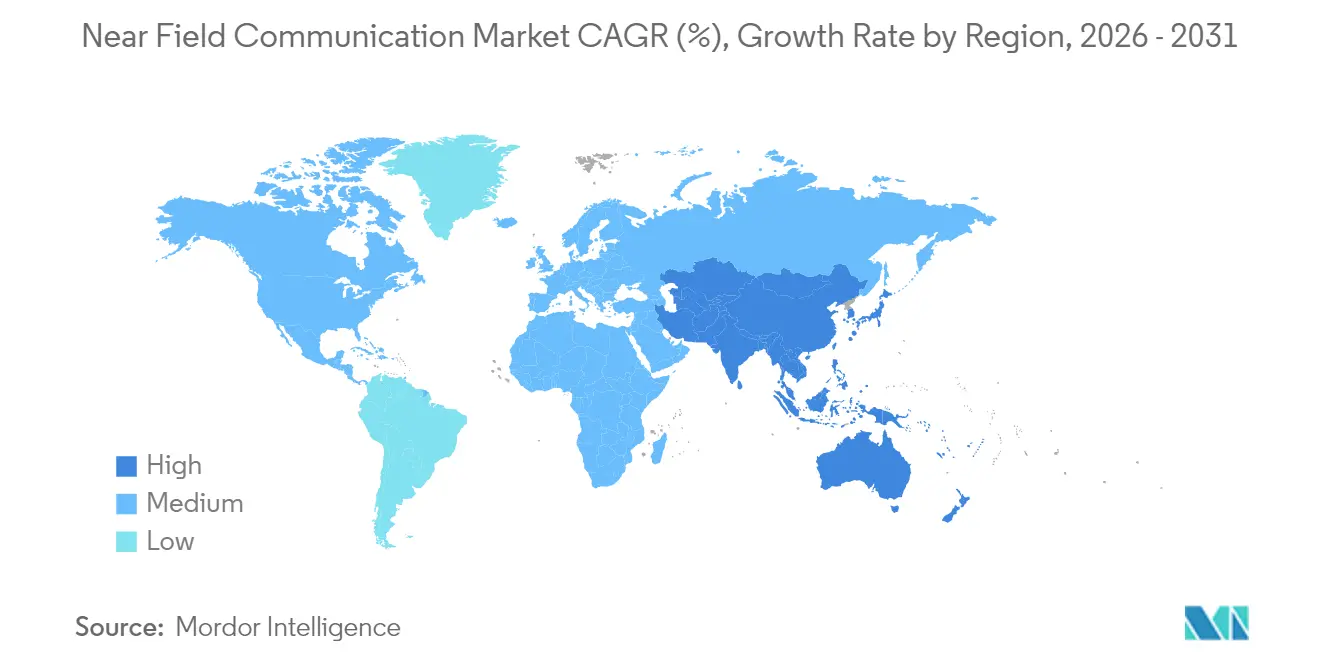
| Fastest Growing Market | Asia Pacific |
| Largest Market | Asia Pacific |
| Market Concentration | Medium |
Major Players *Disclaimer: Major Players sorted in no particular order Image © Mordor Intelligence. Reuse requires attribution under CC BY 4.0. | |
Near Field Communication Market Analysis by Mordor Intelligence
Near Field Communication market size in 2026 is estimated at USD 37.27 billion, growing from 2025 value of USD 32.35 billion with 2031 projections showing USD 75.64 billion, growing at 15.22% CAGR over 2026-2031. Growth is driven by the permanent shift toward touch-free commerce, with contactless payments now accounting for 79% of day-to-day consumer purchases worldwide.[1]Mastercard, “Consumer Contactless Trends 2025,” mastercard.comSmartphone makers have normalised NFC chip integration across mid-tier and premium devices, broadening the addressable base for mobile wallets and emerging identity services. Europe’s decision to mandate open access to handset NFC interfaces is accelerating competition among banks and fintechs, while the Asia-Pacific’s mobile-first economies continue to drive scale through high digital wallet penetration. On the supply side, manufacturers of 13.56 MHz front-end components are scrambling to increase output to meet surging demand for readers and tags. Parallel progress in EV charging, smart city infrastructure, and digital product passports underscores NFC’s transition from a payment-centric tool to a multipurpose, secure proximity platform.
Key Report Takeaways
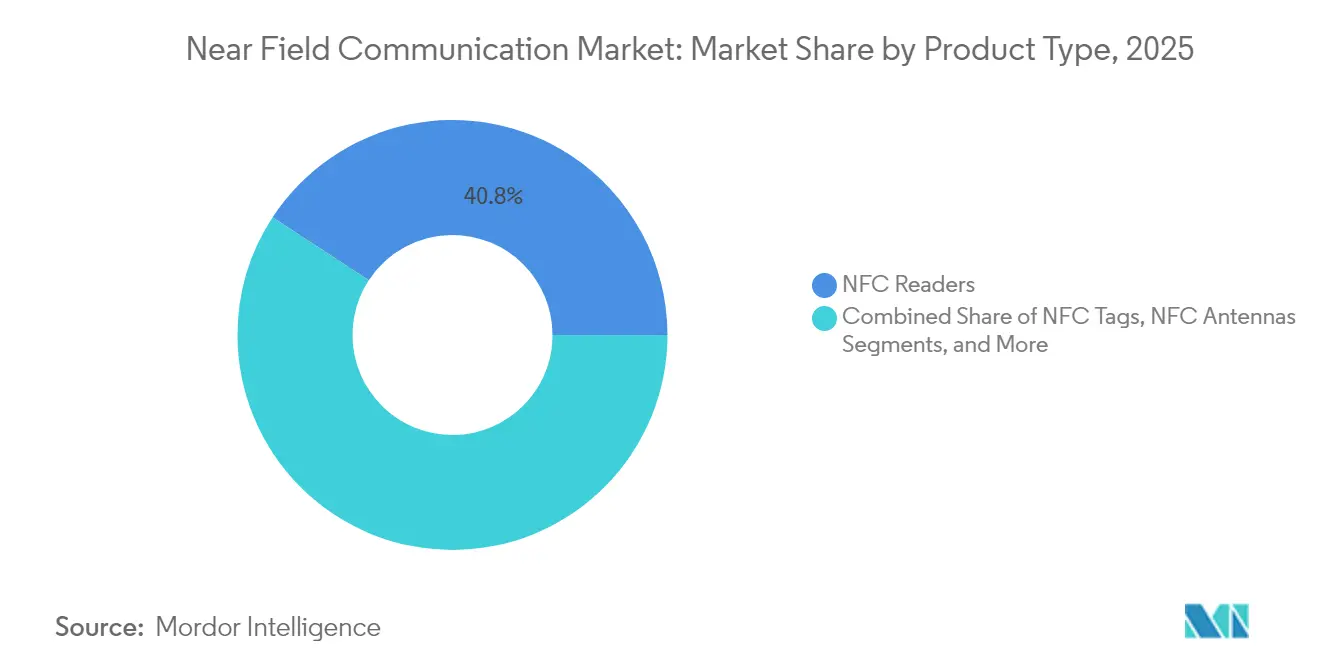
- By product type, readers led with 40.78% revenue share in 2025, while tags are projected to expand at a 16.55% CAGR through 2031.
- By operating mode, read/write held 45.55% of the Near Field Communication market share in 2025; card emulation is forecast to grow at 16.78% CAGR to 2031.
- By application, payments accounted for 38.10% of the Near Field Communication market size in 2025; identity and authentication are projected to advance at 15.79% CAGR through 2031.
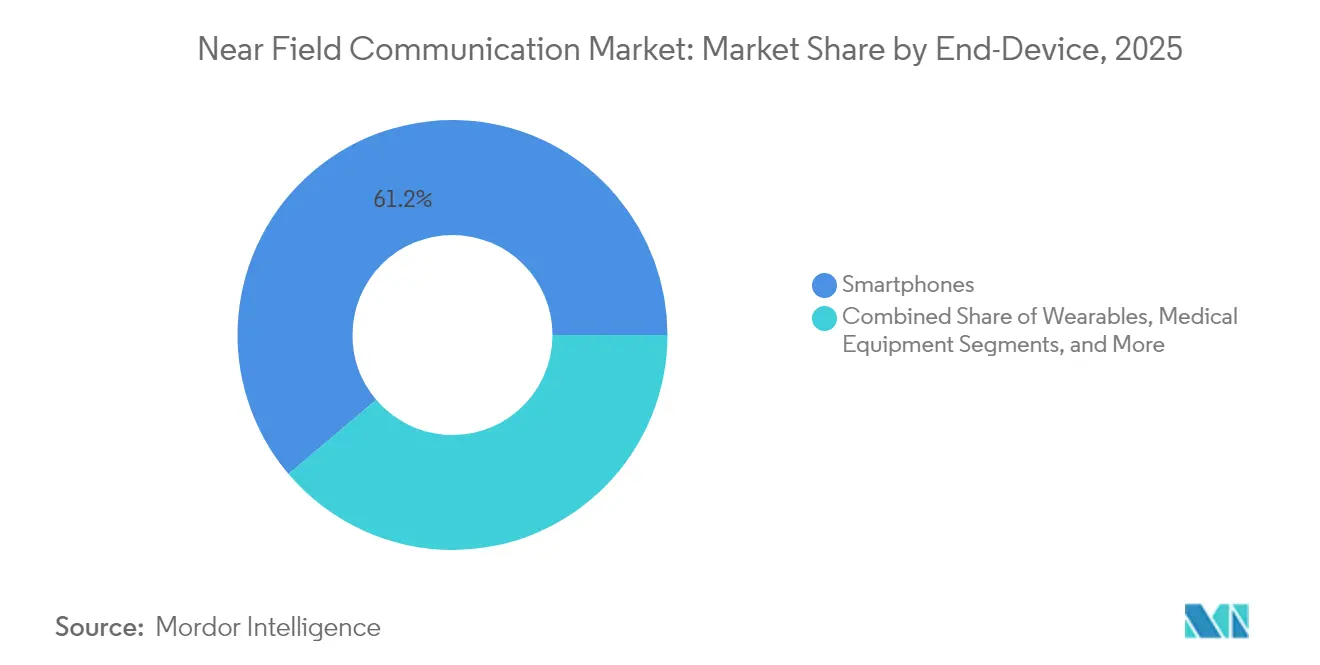
- By end-device, smartphones commanded a 61.20% share of the Near Field Communication market in 2025, while wearables posted the highest 15.41% CAGR outlook.
- By end-user vertical, retail and e-commerce led with a 24.05% revenue share in 2025; healthcare is projected to show the fastest growth, at 15.66% CAGR, through 2031.
- By geography, Asia-Pacific held a 37.45% share in 2025 and is pacing the global landscape with a 16.55% CAGR to 2031.
Note: Market size and forecast figures in this report are generated using Mordor Intelligence’s proprietary estimation framework, updated with the latest available data and insights as of 2026.
Global Near Field Communication Market Trends and Insights
Drivers Impact Analysis*
| Driver | (~) % Impact on CAGR Forecast | Geographic Relevance | Impact Timeline |
|---|---|---|---|
| Proliferation of contactless payments post-COVID-19 | +3.9% | Global; strongest in Asia-Pacific and Europe | Short term (≤ 2 years) |
| Smartphone OEMs pre-installing NFC chips | +3.1% | Global; especially mid- and premium-tier devices | Medium term (2-4 years) |
| Regulatory opening of handset NFC to third-party wallets | +2.3% | Europe first; spill-over to North America and Asia-Pacific | Medium term (2-4 years) |
| EV “plug-and-charge” authentication via NFC | +1.9% | North America and Europe; expanding to Asia-Pacific | Long term (≥ 4 years) |
| EU Digital Product Passport mandates for embedded NFC tags | +1.6% | Europe primary, with global supply chain implications | Long term (≥ 4 years) |
| Foldable/XR wearables adopting NFC for spatial UX | +1.2% | Asia-Pacific and North America early adoption markets | Long term (≥ 4 years) |
| Source: Mordor Intelligence | |||
Proliferation of Contactless Payments Post-COVID-19
Consumers embraced tap-to-pay behaviour during the pandemic and have retained it for speed and convenience. Mastercard reports that 74% of users plan to keep paying contactlessly in the future. Cash withdrawals in France have fallen sharply, signalling a structural decline in ATM reliance. Rising contactless limits in more than 50 markets further lift average transaction values. In emerging economies, merchants leapfrog mag-stripe infrastructure by adopting QR-based wallets and NFC-enabled terminals in tandem. Payment networks’ tokenisation roadmaps, aimed at removing manual card entry for e-commerce by 2030, cement NFC’s role as the foremost in-store authentication method while positioning it for friction-free online checkout.
Smartphone OEMs Pre-Installing NFC Chips
Apple’s decision to include NFC in every iPhone since 2018 set an industry standard, and Android brands quickly followed suit with secure element support in Snapdragon and Exynos platforms.[2]NFC Forum, “Release 15 Specifications,” nfc-forum.orgBroader chip integration turns NFC from a premium extra into default plumbing for mobile commerce, transit ticketing, and digital keys. The NFC Forum’s Multi-Purpose Tap specification, published in 2024, enables a single tap to launch payment, loyalty, and access actions simultaneously, thereby boosting daily user engagement. New Release 15 security upgrades, finalised in June 2025, extend cryptographic agility and improve interoperability, encouraging OEMs to deepen system-level integration. As a result, the installed base of NFC-ready phones provides a critical mass for developers, allowing them to target billions of devices without hardware fragmentation.
Regulatory Opening of Handset NFC to Third-Party Wallets
The European Commission’s antitrust ruling obliges Apple to expose Host Card Emulation on iOS, breaking a long-standing gatekeeper position.[3]European Commission, “Antitrust: Apple to Grant Access to iPhone NFC,” ec.europa.eu Banks and transit operators can now embed tap-to-pay directly into their own apps, bypassing Apple Pay fees and reclaiming user data. The shift unlocks new commercial models, closed-loop corporate wallets, municipal services passes, and cross-border public-transport tickets that previously faced platform barriers. Fintechs have accelerated the launch of pilots, while hardware vendors report higher demand for white-label, secure-element modules compatible with both iOS and Android. Other jurisdictions are watching the European playbook, and a similar debate has started in Australia and Japan, raising the prospect of a more open global NFC ecosystem.
EV “Plug-and-Charge” Authentication via NFC
Electric-vehicle owners today juggle multiple apps and cards to access public charging. To simplify the experience, the Joint Office of Energy and Transportation and SAE Industry Technologies Consortia backed a universal NFC-based plug-and-charge standard set to roll out at scale from 2025. Vehicles will handshake with chargers via a secure NFC exchange that validates identity, payment credentials, and energy-contract parameters in seconds. Automakers see synergy with digital-key initiatives that already deploy NFC for door access. Semiconductor leaders such as NXP are supporting the shift with dual-crypto MIFARE DUOX chips certified to EAL 6+ security, meeting stringent grid and automotive safety demands. Broad adoption promises shorter queues, fewer lost charging sessions, and a smoother path to mainstream EV uptake.
Restraints Impact Analysis*
| Restraint | (~) % Impact on CAGR Forecast | Geographic Relevance | Impact Timeline |
|---|---|---|---|
| Data-security and privacy concerns | -1.2% | Global, with heightened sensitivity in Europe and North America | Short term (≤ 2 years) |
| Short-range/interference limits vs BLE and UWB | -0.9% | Global, particularly affecting enterprise and automotive applications | Medium term (2-4 years) |
| 13.56 MHz front-end chip supply constraints | -1.1% | Global, with acute impact in North America and Europe manufacturing | Medium term (2-4 years) |
| Merchant tokenisation fees slowing acceptance in emerging markets | -0.8% | Asia-Pacific emerging markets, Latin America, and MEA regions | Long term (≥ 4 years) |
| Source: Mordor Intelligence | |||
Data-Security and Privacy Concerns
Higher transaction volumes magnify the consequences of NFC relay, cloning, and skimming attacks documented in academic literature. While tokenised credentials mitigate card-number theft, 25% of online transactions still bypass tokenisation, exposing gaps in the security chain. Biometric cards from Infineon and distance-bounding protocols under development promise stronger defences, yet they also raise deployment costs and integration complexity.[4] Infineon Technologies, “Trusted IC Shipments Milestone,” infineon.com Regulators in the EU are tightening PSD3 compliance requirements, obliging issuers to adopt multifactor authentication and continuous fraud monitoring. The extra steps can increase friction at checkout and may slow adoption in sectors that favour frictionless flows over maximum security, such as quick-service retail.
Short-Range / Interference Limits versus BLE and UWB
Ultra-Wideband technology can authenticate a user from several centimetres away with precise distance measurement, eliminating the deliberate “tap” motion required by NFC. UWB’s resilience to relay attacks attracts automotive OEMs and enterprises seeking hands-free entry solutions. Bluetooth Low Energy, although less secure, provides longer range and mesh connectivity that suits asset-tracking and industrial use cases. NFC counters with power harvesting, enabling battery-free tags, ultra-low silicon costs, and a mature infrastructure of billions of readers. As vendors build combo-chips that integrate NFC, BLE, and UWB, customers may select the best technology for each task, thereby limiting NFC’s share in wide-area and passive-tracking scenarios.
*Our forecasts treat driver/restraint impacts as directional, not additive. The impact forecasts reflect baseline growth, mix effects, and variable interactions.
Segment Analysis
By Product Type: Readers Drive Infrastructure While Tags Enable Compliance
In 2025, readers captured 40.78% of the Near Field Communication (NFC) market share, reflecting significant merchant investment in EMV-compliant point-of-sale (POS) hardware. Mandatory liability-shift deadlines prompted retailers to favor all-in-one terminals that support mag-stripe, chip, and tap, thereby boosting unit volumes and ASPs. Government stimulus for small-business digitisation in India, Indonesia, and Brazil added further momentum. The reader segment also benefits from software-updatable firmware that keeps terminals current with evolving card-scheme requirements. Conversely, tags, although accounting for a smaller revenue base, are forecast to register a 16.55% CAGR to 2031, the fastest within the Near Field Communication market. Europe’s Digital Product Passport regulation requires luxury goods, electronics, and automotive brands to embed immutable traceability into their products, and NFC tags provide a low-cost, standards-based method for compliance. Growing adoption of smart shelves, interactive packaging, and anti-counterfeit labels across Asia further widens the addressable tag pool.
Second-tier hardware lines, such as antennas and discrete ICs, lag behind the main segments yet benefit from design-win richness in wearables and medical devices. Miniaturised antenna arrays now support metal-backed smartwatch casings without detuning. Software and services, though only a single-digit slice of revenue, record higher gross margins by layering token-lifecycle management, analytical dashboards and loyalty engines on top of installed hardware. Retailers using campaign-linked tags report conversion-rate uplifts approaching 30% after replacing QR codes with NFC, illustrating the recurring-revenue potential of post-deployment services.


By Operating Mode: Card Emulation Gains Ground
Read/write mode dominated the Near Field Communication market size with 45.55% share in 2025, thanks to legacy uptake in access cards, poster tapping and file transfer. The mode’s simplicity, requiring only a tag and a reader, underpins adoption in libraries, museums and smart posters where cost trumps security. Card emulation, however, is projected to accelerate at a 16.78% CAGR on the back of open-wallet initiatives and digital-ID projects. Host Card Emulation lets software replicate a card applet without a physical secure element, cutting bill-of-materials for mass-market phones. Release 15 elevates secure-channel-based peer authentication, persuading banks and transit authorities to roll out software-based tickets confidently. Peer-to-peer lags due to Bluetooth’s faster file-transfer speeds, yet it remains relevant in device-pair provisioning where Wi-Fi credentials or Zigbee keys must pass securely without cloud connectivity.
As consumer interest in frictionless interactions grows, the NFC Forum’s Multi-Purpose Tap could blur mode boundaries by chaining emulation and read/write operations into a single gesture. Retail pilots indicate checkout time reductions of up to 15%, illustrating how UX gains may reshape mode preferences. Developers are likewise bundling telemetry upload, software licence validation and loyalty accrual into one tap to avoid app-switching fatigue
By Application: Identity Authentication Emerges
Payments retained 38.10% share of the Near Field Communication market size in 2025, with tap-to-pay adoption nearing saturation in many OECD countries. Networks now focus on broadening ticket sizes beyond coffee and transit by raising tap limits and embedding tokenised credentials into browser wallets. Identity and authentication, meanwhile, are forecast to post a 15.79% CAGR on rising enterprise demand for zero-trust access, remote onboarding, and EV charging authorization. Governments in Singapore and the Netherlands have issued NFC-enabled citizen IDs, and airport trials show sub-10-second passenger identity checks. Healthcare credentialling for clinicians and cold-chain pharmaceuticals further expands the segment’s scope. Access control, pairing and commissioning, and IoT provisioning all benefit from low-power passive tag operation, allowing devices that ship sealed or without batteries to be provisioned at the factory line.
Retail marketers are reviving smart-poster programmes abandoned during the QR code boom, encouraged by higher smartphone NFC scanning familiarity. One European grocer reports that replacing barcodes with rewritable tags cut shelf-label waste by 70% and trimmed price-update labour hours. These proof points suggest ancillary applications will increasingly share wallet space with payments, providing multipronged return on infrastructure investment.
By End-Device: Wearables Show Promise
Smartphones accounted for 61.20% of the Near Field Communication (NFC) market revenue in 2025, reflecting the near-ubiquitous inclusion of chipsets and user dependence on mobile wallets. Yet replacement cycles have lengthened to almost four years, moderating incremental hardware revenues. Wearables, including smartwatches, fitness bands, and rings, are expected to grow at a rate of 15.41% per year to 2031, as consumers seek lighter, always-on authentication devices for transit gates, office entry, and vending payments. OEMs such as Apple, Samsung, and Garmin report double-digit growth in NFC-enabled models. Designers are integrating improved antenna diversity and energy harvesting to support smaller form factors, while also adding biometric sensors and positioning wearables for healthcare IDs and gym access.
PCs and consumer electronics embed NFC mainly for Bluetooth pairing and service diagnostics. In medical equipment, tags simplify post-market maintenance logging and patient-device matching, aligning with stricter traceability mandates. Automotive head-units now offer tap-to-pair smartphone mirroring, while EV chargers integrate readers for cable authentication. Combined, these non-phone devices diversify the hardware revenue base and reduce reliance on smartphone refresh cycles.
By End-User Vertical: Healthcare Accelerates
Retail and e-commerce accounted for 24.05% of the revenue share in 2025, driven by the early adoption of tap-to-pay and loyalty-linked receipts. Resistance among small merchants is fading as service providers waive fixed fees and bundle reader rentals with settlement packages. Healthcare is projected to grow at a 15.66% CAGR as hospitals digitize their supply chains and patient workflows. NFC wristbands replace barcode bracelets, enabling error-free medication dispensing and faster admissions. Implantable sensor makers are embracing passive NFC for post-surgery data readouts, eliminating the need for battery changes.
Banks continue to replace mag-stripe cards with contactless versions, and this trend is also extending to biometric two-factor cards in several pilot regions. Hospitality utilizes NFC to provide mobile keys, reducing front-desk congestion, while airlines implement bag-tagging trials that enable passengers to self-drop luggage more quickly. Municipal governments embed tags into licences and permits, streamlining on-site verification by field officers. These sectoral overlays widen the revenue matrix beyond retail, insulating suppliers from single-vertical volatility.
Geography Analysis
The Asia-Pacific region leads the Near Field Communication market, accounting for a 37.45% share in 2025 and is estimated to grow at 16.55% CAGR from 2026 to 2031. Mobile-first economies benefit from smartphone penetration exceeding 63% of the population, and mobile services already account for 5.3% of regional GDP. China’s transit operators processed more than 60 billion NFC metro rides in 2024, while India’s Unified Payments Interface saw daily tap-and-pay volumes triple year-on-year. Government e-ID and national health-card schemes further stimulate identity and authentication use cases, helping the region outpace global averages.
Europe sits second in value, thanks to regulatory tailwinds that mandate handset-level NFC openness and promote strong customer authentication. The EU’s Digital Product Passport regulation mandates the use of traceability tags for luxury goods and automotive components, catalyzing a surge in tag supply chain demand. Tokenisation initiatives by card networks aim to eliminate manual card entry by the end of the decade, promising a surge in in-browser tap-to-pay flows. Nordic banks have already achieved 90% market penetration for contactless debit, signaling maturity while still experiencing healthy growth in transaction value.
North America records steady mid-teen growth, buoyed by its rapid roll-out of EV charging infrastructure and enterprise security upgrades. The federal universal plug-and-charge framework, effective 2025, sets a baseline for nationwide interoperability and is expected to lift charger-reader deployments sharply. Manufacturing onshoring programmes and tax credits under the CHIPS Act encourage domestic NFC component fabrication, partly mitigating global supply tightness. Meanwhile, Middle East and Africa exhibit early-stage adoption, constrained by fragmented regulation and lower POS penetration but aided by mobile-money initiatives that prioritise low-cost, secure proximity payments.

Competitive Landscape
The Near Field Communication market shows moderate concentration. NXP Semiconductors, STMicroelectronics, and Infineon Technologies supply the majority of secure elements and NFC controller ICs, leveraging deep IP portfolios and 28 nm process capacity advantages. NXP’s MIFARE DUOX, launched in November 2024, combines asymmetric and symmetric cryptography for EV charging and smart-city credentials, achieving EAL 6+ certification. STMicroelectronics’ October 2024 partnership with Qualcomm embeds AI-enhanced connectivity in STM32 MCUs for low-power IoT nodes. Infineon surpassed 1 billion shipped 28 nm security ICs by early 2025, underscoring throughput scale and long-term customer stickiness.
Asian challengers, including Shanghai Fudan Microelectronics and Huada, are capturing domestic handset sockets by bundling cost-optimised controllers with reader firmware. Healthcare solutions bundle FHIR-compliant data vaults, while automotive stacks add Digital Key Release 3 readiness. Software vendors capture value through token-management platforms and in-app wallet SDKs, a higher-margin layer untouched by silicon incumbents. Foundry diversification and trusted-foundry certification programmes could upend sourcing patterns, favouring suppliers with geopolitical hedging strategies.
Collaborative standardisation remains central. The NFC Forum now counts over 400 members coordinating roadmap alignment across handset OEMs, card networks, silicon makers and service providers. Joint test-tools reduce time-to-market for Release 15 features, helping newer entrants to meet interoperability baselines quickly. Overall, the competitive narrative is shifting from chip-performance races toward ecosystem orchestration, vertical tailoring and lifecycle software monetisation.
Near Field Communication Industry Leaders
NXP Semiconductors
STmicroelectronics N.V.
Texas Instruments Incorporated
Toshiba Electronic Devices & Storage Corporation
Infineon Technologies
- *Disclaimer: Major Players sorted in no particular order


Recent Industry Developments
- June 2025: NFC Forum released NFC Release 15, adding multi-purpose-tap and next-gen security layers.
- May 2025: IDEMIA unveiled full Host Card Emulation for iOS following EU antitrust compliance, enabling banks to launch in-app tap-to-pay.
- December 2024: Infineon approached 1 billion shipments of 28 nm security ICs, highlighting manufacturing scale.
- November 2024: NXP introduced MIFARE DUOX dual-crypto NFC IC with EAL 6+ security for EV charging and smart-city IDs.


Research Methodology Framework and Report Scope
Market Definitions and Key Coverage
Our study defines the near field communication (NFC) market as revenue earned from 13.56 MHz chips, antennas, readers, tags, and licensed software that enable peer-to-peer, read-write, or card-emulation exchanges across smartphones, wearables, payment terminals, vehicles, smart labels, and industrial equipment. We count the embedded parts that ship inside new host hardware and the standalone tags supplied to converters.
Scope exclusion: solutions that rely on QR codes, Bluetooth, ultra-wideband, or closed-loop RFID sit outside this review.
Segmentation Overview
- By Product Type
- NFC Tags
- NFC ICs / Secure Elements
- NFC Readers
- NFC Antennas
- Software and Services
- By Operating Mode
- Read / Write
- Peer-to-Peer
- Card Emulation
- By Application
- Payments
- Access Control
- Pairing and Commissioning
- Identity and Authentication
- Smart Posters and Marketing
- Other Applications
- By End-Device
- Smartphones
- Wearables
- PCs and Other Consumer Electronics
- Medical Equipment
- Automotive Infotainment / EV Chargers
- Other End-Devices
- By End-User Vertical
- BFSI
- IT and Telecommunications
- Retail and e-Commerce
- Healthcare
- Hospitality and Transportation
- Government and Public Sector
- By Geography
- North America
- United States
- Canada
- Mexico
- South America
- Brazil
- Argentina
- Rest of South America
- Europe
- United Kingdom
- Germany
- France
- Italy
- Spain
- Rest of Europe
- Asia-Pacific
- China
- India
- Japan
- South Korea
- ASEAN
- Rest of Asia-Pacific
- Middle East and Africa
- Middle East
- Saudi Arabia
- United Arab Emirates
- Rest of Middle East
- Africa
- South Africa
- Nigeria
- Rest of Africa
- Middle East
- North America
Detailed Research Methodology and Data Validation
Primary Research
We then spoke with chip designers, smartphone product leads, payment-scheme experts, and packaging converters across Asia-Pacific, North America, and Europe. Their feedback confirmed attach rates, price erosion, and new uses such as EV plug-and-charge and digital product passports.
Desk Research
Mordor analysts first joined tier-1 datasets such as GSMA handset stock, European Central Bank contactless volumes, ITC COMTRADE export codes, and NFC Forum technical papers with company filings and news gathered through Dow Jones Factiva to plot supply and price curves. Insights from the Smart Payment Association, Questel patent scans, transit ridership data, and tender records on Tenders Info deepened context. This list is illustrative, and many other open sources informed our desk work.
Market-Sizing & Forecasting
Our model starts top down. Annual shipments of smartphones, wearables, point-of-sale terminals, and transit tickets are multiplied by verified NFC penetration and balanced with customs exports to rebuild 2024-2025 demand. Targeted bottom-up checks that roll up supplier revenue and sample tag price multiplied by volume realign totals when variance tops five percent. Key drivers include smartphone output, contactless transaction counts, tag price curves, reader rollouts, and wallet-opening rules; these feed a multivariate regression that projects value through 2030.
Data Validation & Update Cycle
Outputs clear automated variance flags, a senior analyst audit, and cross-practice peer review before release. We refresh each year and issue interim updates when chip shortages, regulations, or mergers shift fundamentals.
Why Our Near Field Communication Market Baseline Commands Reliability
Published values often diverge. According to Mordor Intelligence, gaps usually stem from scope choice, pricing logic, and refresh cadence. Studies that count only IC sales or extend early-COVID assumptions land far from our balanced view.
Benchmark comparison
| Market Size | Anonymized source | Primary gap driver |
|---|---|---|
| USD 32.35 B (2025) | Mordor Intelligence | - |
| USD 21.69 B (2024) | Global Consultancy A | Tracks IC revenue only and uses flat prices |
| USD 30.85 B (2024) | Industry Journal B | Relies on linear extrapolation and bi-annual refresh |
| USD 34.09 B (2025) | Regional Consultancy C | Omits reader software and runs limited field work |
These comparisons show that our disciplined scope, fresh interviews, and yearly updates give decision-makers a transparent and repeatable baseline they can trust.


Key Questions Answered in the Report
What is the projected growth rate of the Near Field Communication market?
The Near Field Communication market is forecast to expand at a 15.22% CAGR between 2026 and 2031.
Which region will contribute most to future NFC revenue?
Asia Pacific leads with 37.45% share in 2025 and is expected to grow at a 16.55% CAGR, driven by widespread mobile-wallet usage and supportive regulation.
Which application segment is growing fastest?
Identity and authentication is the fastest-growing application, advancing at 15.79% CAGR as enterprises and governments adopt NFC for secure access, digital IDs and EV charging authorisation.
Why is card emulation mode gaining momentum?
Open access to handset NFC, especially on iOS, and rising mobile-payment adoption are propelling card emulation mode, which is forecast to grow 16.78% annually through 2031.
How are EVs influencing NFC adoption?
A national plug-and-charge framework launching in 2025 leverages NFC to enable seamless vehicle-to-charger authentication, driving demand for high-security NFC controllers in automotive and energy infrastructure.
Page last updated on:


