Harmonic Filter Market Size and Share
Market Overview
| Study Period | 2019 - 2030 |
|---|---|
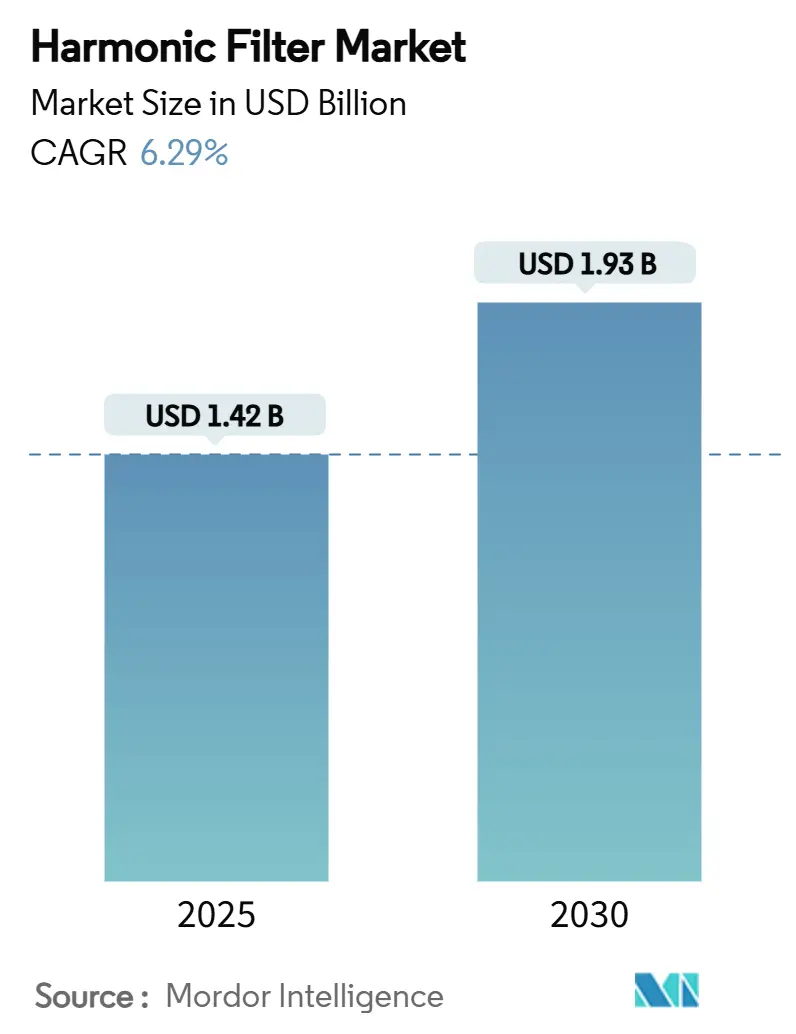
| Market Size (2025) | USD 1.42 Billion |
| Market Size (2030) | USD 1.93 Billion |
| Growth Rate (2025 - 2030) | 6.29% CAGR |
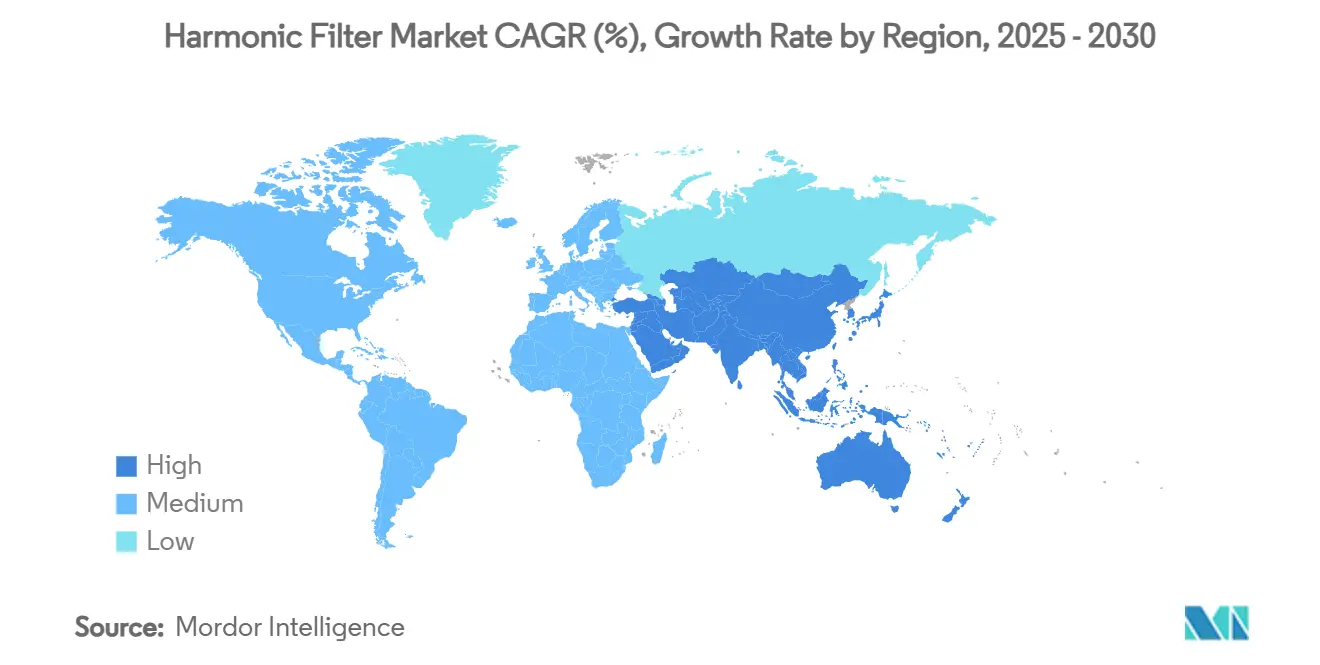
| Fastest Growing Market | Middle East |
| Largest Market | Asia Pacific |
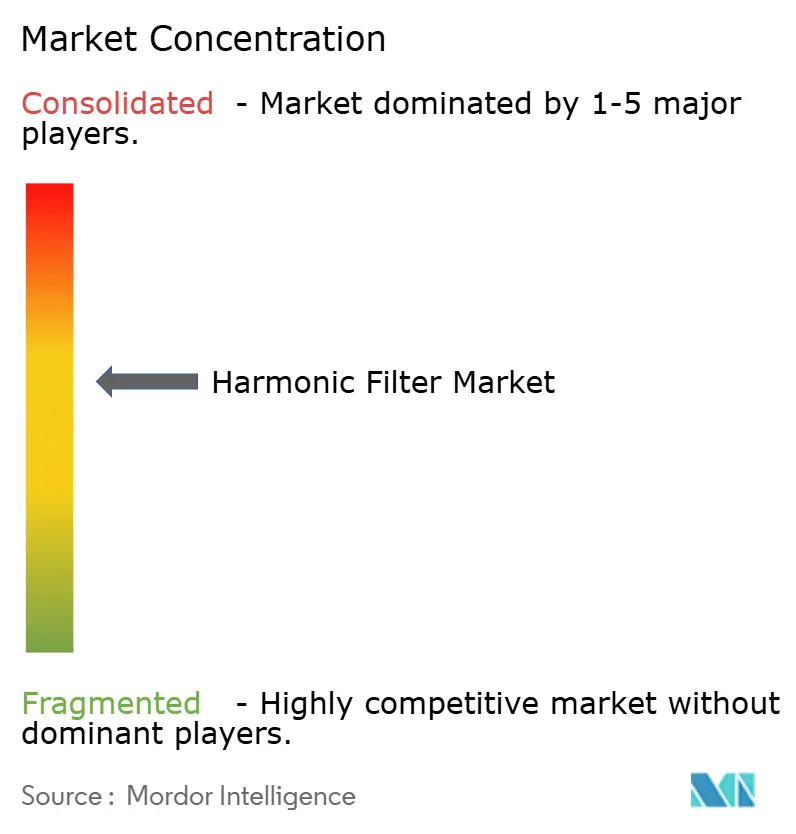
| Market Concentration | Medium |
Major Players *Disclaimer: Major Players sorted in no particular order Image © Mordor Intelligence. Reuse requires attribution under CC BY 4.0. | |
Harmonic Filter Market Analysis by Mordor Intelligence
The harmonic filter market size stood at USD 1.42 billion in 2025 and is projected to reach USD 1.93 billion by 2030, advancing at a 6.29% CAGR over 2025-2030. Growing adoption of variable-frequency drives (VFDs), the rapid build-out of hyperscale data centres and ongoing rail-electrification programmes keep demand resilient even when capital budgets tighten.[1]U.S. Department of Energy, “AMMTO WBG Power Electronics Strategic Framework,” Energy.gov, January 2025, energy.gov Utilities in North America, Europe and China have tightened grid codes, making harmonic mitigation a mandatory rather than discretionary expenditure and sustaining replacement cycles for both active and passive filters. At the same time, the penetration of wide-bandgap semiconductors such as SiC and GaN is shrinking form-factors and improving efficiency, opening retrofit opportunities in space-constrained industrial premises.
Key Report Takeaways
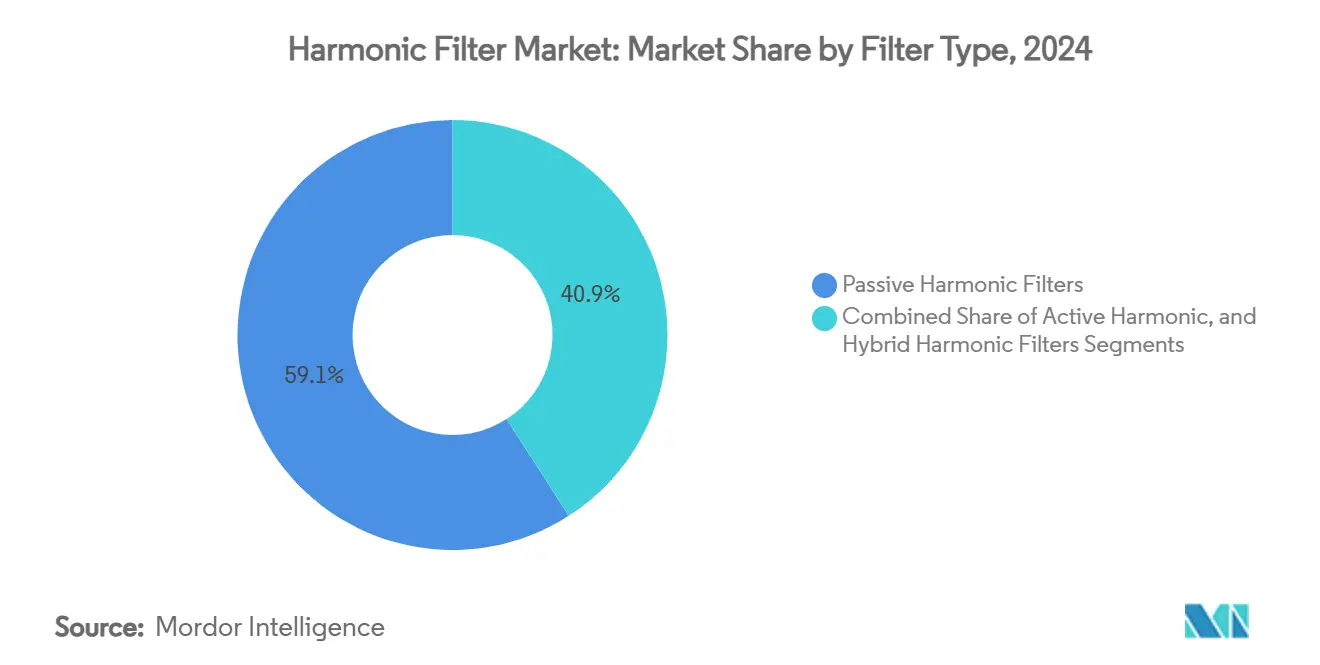
- By filter type, passive solutions accounted for 59.1% of the harmonic filter market share in 2024, while active products are forecast to grow at a 6.7% CAGR through 2030.
- By phase, three-phase units dominated with 81.8% revenue share in 2024; single-phase devices are expected to expand at a 6.3% CAGR to 2030.
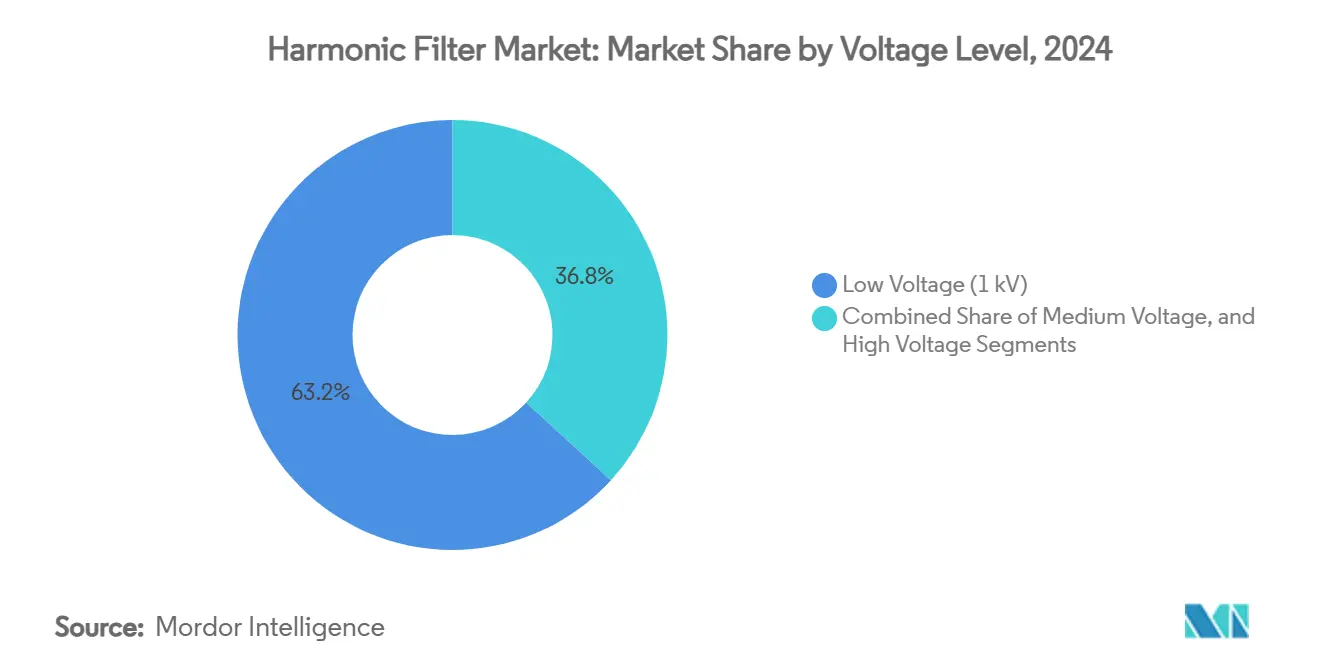
- By voltage level, low-voltage systems captured 63.2% share of the harmonic filter market size in 2024; medium-voltage solutions are set to advance at a 7.4% CAGR between 2025 and 2030.
- By end-user, industrial facilities held 45.9% of the harmonic filter market size in 2024, whereas data centres are projected to post a 7.0% CAGR through 2030.
- By geography, APAC led with 38.1% revenue share in 2024, while the Middle East is poised to log a 7.3% CAGR up to 2030.
Global Harmonic Filter Market Trends and Insights
Drivers Impact Analysis*
| Driver | (~) % Impact on CAGR Forecast | Geographic Relevance | Impact Timeline |
|---|---|---|---|
| Grid-code tightening in OECD and China | +1.2% | OECD, China, spill-over to emerging markets | Short term (less than or equal to 2 years) |
| Surge in variable-frequency drive installations | +1.8% | Global industrial hubs | Medium term (2 to 4 years) |
| Data-centre power-quality mandates | +1.1% | North America, Europe, Asia-Pacific | Medium term (2 to 4 years) |
| Electrified rail upgrade programmes | +0.7% | Europe, China, selective North American corridors | Long term (4 years or more) |
| Wide-bandgap semiconductor adoption | +0.9% | Global, early automotive and renewables | Long term (4 years or more) |
| On-site renewable-plus-storage micro-grids | +0.6% | Distributed-energy markets worldwide | Long term (4 years or more) |
| Source: Mordor Intelligence | |||
Grid-code tightening in OECD and China
OECD regulators have upgraded IEEE 519 from a recommended practice to an enforceable limit, obliging utilities and large power users to install harmonic mitigation or face non-compliance penalties. China has mirrored the shift with its own, stricter interconnection codes, while IEC 61000-3-12:2021 introduced tighter limits for currents above 16 A in Europe.[2]International Electrotechnical Commission, “IEC 61000-3-12:2021,” IEC Webstore, January 2025, iec.ch These mandates expand addressable demand because mitigation elements become integral to plant design rather than discretionary upgrades.
Surge in variable-frequency drive installations
VFD penetration in HVAC, water treatment and manufacturing lines is escalating as factories chase energy-efficiency targets, yet six-pulse rectifiers in VFDs can push total harmonic distortion (THD) to 40% unless treated. The cumulative THD from multiple drives raises resonance risk, encouraging procurement teams to specify active filters for new build and expansion projects.[3]Eaton Corporation, “VFD Harmonics Mitigation,” Eaton, January 2025, eaton.com
Data-centre power-quality mandates
Hyperscale operators increasingly mandate THD less than 5% because harmonic events trigger server reboots, cooling inefficiencies, and potential service-level breaches. With 14,338 MW of new capacity under construction in APAC alone, power-quality specifications are now embedded in design-build RFPs, notably calling for real-time active filters.
Electrified rail upgrade programmes
European and Chinese rail operators deploy harmonic filters to protect signalling circuits from distortion generated by regenerative braking and high-power traction drives.[4]U.S. Department of Transportation, “Rail Electrification Options,” FRA, January 13, 2025, railroads.dot.gov As lines modernise, multi-system locomotives work across 15 kV, 25 kV and 50 Hz networks, increasing the need for bidirectional filtering designs that accommodate regenerative power flow.
Restraints Impact Analysis*
| Restraint | (~) % Impact on CAGR Forecast | Geographic Relevance | Impact Timeline |
|---|---|---|---|
| High capex versus alternative mitigation | -0.8% | Cost-sensitive emerging markets | Short term (less than or equal to 2 years) |
| Technical talent scarcity for commissioning | -0.5% | Global, acute in developing regions | Medium term (2 to 4 years) |
| Un-harmonised global testing standards | -0.3% | Cross-border equipment deployment | Long term (4 years or more) |
| OEM warranty ambiguities for retrofit installs | -0.2% | Mature markets with ageing infrastructure | Medium term (2 to 4 years) |
| Source: Mordor Intelligence | |||
High capex vs. alternative mitigation
Active filters often cost 10–20% more than passive units and require specialised commissioning, so budget-constrained facilities fall back on reactors or 12-pulse drives that capture only part of the THD spectrum. Payback can be opaque because benefits show up as avoided downtime rather than new revenue, impeding investment decisions.
Technical talent scarcity for commissioning
Harmonic analysis blends power-system simulation with frequency-domain expertise, yet electrical-maintenance teams are rarely trained in these areas. Multinational OEMs report delayed project hand-over in Latin America and parts of Southeast Asia due to shortage of certified commissioning engineers, curbing near-term market growth.
*Our forecasts treat driver/restraint impacts as directional, not additive. The impact forecasts reflect baseline growth, mix effects, and variable interactions.
Segment Analysis
By Filter Type: Active Solutions Gain Momentum
By filter type, passive solutions commanded 59.1% revenue share in 2024. The segment generated the largest slice of the harmonic filter market size in 2024 through passive products, yet active filters’ 6.7% CAGR indicates a pivot toward dynamic compensation capabilities. Industries installing numerous drives within compact floor areas choose active designs that hold THD below 5% under fluctuating loads while passive counterparts risk detuning when system impedance varies. Hybrid architectures combine low-order passive and high-order active stages to balance cost with performance, an approach gaining traction in semiconductor fabs and large commercial towers.
Continuous shrinkage in SiC device prices narrows the cost gap, allowing OEMs to introduce rack-mount active filters rated up to 120 A that fit server closets, a form factor unthinkable five years ago. Suppliers now embed IoT diagnostics that stream harmonic spectra to cloud dashboards, helping maintenance teams anticipate capacitor ageing or controller faults and curbing unplanned downtime.


By Phase: Three-Phase Dominance Continues
Three-phase equipment retained 81.8% of the harmonic filter market share in 2024 because industrial drives, elevators and chiller compressors operate on three-wire systems carrying higher currents. As VFD horsepower ratings climb above 500 HP, harmonic currents migrate into positive, negative and zero-sequence components, prompting facility managers to favour three-phase filters capable of mitigating all sequences concurrently.
Single-phase growth nevertheless rises at a 6.3% CAGR, aided by LED lighting retrofits and residential solar inverters installing low-kVA filters to curb neutral-to-earth voltage. Unbalanced load conditions in data centres, where single-phase IT racks draw from three-phase busways, also create pockets of demand for specialised zig-zag filtering arrangements.
By Voltage Level: Medium-Voltage Growth Accelerates
Low-voltage assemblies below 1 kV accounted for 63.2% share in 2024 because most building equipment connects at 480 V or 400 V. Medium-voltage assets between 1 kV and 35 kV, however, post the highest 7.4% CAGR as arc furnaces, mine hoists and high-power pump drives migrate to 6 kV and 11 kV feeders for efficiency, necessitating filters that withstand higher fault levels.
The Digital-Substation trend in utilities also drives medium-voltage demand: STATCOMs and battery-energy-storage systems inject switching-frequency harmonics into 13.8 kV feeders, prompting distribution companies to specify air-insulated filter cubicles with remote monitoring.
By End-User Industry: Data Centres Drive Growth
Industrial plants held 45.9% of the harmonic filter market size in 2024 thanks to legacy heavy-duty loads such as rolling mills and cement kilns. Oil-and-gas upstream operators deploy filters on pump jacks and compressors to prevent THD-induced overheating, while water-treatment utilities protect SCADA electronics from resonance.
Data centres are the fastest-expanding application at a 7.0% CAGR as hyperscale operators target continuous power uptime. Cloud providers require active mitigation on both input feeders and UPS outputs to ensure compliance with emerging ISO/IEC guidelines covering equipment immunity to voltage distortion. Hospitals follow a similar trajectory as diagnostic imaging and surgical robots necessitate clean power to safeguard patient safety, leading engineering-procurement-construction (EPC) firms to include harmonic studies in base-build specifications.
Geography Analysis
APAC contributed 38.1% of the global revenue in 2024, reflecting China’s manufacturing heft and India’s smart-city roll-outs. Regional policies promoting 800 GW of new renewable capacity by 2030 multiply harmonic sources on distribution feeders, encouraging grid operators to standardise filter designs in interconnection codes. Japan and South Korea bolster demand through rigorous factory-automation upgrades that elevate power-quality standards.
North America benefits from the world’s largest data-centre cluster, concentrated in the United States’ Northern Virginia, Dallas and Phoenix corridors. Hyperscale builders integrate active filters upstream of UPS strings to prevent trip-lenient events. A wave of reshoring in discrete manufacturing revives demand for low-voltage passive units, while micro-grid pilots adopt hybrid filters to manage bidirectional energy flow. Schneider Electric’s pledge to invest USD 700 million in domestic production through 2027 underscores confidence in long-term market demand.
The Middle East leads growth at a 7.3% CAGR, propelled by economic diversification in Saudi Arabia and the United Arab Emirates. Megaprojects such as NEOM and hyperscale cloud zones in Riyadh mandate stringent power-quality specifications, creating a pipeline for medium-voltage filters rated 24 kV. Regional utilities have started introducing incentive tariffs linked to THD compliance, accelerating adoption among industrial offtakers.

Competitive Landscape
The market is moderately consolidated, with ABB, Schneider Electric, and Siemens holding entrenched channels across utilities and OEMs while smaller specialists differentiate on software-driven controllers. ABB’s USD 120 million U.S. expansion enlarges capacity for low-voltage filters to serve data-centre EPCs. Schneider’s multi-year domestic investment aims to de-risk supply chains and cater to Buy-American preferences among federal-funded infrastructure projects.
Technology roadmaps focus on integrating edge analytics that predict capacitor end-of-life and automatically retune notch frequencies, capabilities demonstrated in Schaffner’s FN3540 platform. The entrance of wide-bandgap semiconductor suppliers is reshaping value pools as filter makers vertically integrate to secure device supply.
Merger and Acquisitions remains an avenue for portfolio expansion. ABB’s planned acquisition of Siemens Gamesa’s power-electronics unit will inject traction-converter expertise and help optimise filters for regenerative rail applications. Littelfuse widened its industrial footprint by focusing on electronics-grade passive elements, building cross-selling synergies with its surge-protection lines.
Harmonic Filter Industry Leaders
ABB Ltd.
Schneider Electric SE
Siemens AG
Eaton Corporation plc
Schaffner Holding AG
- *Disclaimer: Major Players sorted in no particular order

Recent Industry Developments
- July 2025: ABB reported record Q2 2025 orders of USD 9.8 billion, citing strong electrification demand that includes power-quality products. The step-up in backlog signals continued volume support for harmonic filters while providing scale for SiC-based controller roll-outs.
- May 2025: Littelfuse posted Q1 2025 revenue of USD 554 million, up 4%, buoyed by electronics and industrial segments. Management highlighted design wins for high-frequency EMI components that form the front-end of active harmonic filters, illustrating component suppliers’ strategic move into the value chain.
- March 2025: Schneider Electric announced a USD 700 million capacity expansion across five U.S. plants to shorten lead times for low-voltage switchgear and active filters. The strategy targets utility-scale data-centre campuses eligible for federal tax incentives tied to domestic content.
- December 2024: ABB agreed to acquire Siemens Gamesa’s power-electronics business to strengthen its high-density conversion and harmonic-filtering capabilities.


Global Harmonic Filter Market Report Scope
The Harmonic Filter Market Report is Segmented by Filter Type (Active, Passive, Hybrid), Phase (Single-Phase, Three-Phase), Voltage Level (Low <1kV, Medium 1-35kV, High >35kV), End-User Industry (Industrial, Commercial, Utilities and Power Generation, Transportation), and Geography (North America, South America, Europe, Asia-Pacific, Middle East and Africa). The Market Forecasts are Provided in Terms of Value (USD).
| Active Harmonic Filters |
| Passive Harmonic Filters |
| Hybrid Harmonic Filters |
| Single-Phase |
| Three-Phase |
| Low Voltage (Less than 1 kV) |
| Medium Voltage (1-35 kV) |
| High Voltage (Above 35 kV) |
| Industrial | Oil and Gas |
| Metals and Mining | |
| Pulp and Paper | |
| Water and Wastewater | |
| Chemicals | |
| Other Process Industries | |
| Commercial | Data Centers |
| Commercial Buildings | |
| Hospitals | |
| Utilities and Power Generation | |
| Transportation | Rail Traction |
| Marine Vessels |
| North America | United States | |
| Canada | ||
| Mexico | ||
| South America | Brazil | |
| Argentina | ||
| Rest of South America | ||
| Europe | Germany | |
| United Kingdom | ||
| France | ||
| Italy | ||
| Spain | ||
| Rest of Europe | ||
| Asia Pacific | China | |
| India | ||
| Japan | ||
| South Korea | ||
| Australia | ||
| Rest of Asia Pacific | ||
| Middle East and Africa | Middle East | Saudi Arabia |
| United Arab Emirates | ||
| Turkey | ||
| Rest of the Middle East | ||
| Africa | South Africa | |
| Nigeria | ||
| Rest of Africa | ||
| By Filter Type | Active Harmonic Filters | ||
| Passive Harmonic Filters | |||
| Hybrid Harmonic Filters | |||
| By Phase | Single-Phase | ||
| Three-Phase | |||
| By Voltage Level | Low Voltage (Less than 1 kV) | ||
| Medium Voltage (1-35 kV) | |||
| High Voltage (Above 35 kV) | |||
| By End-User Industry | Industrial | Oil and Gas | |
| Metals and Mining | |||
| Pulp and Paper | |||
| Water and Wastewater | |||
| Chemicals | |||
| Other Process Industries | |||
| Commercial | Data Centers | ||
| Commercial Buildings | |||
| Hospitals | |||
| Utilities and Power Generation | |||
| Transportation | Rail Traction | ||
| Marine Vessels | |||
| By Geography | North America | United States | |
| Canada | |||
| Mexico | |||
| South America | Brazil | ||
| Argentina | |||
| Rest of South America | |||
| Europe | Germany | ||
| United Kingdom | |||
| France | |||
| Italy | |||
| Spain | |||
| Rest of Europe | |||
| Asia Pacific | China | ||
| India | |||
| Japan | |||
| South Korea | |||
| Australia | |||
| Rest of Asia Pacific | |||
| Middle East and Africa | Middle East | Saudi Arabia | |
| United Arab Emirates | |||
| Turkey | |||
| Rest of the Middle East | |||
| Africa | South Africa | ||
| Nigeria | |||
| Rest of Africa | |||


Key Questions Answered in the Report
What is the current size of the harmonic filter market?
The harmonic filter market size reached USD 1.42 billion in 2025 and is forecast to hit USD 1.93 billion by 2030.
Which region leads the harmonic filter market?
APAC held the largest share at 38.1% in 2024 owing to rapid industrialisation and renewable-energy expansion.
Why are active harmonic filters growing faster than passive units?
Active filters provide real-time compensation under varying load conditions, ideal for facilities with fluctuating VFD demand and strict THD limits.
What end-user segment is expanding quickest?
Data centres are the fastest-growing end-user, expected to register a 7.0% CAGR through 2030 due to hyperscale build-outs and AI workloads.
Page last updated on:


