
Privacy Filters Market Size and Share
Market Overview
| Study Period | 2020 - 2031 |
|---|---|
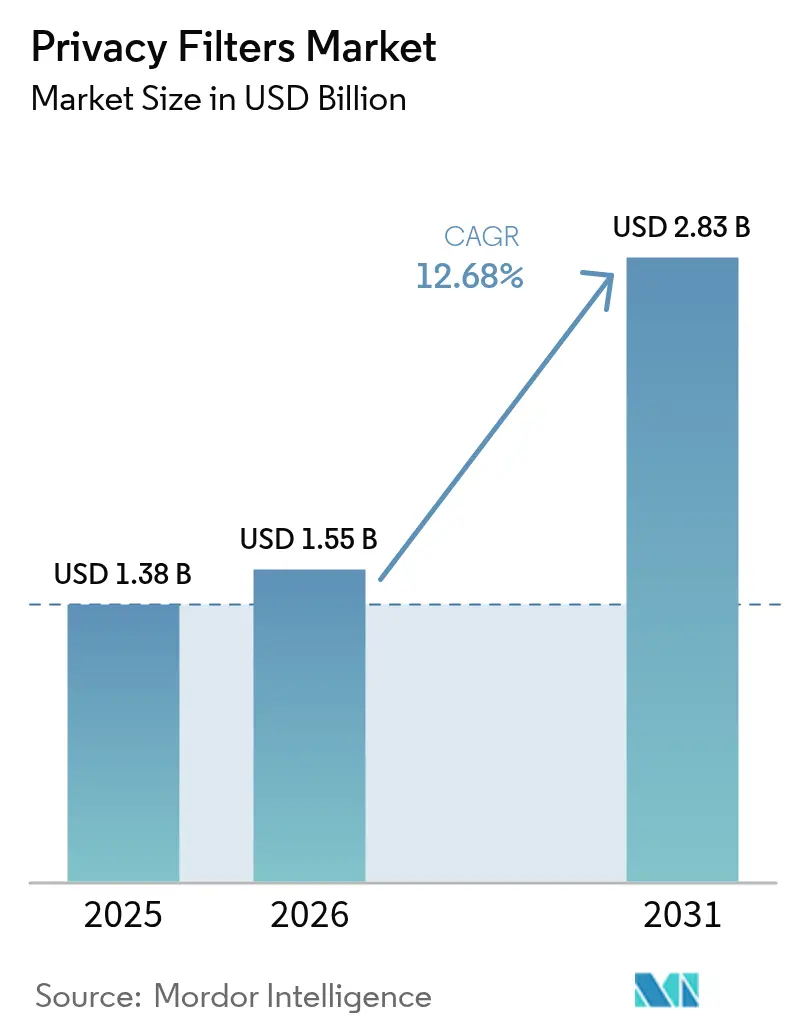
| Market Size (2026) | USD 1.55 Billion |
| Market Size (2031) | USD 2.83 Billion |
| Growth Rate (2026 - 2031) | 12.68 % |
| Fastest Growing Market | Asia Pacific |
| Largest Market | North America |
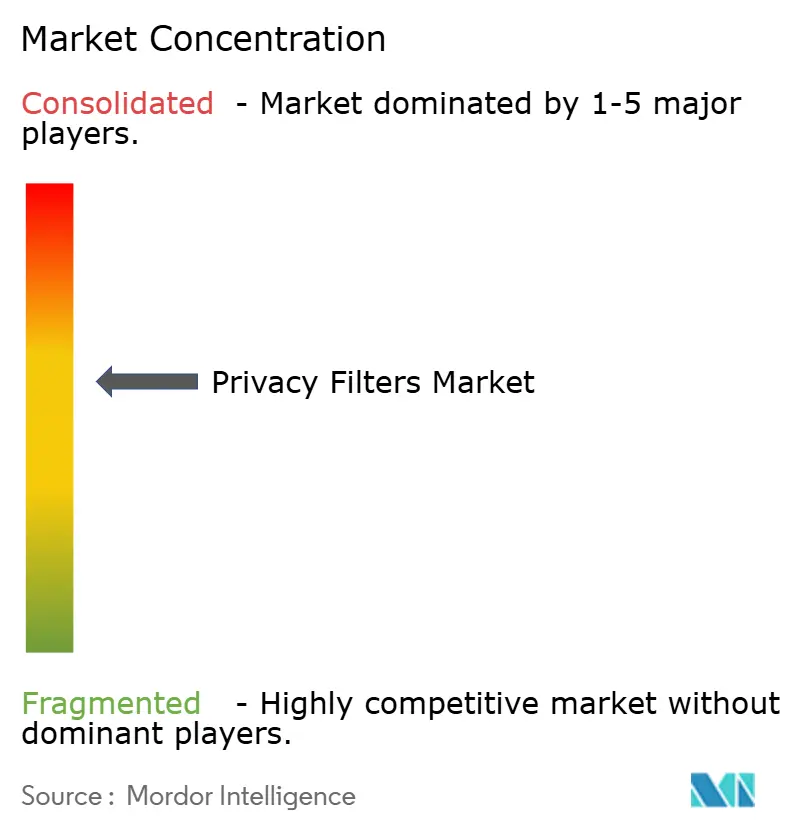
| Market Concentration | Medium |
Major Players *Disclaimer: Major Players sorted in no particular order Image © Mordor Intelligence. Reuse requires attribution under CC BY 4.0. | |
Privacy Filters Market Analysis by Mordor Intelligence
The privacy filters market size is expected to grow from USD 1.38 billion in 2025 to USD 1.55 billion in 2026 and is forecast to reach USD 2.83 billion by 2031 at 12.68% CAGR over 2026-2031. Heightened regulatory scrutiny, increasing adoption of hybrid work, and stable commercial device shipments are converging to shift privacy filters from optional accessories to mandated controls in corporate governance frameworks. Enterprises now view visual data leakage as a compliance breach that can result in fines, reputational damage, and contract penalties. Healthcare upgrades to electronic health-record workstations, defense interest in switchable electrochromic panels, and original equipment manufacturer (OEM) integration strategies further expand the privacy filters market by embedding optical security at the hardware level. Competitive positioning favors brands with proprietary microlouver or nanostructure film expertise; however, regional fragmentation persists, as online marketplaces enable low-cost entrants.
Key Report Takeaways
- By product type, 2-way privacy filters captured a 49.10% market share of the privacy filters market in 2025, whereas 4-way privacy solutions are expected to advance at a 13.54% CAGR through 2031.
- By material technology, microlouver film filters captured a 60.73% market share of the privacy filters market in 2025, whereas Nanotechnology-Based Filters are expected to advance at a 13.35% CAGR through 2031.
- By device size, the 15-24 inch screens category accounted for a 54.20% market share of the privacy filters market in 2025, and screens above 24 inches screens are expected to expand at a 13.28% CAGR through 2031.
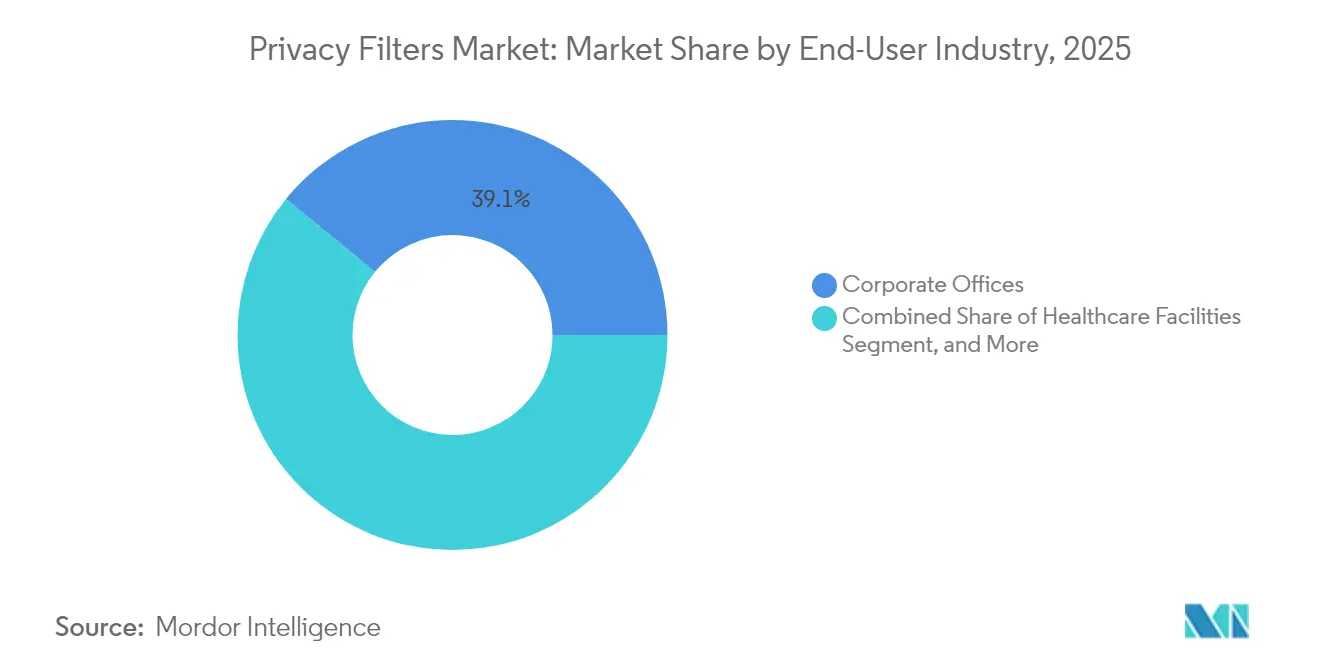
- By end-user industry, corporate offices led with 39.10% market share of the privacy filters market in 2025, while healthcare facilities are forecast to post a 13.58% CAGR through 2031.
- By distribution channel, online retail held a 45.00% market share of the privacy filters market in 2025; however, direct OEM integration is projected to grow at a 13.18% CAGR through 2031.
- By geography, North America captured a 33.20% market share of the privacy filters market in 2025, whereas the Asia Pacific is expected to advance at a 13.62% CAGR through 2031.
Note: Market size and forecast figures in this report are generated using Mordor Intelligence’s proprietary estimation framework, updated with the latest available data and insights as of 2026.
Market Trends and Insights
Drivers Impact Analysis of Privacy Filters Market*
| Driver | (~) % Impact on CAGR Forecast | Geographic Relevance | Impact Timeline |
|---|---|---|---|
| Growing Data Privacy Regulations in Corporate Environments | +2.8% | Global, with enforcement concentration in North America and EU | Medium term (2-4 years) |
| Rising Remote and Hybrid Working Trends | +2.3% | Global, particularly North America, Europe, and urban Asia-Pacific | Short term (≤ 2 years) |
| Increasing Laptop and Tablet Shipments Globally | +1.9% | Global, with commercial segment growth in Asia-Pacific and North America | Medium term (2-4 years) |
| Expanding Healthcare IT Investments | +1.7% | North America and Europe core, spillover to Middle East and Asia-Pacific | Medium term (2-4 years) |
| Integration of Privacy Filters into OEM Display Manufacturing Lines | +1.4% | Global, led by manufacturing hubs in China, Taiwan, South Korea | Long term (≥ 4 years) |
| Adoption of Smart Electrochromic Privacy Technologies for Defense Applications | +1.2% | North America, Europe, Middle East defense sectors | Long term (≥ 4 years) |
| Source: Mordor Intelligence | |||


Growing Data Privacy Regulations in Corporate Environments
European Union regulators imposed fines of EUR 4.1 billion (USD 4.4 billion) in 2024 for GDPR violations, with 18% of cases involving visual data exposure. The U.S. Federal Trade Commission revised the Gramm-Leach-Bliley Safeguards Rule to require documented controls against screen eavesdropping.[1]Federal Trade Commission, “FTC Announces Final Amendments to Safeguards Rule,” ftc.gov Canada, Mexico, and UAE authorities enacted parallel mandates, prompting multinational firms to adopt privacy filters across global offices for audit uniformity. Procurement teams now list optical screens alongside encryption and multifactor authentication in security budgets. This regulatory alignment keeps the privacy filters market on a steep adoption curve as fines escalate and audit cycles shorten.
Rising Remote and Hybrid Working Trends
Hybrid work blurs the perimeter; employees handle sensitive data in cafes, on trains, and in shared spaces. Screen exposure in public venues heightens the risk, yet only one-third of employers supply visual privacy accessories, creating a secondary demand wave from staff who self-purchase. Online retail fulfills these fragmented orders, sustaining 45.63% channel share in 2024. Airlines, rail operators, and hospitality chains have begun adding embedded privacy panels to seat-backs and lobby kiosks, demonstrating how mobility expands the privacy filters market beyond the traditional desk environment.
Increasing Laptop and Tablet Shipments Globally
Commercial laptop refreshes stabilized in 2024, with a 3% uptick in enterprise procurement despite softer consumer sales. Each new corporate device typically ships with a security toolkit that now includes a privacy screen, turning hardware lifecycle management into a recurring revenue engine for aftermarket vendors. Tablets used in healthcare, retail, and field services are increasingly specifying touch-screen-compatible privacy films to comply with data-use policies defined in sector guidelines issued by the HHS in 2024.[2]U.S. Department of Health and Human Services, “HIPAA Security Rule Guidance,” hhs.gov Penetration in emerging economies remains low, positioning Asia-Pacific and Latin America as greenfield territories once local data-protection acts mature.
Expanding Healthcare IT Investments
Hospitals invested USD 224 billion in IT in 2024, funding the expansion of electronic health records, telehealth, and cybersecurity upgrades. HIPAA technical-safeguard guidance explicitly calls for workstation privacy in shared clinical zones. Procurement managers now bundle privacy filters with endpoint-security suites, replacing ad-hoc buys with multiyear service contracts that cover installation, screen calibration, and lifecycle recycling. Aging populations in North America, Europe, and East Asia are driving the construction of new clinics that incorporate privacy screens at the blueprint stage, solidifying healthcare as the fastest-growing vertical in the privacy filters market.
Restraints Impact Analysis of Privacy Filters Market*
| Restraint | (~) % Impact on CAGR Forecast | Geographic Relevance | Impact Timeline |
|---|---|---|---|
| Declining Desktop Monitor Refresh Cycles in Developed Markets | -1.6% | North America and Western Europe | Short term (≤ 2 years) |
| Price Sensitivity Among Consumer Buyers | -1.3% | Global, acute in price-conscious markets of South Asia, Africa, Latin America | Short term (≤ 2 years) |
| Compatibility Challenges with Curved and Foldable Displays | -0.9% | Global, concentrated in premium consumer segments | Medium term (2-4 years) |
| Environmental Concerns Over Disposal of Polycarbonate-Based Filters | -0.7% | Europe and North America, emerging in Asia-Pacific | Long term (≥ 4 years) |
| Source: Mordor Intelligence | |||
Declining Desktop Monitor Refresh Cycles in Developed Markets
Extended monitor lifespans cut replacement-trigger events that historically drove privacy-filter sales, especially for screens larger than 24 inches. Organizations prioritizing laptops for mobile teams defer desktop rollouts, shrinking the immediate addressable base. Vendors respond with retrofit kits and magnetic frames aimed at aging fleets; however, the structural tilt toward mobile devices tempers growth in the legacy segment of the privacy filter market.
Price Sensitivity Among Consumer Buyers
E-commerce marketplaces showcase generic privacy screens priced up to 60% below premium brands, eroding margins and diluting differentiation. Budget-focused shoppers rarely value antimicrobial coatings, ISO ergonomic certification, or extended warranties. This dynamic forces established vendors to emphasize enterprise and healthcare accounts while trimming consumer SKU counts. Persistent cost competition is expected to weigh on average selling prices even as unit volumes rise.
*Our forecasts treat driver/restraint impacts as directional, not additive. The impact forecasts reflect baseline growth, mix effects, and variable interactions.
Privacy Filters Market Segment Analysis
By Product Type:
4-Way Filters Accelerate in Collaborative Spaces4-way designs enable omnidirectional shielding, meeting the demands of open-plan offices, trading floors, and public kiosks. The privacy filters market size for 4-way products is poised to expand rapidly because viewing angles from all sides require protection. In 2025, two-way models still accounted for 49.10% of revenue, yet their dominance is waning as hot desking grows. Vendors differentiate through touch-screen compatibility and blue-light reduction coatings that preserve image brightness while meeting ergonomic norms.
Electrochromic implementations, though currently niche, reduce attachment friction and support instant toggling between collaboration and privacy modes. The defense and finance sectors are early adopters, validating premium price points that reach three times the cost of conventional units. As OEMs embed microlouver or electrochromic layers at panel assembly, aftermarket clip-on demand is expected to shift toward specialized use cases rather than broad fleet coverage, reshaping future channel mix in the privacy filters market.



By Material Technology:
Nanostructures Challenge Microlouver LeadershipMicrolouver film, underpinned by 3M’s proprietary light-control technology, captured 60.73% revenue in 2025. It remains the benchmark for clarity versus the trade-off of dimming. However, nanostructure metasurfaces demonstrated 30% thickness reduction while sustaining contrast, an advantage for ultrathin laptops and foldables. Nanotech adoption, with a forecast near 13.35% CAGR, promises lighter devices and simplified recycling pathways, addressing polycarbonate waste concerns highlighted in the EU Circular Economy Action Plan.
Electrochromic polymers introduce dynamic opacity control but also pose disposal issues related to circuitry. Material selection now intertwines with environmental policy; bio-based polycarbonates are attracting European buyers seeking to comply with extended producer responsibility directives. Such shifts create opportunities for upstream partnerships between optical-film makers and display fabs, anchoring long-term supply agreements that stabilize component pricing across the privacy filter market.
By Device Size:
Large-Format Adoption Mirrors Multi-Monitor WorkflowsThe privacy filter market share for 15-24 inch screens stood at 54.20% in 2025, reflecting the prevalence of laptops and standard desktops. Yet ultra-wide and curved panels above 24 inches will outpace overall growth at a 13.28% CAGR as engineers, traders, and creatives demand expansive canvases. Magnetic rail systems and modular panels now accommodate exotic ratios of 21:9 and 32:9 without adhesive residue.
Below-15-inch tablets and convertibles face commoditization, but rugged healthcare and field-service tablets typically incorporate integrated privacy layers as part of their IP65 builds. ISO 9241-305 updates on character legibility require careful luminance tuning; excessive dimming increases the risk of eye strain. Vendors with in-house optical labs retain an edge by calibrating filters to maintain brightness on high-nit HDR monitors while still achieving 30-degree viewing cutoffs, underscoring performance variability across the privacy filters market.
By End-User Industry:
Healthcare Leads Compliance-Driven ExpansionHospital systems accelerated buying after HHS clarified HIPAA workstation safeguards, making privacy screens a checklist item during EHR upgrades. Consequently, healthcare’s 13.58% projected CAGR outpaces corporate office renewals. Financial services maintain baseline demand due to Gramm-Leach-Bliley controls, while the government pilots electrochromic displays for classified workflows.
Educational institutions often adopt filters in testing centers and libraries, but they frequently face budget constraints. Corporate deployments remain the largest segment due to the sheer scale of the workforce, yet future momentum is tilting toward regulated verticals that cannot defer compliance investments. The shift underscores how legislation reshapes spending priorities, reinforcing the centrality of healthcare to the privacy filters market.
By Distribution Channel:
OEM Integration Redefines Delivery ModelsOnline retail continues to hold the highest transaction volume due to its convenience and price transparency. Yet direct OEM integration, tracking a 13.18% CAGR, positions embedded privacy as a premium upsell. HP’s Sure View, Lenovo’s ThinkShutter, and Dell’s built-in microlouver monitors allow for software toggles, eliminating the need for clip-on solutions.
Offline retail continues to serve immediate-need purchases but faces shrinking foot traffic. Managed service providers bundle filters with fleet rollouts, consolidating procurement and securing multiyear maintenance revenue. As embedded solutions mature and cost differentials narrow, aftermarket accessories will shift toward replacement parts, niche devices, and specialized coatings, altering the competitive landscape within the privacy filter market.
Geography Analysis
North America Privacy Filters Market
North America commanded 33.20% of 2025 revenue, propelled by HIPAA mandates and updated Gramm-Leach-Bliley rules that classify visual privacy as a required safeguard. High device ownership and the adoption of zero-trust cybersecurity amplify baseline demand. Federal agencies standardize privacy screens across their field offices, and state privacy statutes, such as the California Privacy Rights Act, spur private-sector purchases to avoid enforcement penalties.
APAC Privacy Filters Market
The Asia-Pacific region is expected to register the fastest growth at 13.62% through 2031, as the implementation of China’s Personal Information Protection Law and India’s Digital Personal Data Protection Act raises compliance thresholds. Rapid IT infrastructure rollouts, increasing laptop penetration, and government digitization projects expand the install base. OEMs with fabs in Taiwan and South Korea integrate privacy layers during assembly, reducing import costs for regional buyers.
EMEA and South America Privacy Filters Market
Europe enforces stringent GDPR penalties, positioning privacy filters as a form of insurance against multi-million-euro fines. ISO standards on display ergonomics converge with green policy pushes for recyclable materials, influencing procurement criteria toward nanostructured films. Middle East nations, such as the UAE and Saudi Arabia, mirror GDPR frameworks, fueling adoption in banking and public-sector digital services. Africa and South America exhibit emerging demand; South Africa’s POPIA and Brazil’s LGPD establish legal baselines that multinational firms must adhere to, facilitating early-stage deployments.


Regulatory Landscape
Privacy filters are generally pulled into compliance programs through data-protection frameworks rather than device-specific mandates, so enforcement in regulated verticals acts as an adoption trigger. In Europe, GDPR enforcement has remained elevated, and EU regulators imposed EUR 4.1 billion in fines in 2024, with visual data exposure cited in a portion of cases. That outcome is pushing enterprises to formalize visual-security controls alongside encryption and access management.
In the United States, revisions to the Federal Trade Commission-administered Gramm-Leach-Bliley (GLB) Safeguards Rule emphasize documented safeguards that can include controls against screen eavesdropping in financial services. In healthcare purchasing, buyers map workstation privacy to HIPAA Security Rule guidance. For public-sector procurement, Trade Agreements Act (TAA) compliance is a gating requirement for many accessory purchases, shaping vendor qualification for federal and defense deployments. Separately, privacy filters must also avoid degrading the host display's compliance posture in markets where ecodesign and energy-labeling rules for electronic displays apply, including EU Regulation 2019/2021 and EU Regulation 2019/2013, which govern performance parameters such as luminance and power behavior.
Value Chain Analysis
The value chain starts with upstream optical and polymer inputs, including PET base films, adhesive systems, and light-control structures, typically microlouver stacks of alternating transmissive and absorptive layers. Specialized material and film suppliers provide view-control films and optical substrates that are converted through precision processes such as microreplication, cast-and-cure, or layer bonding and skiving. These steps are used to maintain tight louver geometry while preserving on-axis clarity.
Midstream converters and brand owners, including accessory suppliers and security-focused peripheral brands, laminate, coat (anti-glare, fingerprint resistance, antimicrobial), and finish filters with mounting systems, magnetic, adhesive, or frame-based, for laptop, monitor, and tablet form factors. Downstream distribution covers online retail for fragmented individual orders and corporate procurement, while direct OEM integration is increasingly important as laptop and display makers embed privacy layers at panel assembly for models with native privacy modes. After-sales services, including installation for large fleets, calibration for brightness and legibility, and end-of-life recycling where required by customer policy, are becoming more relevant in healthcare and large enterprise rollouts where workstation privacy is treated as a managed control rather than a discretionary accessory.
Competitive Landscape
The privacy filters market is moderately concentrated, with 3M, Targus, and Kensington collectively accounting for roughly 40%-45% of the revenue in 2024. They leverage patented microlouver films, established channel partners, and OEM co-branding. They invest in R and D to develop thinner layers, antimicrobial coatings, and touch-friendly surfaces that withstand heavy stylus use. Regional manufacturers in China, India, and Southeast Asia flood e-commerce with budget alternatives, capturing price-sensitive consumers but struggling to penetrate enterprise bids that require ISO and IEC certifications.
Display makers such as BOE Technology and LG Display are integrating privacy optics at the panel level, partnering with material innovators for nanostructure or electrochromic solutions. HP has patented a liquid-crystal privacy layer that automatically dims based on ambient light, demonstrating cross-industry collaboration between laptop OEMs and component specialists. Smaller entrants like PanzerGlass differentiate through antimicrobial features, while Tech Armor focuses on blue-light and fingerprint resistance for mobile devices. As embedded panels become mainstream, aftermarket players must pivot toward adaptable kits for legacy equipment or co-develop integrated variants, thereby intensifying M&A activity in materials science and optical-film coating.
Privacy Filters Industry Leaders
3M Company
Targus Inc.
Dell Technologies Inc.
HP Inc.
Fellowes Inc.
- *Disclaimer: Major Players sorted in no particular order
Privacy Filters Market Companies Covered in this Report
- 3M Company
- Targus International LLC
- Kensington Computer Products Group, a division of ACCO Brands Corporation
- Fellowes Inc.
- HP Inc.
- Dell Technologies Inc.
- V7 - Ingram Micro Inc.
- ViewSonic Corporation
- Lenovo Group Limited
- ZAGG Inc.
- PanzerGlass A/S
- Tech Armor LLC
- Amazon Basics (Amazon.com Inc.)
- Belkin International Inc.
- DMC Co. Ltd.
- Dicota GmbH
- Klear Screen LLC
- GlareGuard Screen Protectors LLC
- MOSISO (Mosiso LAB, Inc.)
- JCPal Technology Ltd.

Market Opportunities and Future Outlook
Opportunities persist in shifting privacy filters from accessory-driven purchases to auditable controls embedded in enterprise device standards. This is particularly relevant where hybrid work and open-plan layouts increase the incidence of visual exposure. In-market procurement evidence points to more centralized purchasing and OEM-led integration, with embedded privacy approaches used by HP Sure View, Lenovo ThinkShutter, and Dell built-in microlouver offerings. That combination creates room for suppliers that can support both aftermarket retrofits and factory-laminated supply programs.
Healthcare and government purchasing criteria also open room for vendors that align product design with compliance and procurement requirements rather than focusing only on optical specifications. HIPAA workstation privacy guidance and broader data-protection enforcement are already supporting bundle buying with endpoint-security programs and multiyear workstation refresh projects, and TAA-compliant privacy filters are used to meet public-sector sourcing rules for accessories. On the technology front, nanostructure-based filters and thinner microlouver films address mounting friction and brightness-loss concerns on high-nit and ultrathin devices, while EU sustainability and circular-economy pressures raise demand for improved recyclability and material transparency. This supports partnerships between film suppliers, converters, and OEM panel makers.
Recent Industry Developments in Privacy Filters Market
- July 2026: AWS added the OpenAI privacy-filter model to Amazon SageMaker JumpStart for PII detection and masking workflows. Although software-led, the launch reinforces multilayer privacy-by-design programs that combine data sanitization with endpoint controls, supporting enterprise security budgets that also fund visual-privacy protections on devices.
- February 2026: CDW highlighted 3M Privacy Filters as a visual-hacking mitigation control for organizations and emphasized Trade Agreements Act (TAA) compliance across the line. The positioning supports channel-led, compliance-oriented procurement, particularly for public-sector and regulated enterprise buyers that require verifiable sourcing and standardized accessories.
- June 2025: Kensington launched privacy screen filters featuring Eyesafe technology that combines viewing-angle protection with advanced blue-light filtration. The product direction reflects enterprise demand for privacy filters that also map to ergonomic and wellness procurement requirements, helping premium vendors differentiate beyond low-cost marketplace alternatives.


Privacy Filters Market Report Scope and Research Methodology
Market Definition and Coverage
This market covers physical screen privacy solutions that narrow viewing angles to help prevent visual hacking on devices such as laptops, monitors, tablets, and smartphones. Revenue is counted from privacy films and screen protectors sold through retail and B2B channels, plus privacy displays when integrated at the OEM level.
Scope exclusions: We exclude software privacy tools, camera shutters, and broader cybersecurity spending that does not directly relate to on-screen privacy filtering hardware.
Segments Covered in This Report
- By Product Type
- 2-Way Privacy Filters
- 4-Way Privacy Filters
- Touch-Screen Optimized Filters
- Integrated OEM Privacy Displays
- By Material Technology
- Microlouver Film Filters
- Nanotechnology-Based Filters
- Electrochromic Switchable Filters
- By Device Size
- Less than or equal to 15 Inch Screens
- 15–24 Inch Screens
- Above 24 Inch Screens
- By End-User Industry
- Corporate Offices
- Healthcare Facilities
- Financial Services
- Government Agencies
- Educational Institutions
- By Distribution Channel
- Online Retail
- Offline Retail
- Direct OEM Integration
- By Geography
- North America
- United States
- Canada
- Mexico
- Europe
- Germany
- United Kingdom
- France
- Russia
- Rest of Europe
- Asia-Pacific
- China
- Japan
- India
- South Korea
- Australia
- Rest of Asia-Pacific
- Middle East and Africa
- Middle East
- Saudi Arabia
- United Arab Emirates
- Rest of Middle East
- Africa
- South Africa
- Egypt
- Rest of Africa
- Middle East
- South America
- Brazil
- Argentina
- Rest of South America
- North America
Data Sources, Market Sizing, and Validation
Desk Research
Desk research was used to build the basic demand picture and to anchor the model to real-world device and workplace trends. We reviewed public sources such as US International Trade Commission trade data, UN Comtrade, and national statistics offices to understand import patterns for screen accessories and related materials.
To keep assumptions realistic, we also used sources such as OECD digital and labor indicators, World Bank macro series for price and income context, and standards or guidance from bodies such as ISO and NIST that influence privacy expectations in offices and regulated environments. Annual reports, investor decks, product catalogs, and reputable press helped validate product mix changes such as touch-optimized filters and integrated privacy displays. For cross-checking company revenue and patent activity, we selectively used paid subscriptions for company financials intelligence and patent databases. These examples are not exhaustive, and many other public and paid sources were also consulted for data collection, validation, and clarification.
Primary Interviews and Surveys
Primary calls and surveys were used to pressure-test adoption rates, pricing movement, and channel splits across key buyer groups such as enterprises, public sector users, and institutional buyers. Inputs also helped confirm how procurement differs by region for APAC, EMEA, and the Americas, and those findings were used to tighten assumptions where desk research coverage was weaker.
Distribution of primary research fieldwork respondents
| Company type | Respondent position | Region |
|---|---|---|
| Top tier: 27% | CXOs: 13% | APAC: 45% |
| Mid tier: 58% | Functional/Unit leaders: 31% | EMEA: 36% |
| Smaller Players: 15% | Managers: 56% | Americas: 19% |
Market-Sizing & Forecasting
Sizing starts with a top-down build where device installed base and shipment indicators are reconstructed by region and then translated into an addressable screen-count pool for privacy filtering use. That pool is then adjusted using primary feedback on attach rates by device type, replacement cycles, and the split between retrofit filters versus OEM-integrated privacy displays.
The model uses a small set of practical inputs that can be tracked each year, including enterprise laptop and monitor shipments, hybrid work penetration, average selling price bands for 2-way versus 4-way filters, the share of touch-screen optimized products, and the mix between online retail, offline retail, and direct B2B purchasing. Where coverage is uneven, gaps are handled by proxying with device mix and channel structure from similar markets, followed by a reasonableness check using sampled price points and volume ranges.
For forecasting, we use scenario analysis supported by regression checks on device shipments and office re-opening versus remote work levels, and we layer in expert views on ASP movement and product mix. Finally, selective bottom-up approximations are used, such as rolling up a sample of supplier revenues and channel checks, so the total remains aligned with what the market can realistically absorb.
Data Validation & Update Cycle
Validation is done in steps so the final numbers do not rely on one single assumption. We compare outputs against independent signals like device shipment trends, trade flow direction, and observed retail pricing, and then we investigate any sharp variance by geography or channel before sign-off.
A second analyst review is used to re-check formulas, currency conversions, and year alignment, and we re-contact sources when a key input moves outside an expected range. Reports are refreshed annually, with interim updates when material events occur, and a final pre-delivery pass is completed so clients receive the latest updated view.
Mordor Intelligence's Privacy Filters Market Size Compared With Other Published Estimates
Different published market values for privacy filters can look confusing at first because the product boundary is not always treated the same way. The biggest drivers are usually what is counted as a privacy filter, how OEM-integrated privacy displays are handled, and which channel revenues are included.
In our checks, the spread often comes from whether adjacent screen accessories get blended into the total, and whether pricing is modeled as a single average or split by 2-way versus 4-way and touch-optimized variants. Some sources also project a more aggressive long-term curve by assuming faster enterprise refresh cycles, or they apply a different currency timing for multi-region pricing, which can shift the same year value.
Benchmark comparison
| Source | Market Size | Gaps in Research Methodology |
|---|---|---|
| Mordor Intelligence | USD 1.55 B (2026) | |
| Industry Publisher A | USD 1.80 B (2026) | Uses a broader accessory interpretation and appears to pull in more screen protection add-ons, which inflates the average ASP and lifts the total for the same year. |
| Global Research House B | USD 2.21 B (2024) | Anchors earlier-year sizing on a wider device and end-use basket with different attach-rate assumptions, and its longer forecast horizon smooths pricing changes instead of separating retrofit versus OEM-integrated demand. |
Looking across the figures, the variance is mainly explained by scope and pricing treatment rather than disagreement that demand is growing. By keeping OEM-integrated privacy displays separate from general screen accessories and by tying attach rates to device and workplace indicators, the estimate remains traceable to repeatable inputs, a modeling choice used by Mordor Intelligence.


Key Questions Answered in the Report
What is the current value of the privacy filters market?
The privacy filters market size is USD 1.55 billion in 2026.
How fast will the privacy filters market grow by 2031?
It is projected to rise at a 12.68% CAGR and reach USD 2.83 billion by 2031.
Which end-user vertical is expanding most quickly?
Healthcare facilities lead growth with a forecast 13.58% CAGR through 2031.
Why are 4-way privacy filters gaining traction?
Open-plan offices and hot-desking expose screens from all directions, driving demand for omnidirectional protection.
What regions show the strongest future demand?
Asia-Pacific is expected to register the highest regional CAGR of 13.62% due to new data-protection laws and rapid device adoption.
How are OEMs influencing market dynamics?
Display manufacturers integrate privacy layers directly into panels, boosting direct OEM integration channels and reducing aftermarket friction.
Page last updated on:


 Your data is secure and never sold or shared.


