Capacitor Market Size and Share
Market Overview
| Study Period | 2020 - 2031 |
|---|---|
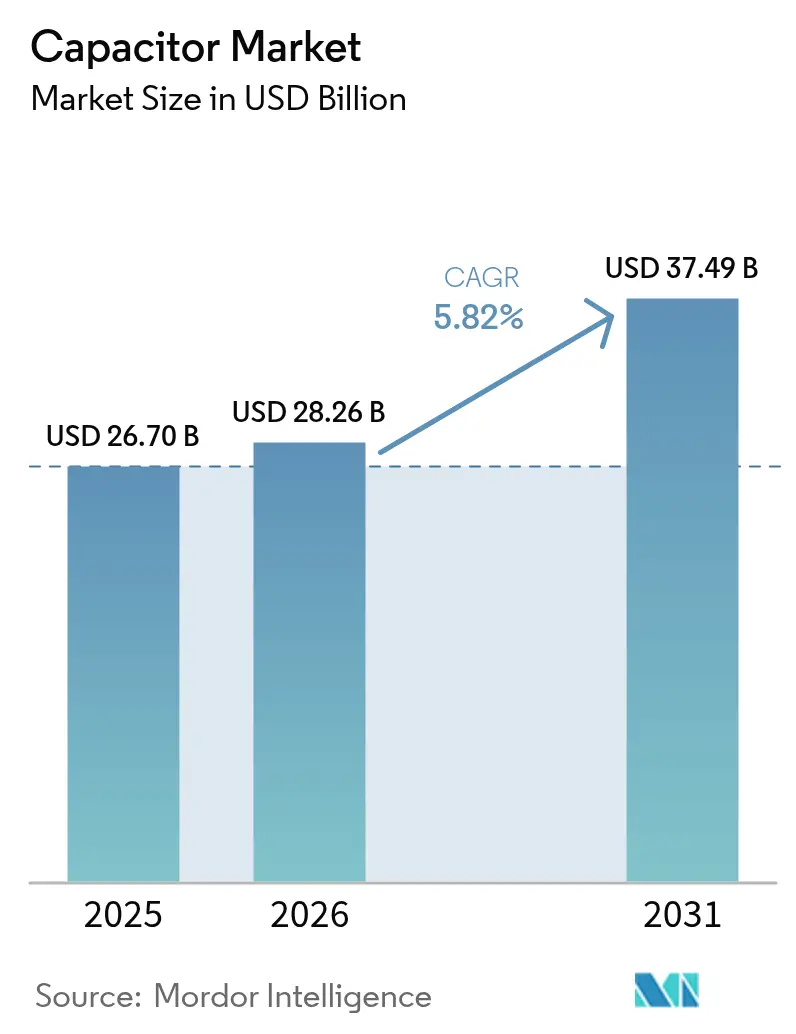
| Market Size (2026) | USD 28.26 Billion |
| Market Size (2031) | USD 37.49 Billion |
| Growth Rate (2026 - 2031) | 5.82% CAGR |
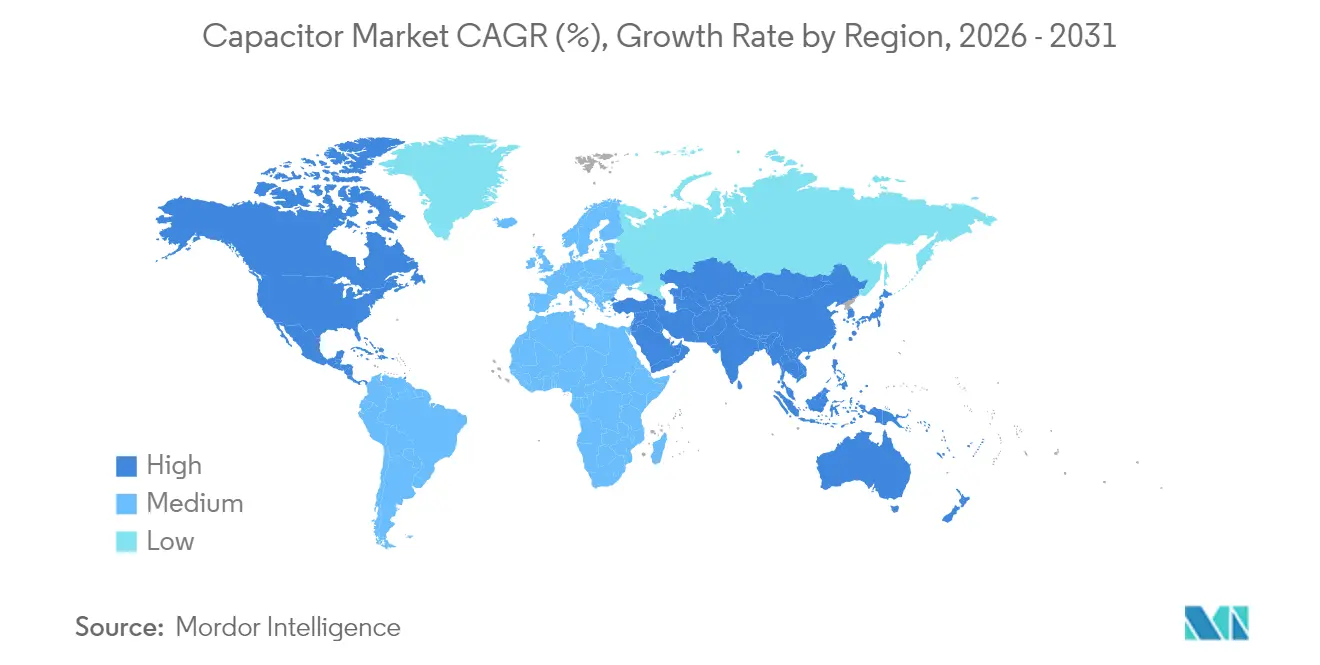
| Fastest Growing Market | North America |
| Largest Market | Asia Pacific |
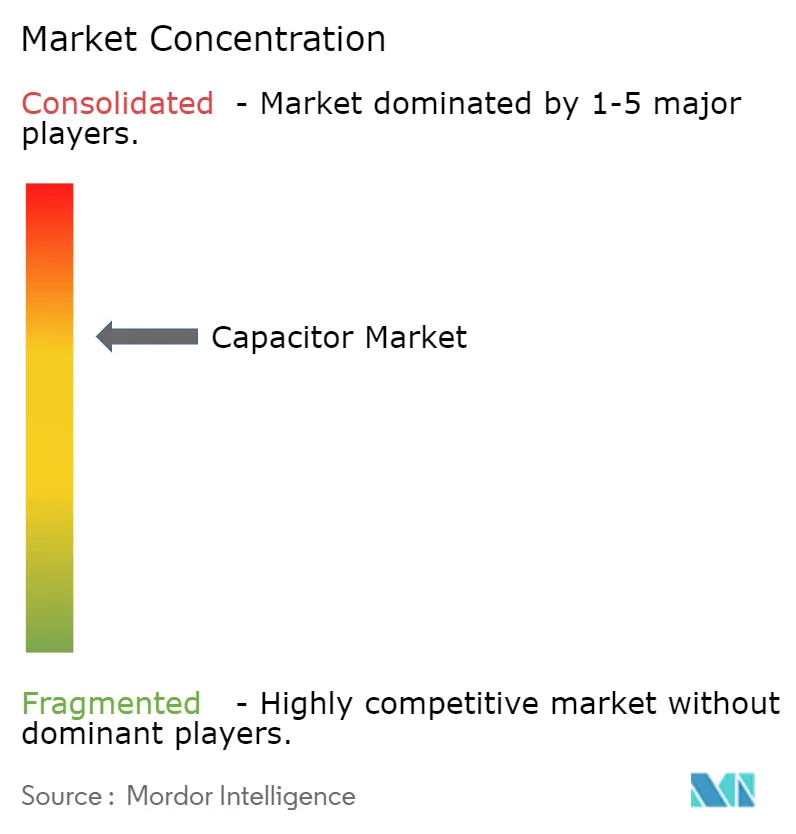
| Market Concentration | Medium |
Major Players *Disclaimer: Major Players sorted in no particular order Image © Mordor Intelligence. Reuse requires attribution under CC BY 4.0. | |
Capacitor Market Analysis by Mordor Intelligence
The capacitor market size was valued at USD 26.7 billion in 2025 and estimated to grow from USD 28.26 billion in 2026 to reach USD 37.49 billion by 2031, at a CAGR of 5.82% during the forecast period (2026-2031). Unabated electric-vehicle adoption, distributed-energy resources, and 5G densification form a durable three-pronged driver set that underpins the industry’s growth outlook. Ceramic MLCCs retain design-socket dominance because of reliability across wide temperature ranges, whereas supercapacitors post the fastest revenue gains as utilities trial hybrid storage topologies. Heightened capital expenditure in artificial-intelligence data-center nodes further amplifies demand for ultra-low-ESR and high-ripple-current capacitors, effectively decoupling volumes from legacy smartphone seasonality. Parallel investments in localized production mitigate geopolitical risk and create new price-elastic demand pockets, especially among North American electric-mobility startups. Policymakers’ procurement incentives strengthen the revenue visibility of companies willing to regionalize supply chains in exchange for tax credits.[1]Source: International Energy Agency, “Trends in the Electric Car Industry – Global EV Outlook 2025,” iea.org
Key Report Takeaways
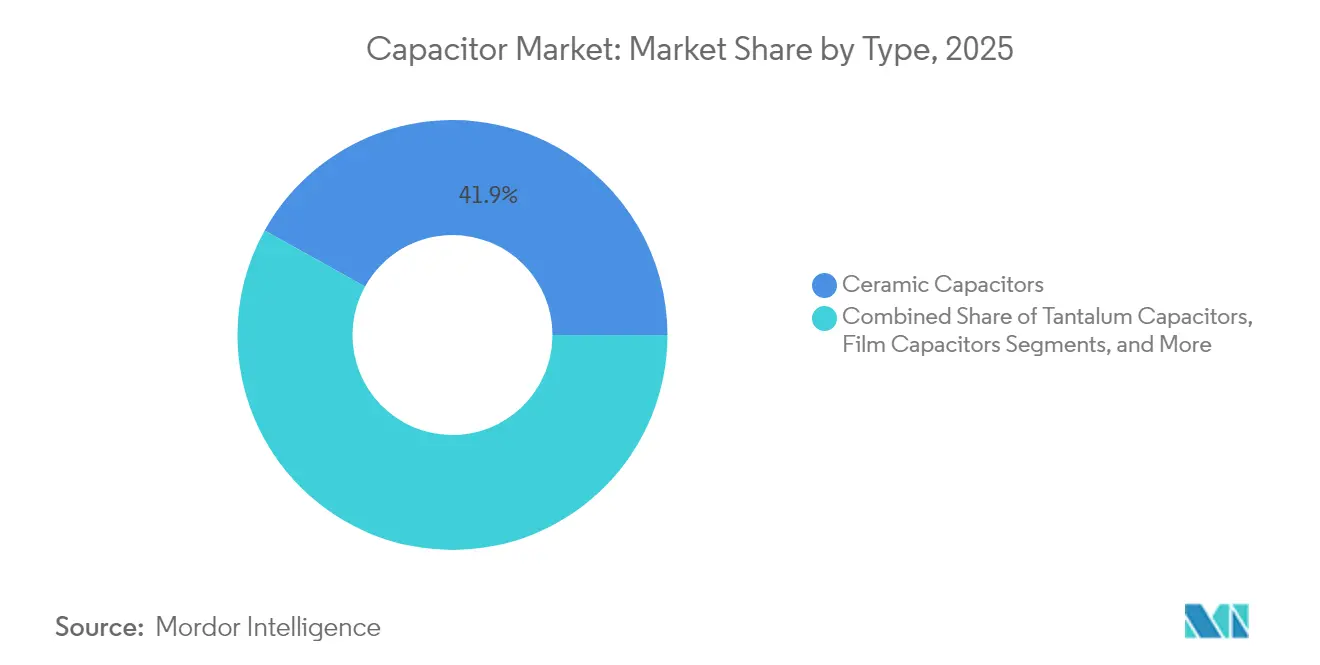
- By type, ceramic capacitors commanded 41.92% of the capacitor market share in 2025, whereas super-/ultracapacitors are advancing at a 7.38% CAGR through 2031.
- By voltage range, low-voltage devices (≤100 V) accounted for 48.74% share of the capacitor market size in 2025, while the high-voltage class (>1 kV) expands at a 6.33% CAGR.
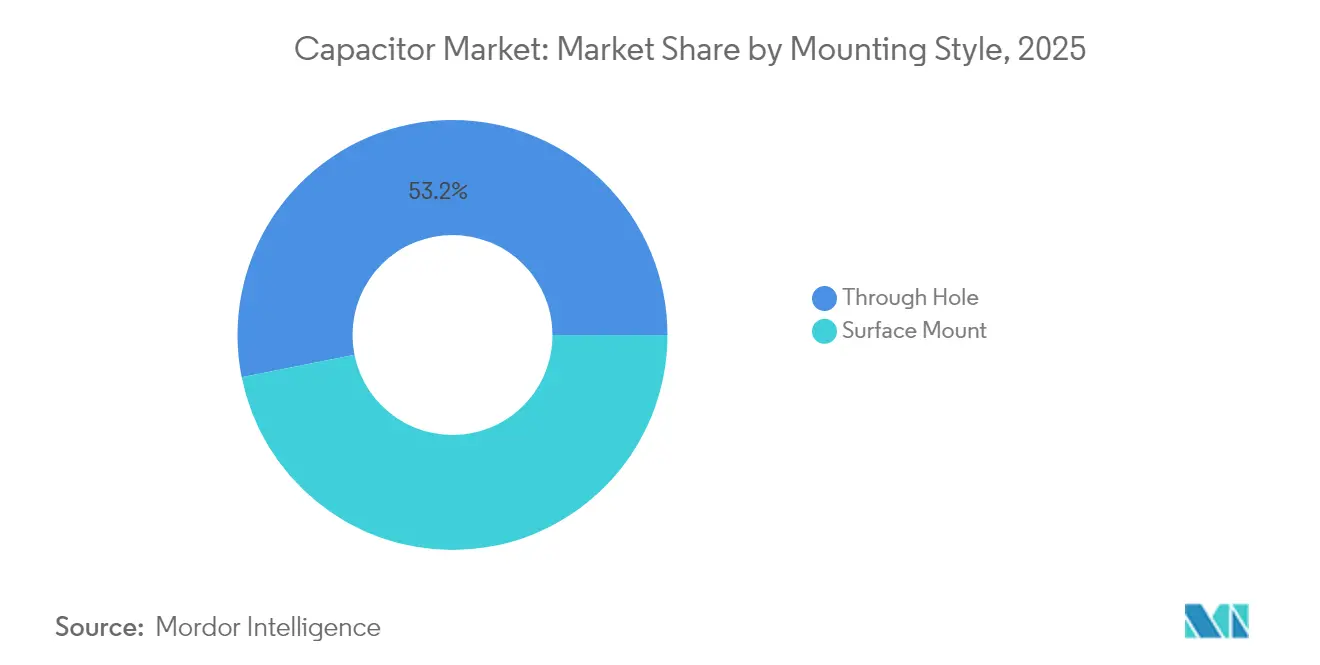
- By mounting style, surface-mount products led with 46.85% revenue share in 2025; through-hole units record the fastest 7.09% CAGR to 2031.
- By end-user industry, consumer electronics held 26.12% of the capacitor market size in 2025, and the energy and power sector is projected to grow at a 6.71% CAGR during the forecast window.
- By geography, Asia-Pacific dominated with 46.28% capacitor market share in 2025, whereas North America posts the highest 7.29% regional CAGR through 2031.
Note: Market size and forecast figures in this report are generated using Mordor Intelligence’s proprietary estimation framework, updated with the latest available data and insights as of 2026.
Global Capacitor Market Trends and Insights
Driver Imapct Analysis*
| DRIVER | (~) % IMPACT ON CAGR FORECAST | GEOGRAPHIC RELEVANCE | IMPACT TIMELINE |
|---|---|---|---|
| Growing adoption of EV power electronics | +1.8% | Global, with early gains in China, Europe, and North America | Medium term (2-4 years) |
| Rapid 5G/FTTx roll-outs driving high-frequency MLCC demand | +1.2% | Global, concentrated in Asia-Pacific and North America | Short term (≤ 2 years) |
| Grid-scale battery storage deployment | +1.0% | North America and Europe, expanding to Asia-Pacific | Long term (≥ 4 years) |
| Automotive zonal E/E architectures | +0.9% | Global automotive markets | Medium term (2-4 years) |
| Energy harvesting IoT nodes needing ultra-low-ESR caps | +0.6% | Global, with a concentration in industrial regions | Long term (≥ 4 years) |
| Source: Mordor Intelligence | |||
Growing Adoption of EV Power-Electronics
Electric-vehicle output rose to 17.3 million units in 2024, a 25% year-on-year surge that translates directly into higher demand for high-voltage film capacitors in traction inverters. Each battery-electric car now integrates more than 15,000 MLCCs, quadrupling the baseline content found in traditional combustion models, while premium 800 V drivetrains require devices with enhanced voltage ratings and thermal stability. Capacitor suppliers able to pass AEC-Q200 qualifications enjoy multi-year design wins that shield them from consumer-electronics volatility. TDK’s 100 V, 10 µF MLCC in the 3225 case size exemplifies how product roadmaps stretch performance envelopes without enlarging footprint. The result is a structural uplift in average selling price per vehicle, reinforcing the positive flywheel between electrification and the capacitor market.
Rapid 5G/FTTx Roll-Outs Driving High-Frequency MLCC Demand
More than 300 network operators will activate commercial 5G service by late 2024, and analysts forecast that 75% of global mobile data will traverse 5G infrastructure by 2029.[2]Source: Ericsson, “Backhaul Capacity Evolution 2024,” ericsson.comMassive-MIMO antenna arrays require capacitors with ultra-low dielectric loss at frequencies above 6 GHz, a specification that legacy ceramic formulations struggle to meet. Samsung Electro-Mechanics, therefore, targets KRW 1 trillion in automotive MLCC revenue, leveraging know-how originally developed for telecommunication base stations to serve connected-vehicle platforms. Murata’s 006003-inch MLCC, 75% smaller than its predecessor, embodies the perpetual miniaturization race while safeguarding electrical performance metrics. With each base-station radio board hosting tens of thousands of capacitors, the upward trajectory of 5G deployments ensures that the capacitor market remains tightly coupled to global bandwidth-consumption trends.
Grid-Scale Battery Storage Deployment
Variable renewable generation crossed 40% of electricity supply in leading economies during 2024, prompting utility operators to invest aggressively in grid-scale battery storage systems. Supercapacitors complement lithium-ion packs by offering millisecond-level response for frequency regulation, as illustrated by the commissioning of a 5 MW installation in China that responds 14 times faster than conventional batteries. Film-capacitor makers supply self-healing polypropylene devices for high-voltage DC links that connect storage blocks with inverter stations.[3]Source: Arrow Electronics, “New Capacitors in Battery Energy Storage Systems,” arrow.comThe U.S. Department of Energy projects that supercapacitor costs could fall by 90% by 2030, clearing economic hurdles for large-scale deployment and opening another growth avenue for the capacitor industry.
Automotive Zonal E/E Architectures
Automakers are migrating from distributed control units toward zonal architectures that consolidate processing into a handful of domain controllers linked by gigabit backbones. The change reduces wiring weight but raises requirements for electromagnetic-interference suppression at nodes located near powertrains. Supercapacitor supplier Clarios debuted 12 V and 48 V modules to support brake-by-wire systems where instantaneous power delivery is non-negotiable. As electronic loads shift closer to heat sources, capacitors must tolerate wider temperature excursions, prompting the adoption of high-reliability dielectric formulations validated under extended thermal-cycling protocols.
Restraints Impact Analysis*
| RESTRAINTS | (~) % IMPACT ON CAGR FORECAST | GEOGRAPHIC RELEVANCE | IMPACT TIMELINE |
|---|---|---|---|
| Volatility in the MLCC supply chain for high-capacitance ceramics | -0.8% | Global, concentrated in Asia-Pacific manufacturing | Short term (≤ 2 years) |
| Technical know-how gap for solid-state ultracapacitors | -0.6% | Global, affecting Western markets | Long term (≥ 4 years) |
| PFAS phase-out pressure on PTFE film capacitors | -0.4% | Europe and North America | Medium term (2-4 years) |
| Rising raw-material cost of tantalum ore | -0.3% | Global | Medium term (2-4 years) |
| Source: Mordor Intelligence | |||
Volatility in MLCC Supply Chain for High-Capacitance Ceramics
Barium titanate shortages pushed lead times for automotive-grade MLCCs beyond six months in 2024, underlining geographic concentration risks because China dominates precursor processing.[4]Source: Kearney, “Unpacking Risks in the Electronics Supply Chain,” kearney.com Yield rates for capacitors that meet AEC-Q200 standards remain below 70%, creating allocation battles between automotive and telecom customers whenever supply tightens. Equipment upgrades that enable thinner dielectric layers exacerbate constraints by requiring ultrapure raw materials as layer thickness nears physical limits. Western manufacturers have announced capacity expansions, yet fresh factories need up to two years to qualify, prolonging near-term supply imbalances.
Technical Know-How Gap for Solid-State Ultracapacitors
Solid-state ultracapacitors promise order-of-magnitude improvements in cycle life, but ionic conductivities above 10-3 Ω-1 cm-1 remain elusive at room temperature.[5]Source: RSC Advances, “High-Energy-Density Solid-State Supercapacitors,” rsc.org NASA prototypes highlight feasibility, although pricing sits outside mass-market thresholds. Scaling production further requires customized deposition equipment and standardized testing protocols, barriers that discourage newcomers. The absence of commercially proven supply chains keeps many automotive and grid-storage developers on the sidelines, effectively delaying the technology’s contribution to the capacitor market revenue
*Our forecasts treat driver/restraint impacts as directional, not additive. The impact forecasts reflect baseline growth, mix effects, and variable interactions.
Segment Analysis
By Type: Ceramic Dominance Drives Innovation
Ceramic capacitors captured 41.92% of the capacitor market share in 2025 by balancing volumetric efficiency with rugged temperature tolerance, maintaining revenue leadership even as alternative dielectrics gain niche footholds. The segment’s momentum stems from relentless layer-count increases and finer-grain control, as demonstrated by Murata’s release of a 006003-inch MLCC that maintains capacitance despite a 75% footprint reduction. Future growth hinges on incorporating nickel-barrier terminations that reduce silver-palladium cost exposure while preventing migration at high temperatures.
Super-/ultracapacitors register a 7.38% CAGR, the fastest across all types, propelled by hybrid bus lines that pair high-voltage lithium packs with carbon-based power buffers. Tantalum parts sustain relevance in medical implants and avionics modules where volumetric efficiency offsets cost premiums, though ore sourcing adds price volatility. Aluminum electrolytics retain high-voltage power-supply sockets where surge current capability trumps endurance concerns. Film capacitors experience bifurcated demand: polypropylene films grow in renewable-energy converters, whereas PTFE-based variants face PFAS-related phase-down mandates.


By Voltage Range: High-Voltage Acceleration
Low-voltage devices (≤100 V) delivered 48.74% of 2025 revenue, anchored by smartphones, wearables, and infotainment consoles. Yet the high-voltage class (>1 kV) is projected to accelerate at a 6.33% CAGR as 800 V battery-electric vehicles and series-capacitor banks proliferate; together they are expanding the capacitor market size devoted to power-transmission conditioning. Medium-voltage parts (100 V–1 kV) grow steadily because robotics and factory-automation retrofits migrate to higher DC-bus levels for efficiency gains.
Designers increasingly demand impedance-controlled, high-voltage stacks that combine ceramic and film technologies to tame ringing in wide-band-gap semiconductor switches. Suppliers responding with hybrid modules capture premium pricing, demonstrating that value accrues to solutions able to handle both high ripple current and partial-discharge endurance. The resulting product differentiation keeps price erosion modest even as unit volumes rise.
By Mounting Style: Surface-Mount Leadership
Surface-mount technology (SMT) accounted for 46.85% of sales in 2025, propelled by automated placement lines that dominate consumer and telecom hardware. Ongoing migration from 0603 to 0201 sizes in flagship phones boosts the capacitor market share of SMT further, all while maintaining reflow-solder yield targets. At the same time, through-hole parts post a healthy 7.09% CAGR because industrial drives, rail traction, and military avionics require mechanical robustness under vibration and thermal-cycling extremes.
As board real estate tightens, OEMs adopt mixed-mount strategies: SMT for space-constrained logic areas and radial-lead or screw-terminal cans for bulk-storage nodes. Automation advances reduce cost differentials between the two mounting styles, letting engineers make reliability-first choices without breaching budget ceilings. Consequently, both formats sustain clear value propositions inside the broader capacitor market.
By End-User Industry: Energy Sector Emergence
Consumer electronics retained 26.12% of the capacitor market size in 2025 owing to high-volume handset and notebook production, yet unit growth moderates as penetration saturates mature regions. The energy & power vertical is projected to expand at a 6.71% CAGR through 2031, buoyed by grid-scale battery energy-storage systems and distributed-generation converters that depend on film and supercapacitors for power-conditioning roles.
Automotive demand rises in tandem with electric-vehicle penetration, lifting average capacitor build-to-materials past USD 85 per vehicle. Industrial automation, data-center, and aerospace-defense segments round out the landscape with premium-price, mission-critical applications that shield revenue from consumer cyclicality. This end-market diversity preserves overall growth headroom even during handset inventory corrections.
Geography Analysis
Asia-Pacific commanded 46.28% of 2025 worldwide revenue thanks to vertically integrated supply chains in China, Japan, and South Korea. Mature ceramic-powder calcination, automated MLCC sintering, and proximity to electronics OEM clusters provide scale economies that reinforce the region’s grip on baseline production. Japanese vendors leverage miniaturization patents to secure higher average selling prices despite labor-cost premiums, while South Korean lines specialize in automotive-grade lots that satisfy AEC-Q200 thermal-shock limits.
North America is forecast to record a 7.29% CAGR through 2031, the fastest across major regions. Federal incentives under the CHIPS and Science Act encourage passive-component reshoring adjacent to wafer-fab investments, and new EV assembly plants use localized sourcing to unlock clean-vehicle tax credits. Data-center operators also raise demand as AI accelerators inflate board-level capacitance budgets by about 25%, sustaining a multi-year uplift for high-reliability ceramic and polymer-aluminum devices.
Europe balances steady industrial-automation demand with regulatory headwinds that reshape material choices. PFAS phase-outs compel rapid substitution toward polypropylene and polyethylene naphthalate films, while Battery Regulation 2023/1542 introduces extended-producer-responsibility rules that favor suppliers able to document closed-loop recycling.
Emerging markets in South America and the Middle East & Africa add episodic upside via renewable-energy auctions and telecom network expansions, yet infrastructure gaps keep absolute volumes small. Altogether, geographic diversification mitigates single-region shocks and reinforces long-run expansion for the capacitor market.

Competitive Landscape
Global competition remains moderately consolidated as Murata, TDK, and Samsung Electro-Mechanics collectively control roughly 60% of the MLCC sub-segment, leveraging deep materials science expertise and capital-intensive sintering technology. Their scale advantages preserve gross-margin leadership, particularly in automotive grades where qualification cycles extend beyond two years and deter new entrants. Japanese incumbents further expand moats by vertically integrating ceramic-powder production and forming joint ventures, such as Murata’s partnership with QuantumScape aimed at solid-state battery ceramics.
Regional diversification represents the prevailing strategic response to supply-chain fragility. YAGEO’s purchase of Shibaura Electronics for high-temperature sensors and Delta Electronics’ acquisition of Alps Alpine’s power-inductor assets illustrate convergence across passive component portfolios. Such moves enable cross-selling into electrified powertrains where capacitors, inductors, and sensors cohabitate tight spaces and share thermal budgets. Smaller niche players exploit white spaces by focusing on extreme-environment and defense applications; CAP-XX’s graphene-oxide joint venture aims to lift power density beyond incumbent activated-carbon chemistries.
Supply-side pressures around tantalum and barium titanate feedstocks foreground raw-material strategy as a core competency. Companies invest in closed-loop recycling and alternative dielectric systems such as niobium oxide to insulate themselves from ore price shocks. Parallel regulatory pressure to eliminate PFAS pushes film-capacitor vendors into accelerated R&D programs that favor polypropylene and novel fluorine-free polymers. Collectively, these dynamics suggest an industry in controlled transition, with incumbents defending scale economies while challengers target adjacent niches, ensuring that the capacitor market retains moderate competitive tension over the forecast horizon.
Capacitor Industry Leaders
TDK Corporation
Murata Manufacturing Co., Ltd.
Vishay Intertechnology, Inc.
KYOCERA AVX Components Corp.
KEMET (Yageo Group)
- *Disclaimer: Major Players sorted in no particular order

Recent Industry Developments
- April 2025: TDK unveiled 100 V, 10 µF automotive-grade MLCCs in 3225 sizes, enabling component-count reductions in 48 V subsystems.
- April 2025: NICHICON introduced the PCY Series conductive-polymer aluminum capacitors for industrial and automotive applications demanding lower ESR.
- March 2025: Kyocera AVX launched the first 0402 MLCC to achieve 47 µF capacitance, advancing board-space savings in AI accelerator cards.
- January 2025: Murata Manufacturing and QuantumScape entered a collaboration to mass-produce ceramic films for solid-state batteries, widening Murata’s revenue streams beyond traditional MLCCs.


Global Capacitor Market Report Scope
A capacitor is a passive electronic component or device that is capable of storing energy in the form of an electric charge. It consists of two conductors in close proximity and insulated from each other.
The capacitor market is segmented by type (ceramic capacitors, tantalum capacitors, aluminum electrolytic capacitors, paper and plastic film capacitors, supercapacitors/EDLCs), by end-user industry (automotive, industrial, aerospace & defense, energy, communications/servers/data storage, consumer electronics, medical), and by geography (Americas, Europe, Middle East & Africa, Asia-pacific (excl. Japan and South Korea), Japan and South Korea). The market sizes and forecasts are provided in terms of value (USD) for all the above segments.
| Ceramic Capacitors |
| Tantalum Capacitors |
| Aluminum Electrolytic Capacitors |
| Film Capacitors (Paper and Plastic) |
| Super-/Ultracapacitors |
| Low Voltage (≤100 V) |
| Medium Voltage (100 V–1 kV) |
| High Voltage (Above 1 kV) |
| Surface-Mount |
| Through-Hole |
| Automotive |
| Industrial |
| Energy and Power |
| Communications / Servers / Data Storage |
| Consumer Electronics |
| Aerospace and Defense |
| Medical Devices |
| North America | United States | |
| Canada | ||
| Mexico | ||
| South America | Brazil | |
| Argentina | ||
| Rest of South America | ||
| Europe | Germany | |
| United Kingdom | ||
| France | ||
| Russia | ||
| Rest of Europe | ||
| Asia-Pacific | China | |
| Japan | ||
| India | ||
| South Korea | ||
| South-East Asia | ||
| Rest of Asia-Pacific | ||
| Middle East and Africa | Middle East | Saudi Arabia |
| United Arab Emirates | ||
| Rest of Middle East | ||
| Africa | South Africa | |
| Egypt | ||
| Rest of Africa | ||
| By Type | Ceramic Capacitors | ||
| Tantalum Capacitors | |||
| Aluminum Electrolytic Capacitors | |||
| Film Capacitors (Paper and Plastic) | |||
| Super-/Ultracapacitors | |||
| By Voltage Range | Low Voltage (≤100 V) | ||
| Medium Voltage (100 V–1 kV) | |||
| High Voltage (Above 1 kV) | |||
| By Mounting Style | Surface-Mount | ||
| Through-Hole | |||
| By End-user Industry | Automotive | ||
| Industrial | |||
| Energy and Power | |||
| Communications / Servers / Data Storage | |||
| Consumer Electronics | |||
| Aerospace and Defense | |||
| Medical Devices | |||
| By Geography | North America | United States | |
| Canada | |||
| Mexico | |||
| South America | Brazil | ||
| Argentina | |||
| Rest of South America | |||
| Europe | Germany | ||
| United Kingdom | |||
| France | |||
| Russia | |||
| Rest of Europe | |||
| Asia-Pacific | China | ||
| Japan | |||
| India | |||
| South Korea | |||
| South-East Asia | |||
| Rest of Asia-Pacific | |||
| Middle East and Africa | Middle East | Saudi Arabia | |
| United Arab Emirates | |||
| Rest of Middle East | |||
| Africa | South Africa | ||
| Egypt | |||
| Rest of Africa | |||


Key Questions Answered in the Report
What is the global value of the capacitor market in 2026?
The capacitor market size is USD 28.26 billion in 2026.
Which capacitor type leads revenue share?
Ceramic capacitors hold 41.92% of 2025 revenue, maintaining the largest slice.
Which region is growing fastest through 2031?
North America records the highest regional CAGR at 7.29% because of EV infrastructure and data-center investments.
How fast are supercapacitors expanding?
Super-/ultracapacitors post a 7.38% CAGR through 2031, making them the fastest-growing segment.
Page last updated on:


