Glycomics Market Size and Share
Market Overview
| Study Period | 2020 - 2031 |
|---|---|
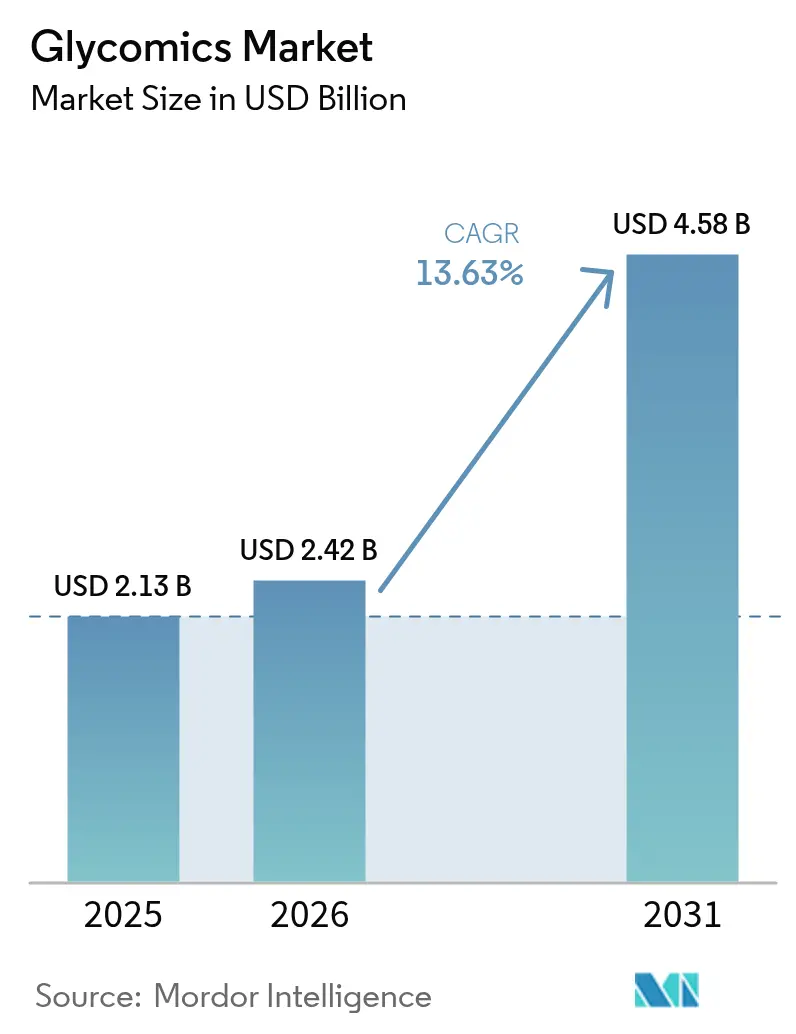
| Market Size (2026) | USD 2.42 Billion |
| Market Size (2031) | USD 4.58 Billion |
| Growth Rate (2026 - 2031) | 13.63% CAGR |
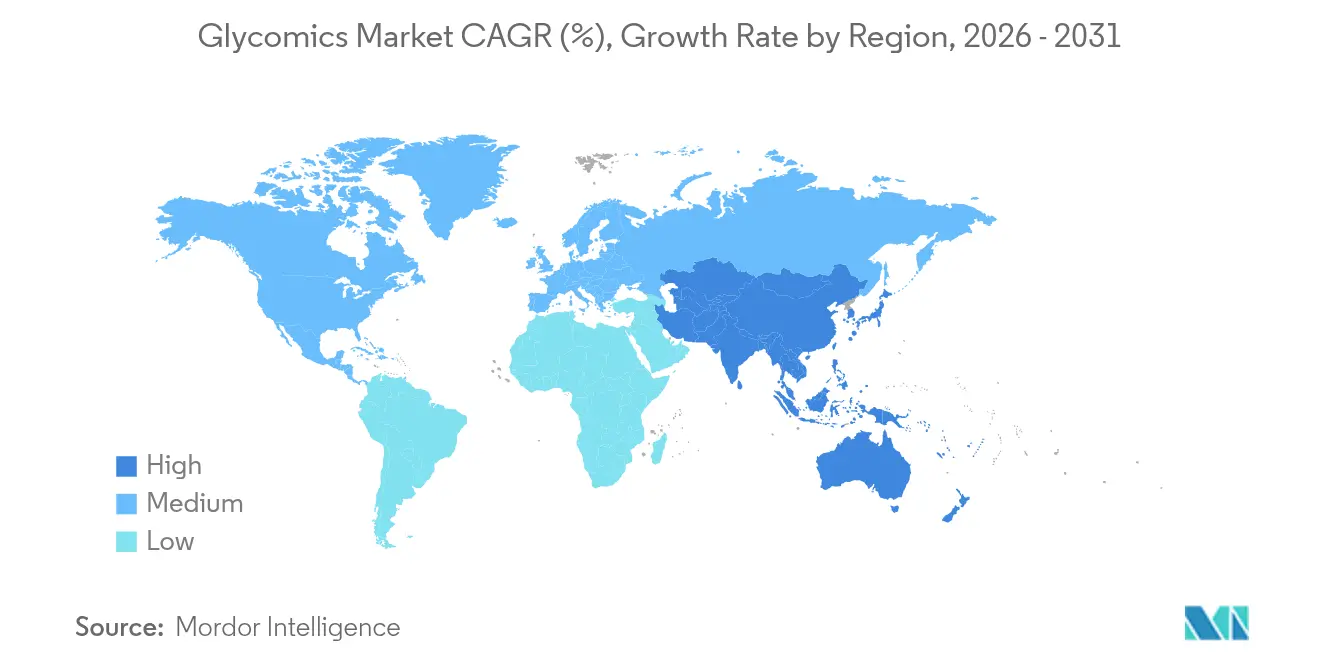
| Fastest Growing Market | Asia Pacific |
| Largest Market | North America |
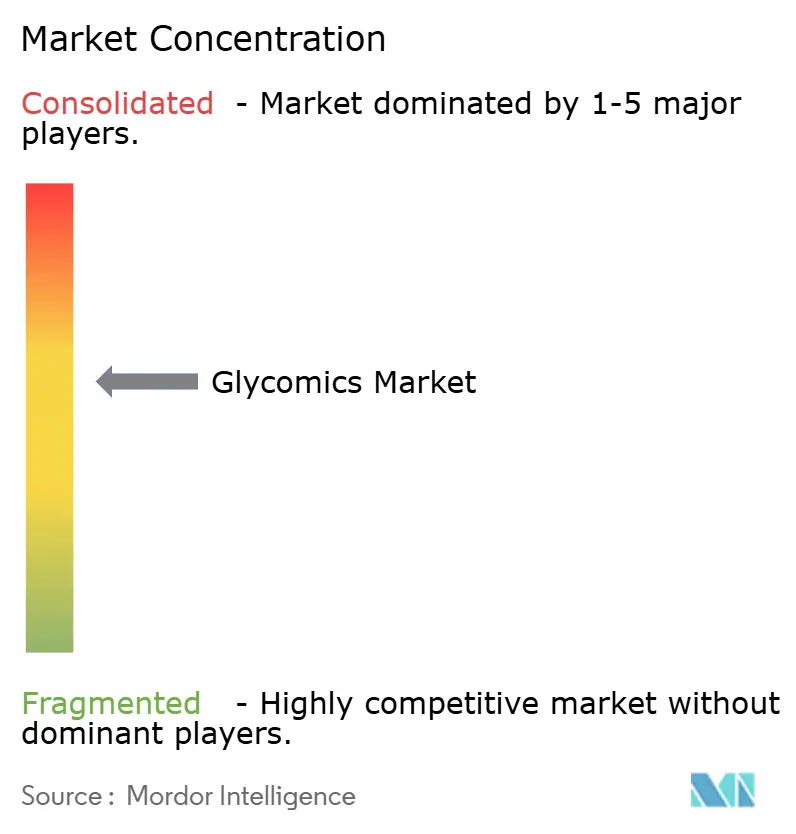
| Market Concentration | Medium |
Major Players *Disclaimer: Major Players sorted in no particular order Image © Mordor Intelligence. Reuse requires attribution under CC BY 4.0. | |
Glycomics Market Analysis by Mordor Intelligence
The glycomics market size was valued at USD 2.13 billion in 2025 and estimated to grow from USD 2.42 billion in 2026 to reach USD 4.58 billion by 2031, at a CAGR of 13.63% during the forecast period (2026-2031). Momentum comes from the convergence of advanced mass-spectrometry, AI-driven informatics, and the demand for novel biomarkers that improve early disease detection. Pharmaceutical pipelines are shifting toward glyco-engineered biologics, and analytical platform vendors are responding with integrated hardware–software systems that simplify complex workflows. Chronic disease prevalence continues to rise, driving healthcare providers to adopt glycoproteomic diagnostics, while government funding programs reduce the entry barriers for academic laboratories. Market competition remains moderate as large life-science tool vendors contend with focused reagent suppliers and cloud-based data-analytics start-ups. Supply constraints for rare glycan reagents and a shortage of trained glycobiologists temper short-term expansion, yet regulatory reforms and strategic partnerships are steadily easing these challenges.
Key Report Takeaways
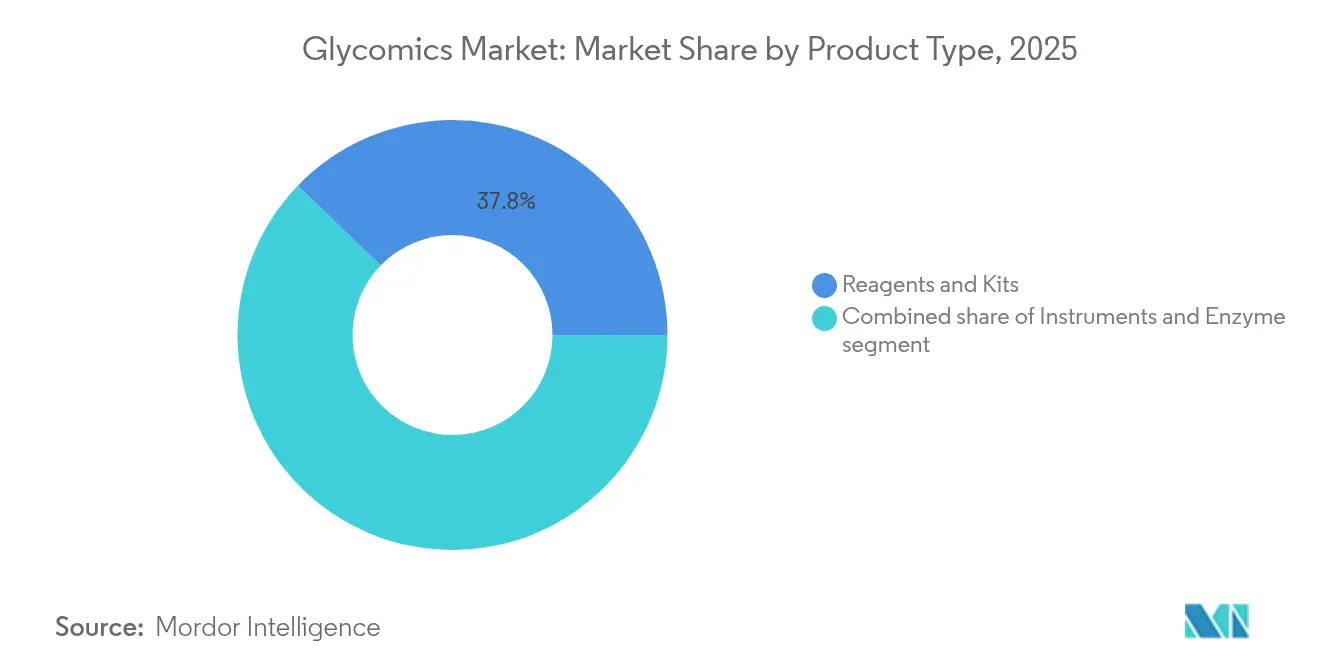
- By product type, reagents and kits held 37.78% of glycomics market share in 2025, while enzymes are on track for a 15.18% CAGR through 2031.
- By technology, mass spectrometry captured 40.92% revenue share in 2025; microarray and chip-based platforms are projected to grow at 14.32% CAGR to 2031.
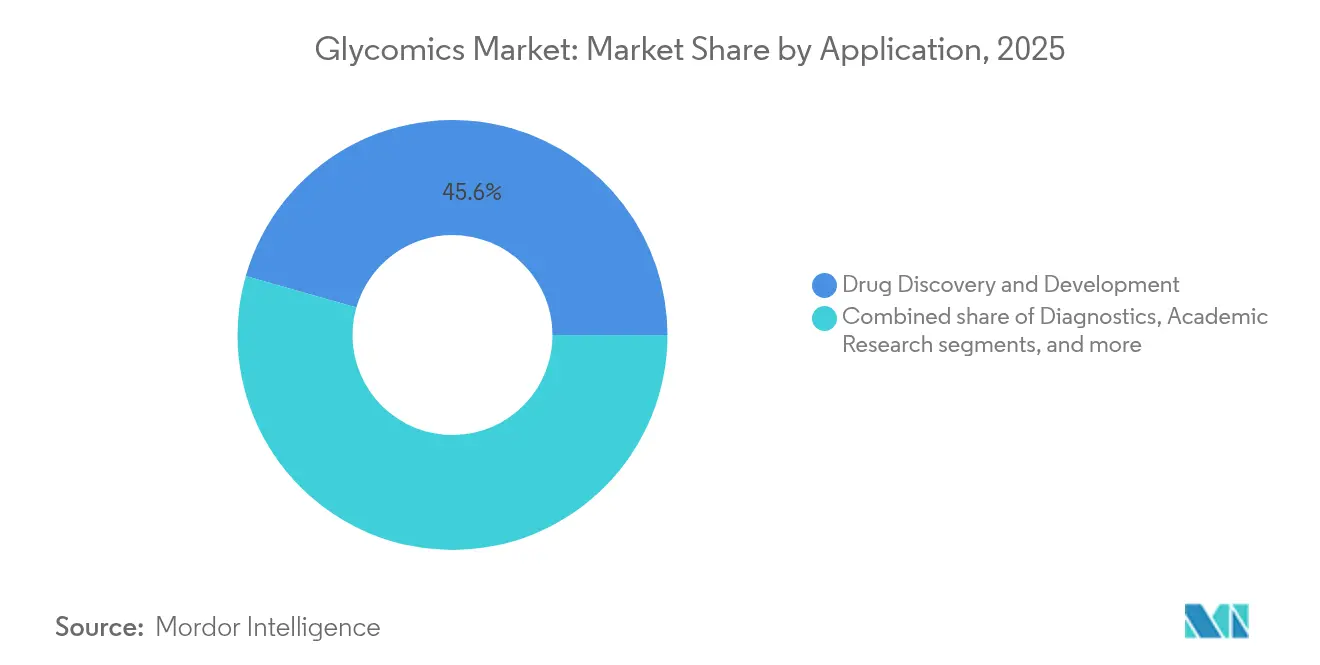
- By application, drug discovery and development commanded 45.57% of the glycomics market size in 2025, whereas vaccine development is set to advance at 14.21% CAGR.
- By end user, pharmaceutical and biotechnology companies accounted for 48.62% of overall demand in 2025, yet hospitals and clinical laboratories will post the fastest 14.98% CAGR through 2031.
- By geography, North America led with 38.10% share of the glycomics market in 2025, and Asia-Pacific is forecast to expand at 14.09% CAGR.
Note: Market size and forecast figures in this report are generated using Mordor Intelligence’s proprietary estimation framework, updated with the latest available data and insights as of 2026.
Global Glycomics Market Trends and Insights
Driver Impact Analysis*
| Driver | (~) % Impact on CAGR Forecast | Geographic Relevance | Impact Timeline |
|---|---|---|---|
| Accelerating Pharmaceutical Investments in Glycobiology | +2.8% | North America, Europe | Medium term (2–4 years) |
| Growing Adoption of Mass Spectrometry Platforms | +2.1% | Global | Short term (≤2 years) |
| Expansion of Biopharmaceutical Production Capacities | +1.9% | North America, Europe, spill-over to Asia-Pacific | Long term (≥4 years) |
| Rising Prevalence of Chronic Diseases Driving Biomarker Demand | +2.4% | Global | Medium term (2–4 years) |
| Emergence of Glyco-Engineered Cell and Gene Therapies | +1.6% | North America, Europe | Long term (≥4 years) |
| Integration of AI-Enabled Glycan Informatics Solutions | +1.3% | Global, early gains in North America | Short term (≤2 years) |
| Source: Mordor Intelligence | |||
Accelerating Pharmaceutical Investments in Glycobiology
R&D portfolios inside large drug makers now assign priority budgets to glycobiology because glycan changes can foreshadow disease up to ten years before symptoms appear. Glycomine’s USD 115 million Series C raise in 2025 demonstrates investor confidence and channels capital into specialized reagent demand. Alliance formation between academic centers and industry has intensified; Harvard Medical School’s Center for Glycoscience works with multiple sponsors to push lab insights toward clinical trials. Controlled glyco-engineering improves monoclonal antibody potency and reduces immunogenicity, fuelling orders for advanced mass-spectrometry systems and recombinant glycosyltransferases. The trend lifts mid-cap tool suppliers that provide turnkey glycoprotein workflows, making the glycomics market attractive for venture investors searching for platform scale.
Growing Adoption of Mass Spectrometry Platforms
Mass spectrometry has become the analytical backbone for structural glycomics because it now delivers single-molecule clarity. Bruker’s glyco-PASEF method, launched in 2024, reads complex glycopeptides in minutes and lowers sample volumes, shortening project timelines for CROs. Hybrid analyzers paired with rapid ion-mobility separation provide linkage-specific detail without labor-intensive derivatization. AI tools such as CandyCrunch raise identification accuracy toward 90% for unknown structures, reducing the learning curve for new entrants. Taken together, these advances broaden the customer base from elite core facilities to regional hospitals, thereby widening the glycomics market.
Expansion of Biopharmaceutical Production Capacities
Biomanufacturers are scaling cell-culture suites to meet antibody demand, and each production run must replicate the originator’s glycan fingerprint. Process-analytical-technology guidelines now highlight real-time glycan monitoring, so contract manufacturers are acquiring high-throughput LC-MS systems while licensing recombinant enzymes that steer glycoforms toward targeted profiles. Continuous downstream processing relies on rapid analytics, locking in multi-year procurement deals for consumables. Europe’s network of midsize CDMOs and North America’s mega plants share similar needs, which lifts recurring revenue streams for reagent vendors and boosts overall glycomics market growth.
Rising Prevalence of Chronic Diseases Driving Biomarker Demand
Health systems confront growing volumes of diabetes, oncology, and neurodegenerative disorders, and decision makers prize biomarkers that flag disease earlier than current assays. IgG N-glycan panels now stratify insulin resistance and foresee type 2 diabetes onset years ahead. Cancer researchers profile tumor-associated carbohydrate antigens in liquid biopsies to match immunotherapy responders with more precision. As laboratory guidelines adopt glycoproteomic markers, clinical labs purchase automated sample-prep kits and partner with cloud analytics providers, reinforcing the upward trajectory of the glycomics market.
Restraints Impact Analysis*
| Restraints Impact Analysis | (~) % Impact on CAGR Forecast | Geographic Relevance | Impact Timeline |
|---|---|---|---|
| High Cost and Technical Complexity of Glycomics Workflows | -1.8% | Global | Short term (≤2 years) |
| Limited Availability of Skilled Glycobiology Professionals | -1.4% | Global, acute in emerging markets | Medium term (2–4 years) |
| Regulatory Uncertainty for Glycan-Based Diagnostics | -1.2% | Global | Medium term (2–4 years) |
| Constrained Supply of Rare Glycan Reagents | -1.1% | Global | Short term (≤2 years) |
| Source: Mordor Intelligence | |||
High Cost and Technical Complexity of Glycomics Workflows
State-of-the-art LC-MS platforms suitable for intact glycoprotein analysis can top USD 500,000, and specialized consumables remain several multiples costlier than proteomics reagents. Method development often requires six to twelve months before routine operation, which stretches project budgets. Each sample may undergo enzymatic release, fluorescent labeling, and multidimensional separation, so consumable usage is high. For many small laboratories, outsourcing remains cheaper, slowing internal adoption and constraining early glycomics market penetration in cost-sensitive regions.
Limited Availability of Skilled Glycobiology Professionals
Fewer than fifty universities offer dedicated glycobiology tracks, and that leaves a talent gap as firms scramble for interdisciplinary experts who can synthesize chemistry, analytical science, and bioinformatics. Senior specialists command salary premiums of 20% to 30%, raising operational costs for new entrants. While NIH Common Fund programs sponsor curriculum development, a full pipeline of qualified graduates is five or more years away[1]NIH Common Fund, “Glycoscience program funds training and technology,” commonfund.nih.gov. The shortfall is most severe in emerging markets where recruiting incentives cannot match multinational budgets, delaying technology transfer and slowing the glycomics market rollout.
*Our forecasts treat driver/restraint impacts as directional, not additive. The impact forecasts reflect baseline growth, mix effects, and variable interactions.
Segment Analysis
By Product Type: Reagents Drive Market Foundation
Reagents and kits generated the largest revenue in 2025, capturing a 37.78% share as each analytical cycle necessitates multiple specialized enzymes, lectins, and derivatization chemicals. The glycomics market size for reagents is set to expand steadily in line with sample throughput growth in both R&D and quality-control labs. Enzymes lead volume escalation, advancing at a 15.18% CAGR through 2031, supported by recombinant production routes that offer higher purity and regulatory acceptance for pharmaceutical workflows. Suppliers emphasize lot-to-lot consistency because minute impurities can skew glycan fingerprints and trigger costly batch failures. Instrument sales trail reagents in absolute value yet remain critical for long-term market stickiness. Vendors bundle service contracts and cloud analytics subscriptions, turning one-time hardware purchases into annuity streams. As new users enter the glycomics market, starter kits that combine sample-prep consumables with SOPs lower adoption hurdles.
The instruments category relies heavily on mass spectrometry upgrades, but inline capillary electrophoresis and emerging nanopore sequencers add diversity. Each technology class spurs distinct reagent demand, including fluorescent dyes for HPLC and capture probes for microarrays. Laboratories optimize workflows across platforms, creating cross-selling opportunities. Over the forecast window, reagents will remain the foundation of the glycomics market because every sample analyzed drives recurring consumable spend, and expanded clinical testing will magnify that multiplier effect.


By Technology: Mass Spectrometry Leads Innovation
Mass spectrometry held 40.92% of overall revenue in 2025 and will stay dominant because it delivers definitive linkage and site information. Users embrace time-of-flight and Orbitrap hybrids that pair speed with ultra-high mass accuracy, shortening identification cycles. As infrastructure builds out, the glycomics market size for microarray and chip-based platforms rises fastest, climbing at 14.32% CAGR through 2031. Miniaturized arrays enable high-throughput screening, which appeals to vaccine developers who need thousands of antigen variants screened under budget constraints. Regulatory validation of lectin microarrays for monoclonal antibody lot release widened commercial acceptance.
HPLC and UHPLC remain staples because they integrate seamlessly into existing QC labs. Capillary electrophoresis retains niche status for charge-variant resolution of acidic glycans. The technology landscape is shifting toward integrated multi-modal systems that fuse front-end separations with MS detection and AI-based structure calling. Software platforms that automate data reduction are now decisive in purchase decisions because they relieve staff shortages and enable smaller labs to enter the glycomics market. Over time, instrument makers that combine hardware, reagents, and bioinformatics will secure a broader installed base and raise switching costs.
By Application: Drug Discovery Dominates
Drug discovery and development generated 45.57% of total demand in 2025, underlining the pharmaceutical sector’s dependence on precise glycan analytics for biologic potency and safety. Detailed glycoform mapping is mandatory for regulatory filings of monoclonal antibodies and fusion proteins. The application also benefits from pipeline diversification into antibody-drug conjugates and next-generation cell therapies whose efficacy depends on surface glycan engineering. Vaccine development is the quickest riser with a 14.21% CAGR, catalyzed by pandemic-era lessons that viral glycosylation can mask or reveal neutralizing epitopes. Future mRNA and protein-subunit vaccines will incorporate glycan optimization earlier in design cycles, pulling in additional analytical spend.
Diagnostics is shifting from research to clinical utility as glycoproteomic panels deliver earlier and more specific detection of cancers and metabolic disorders. Hospitals pilot kits that measure IgG-N glycans to stratify disease risk, a move that will spur routine testing once reimbursement codes expand. Academic research continues to contribute baseline method innovation by leveraging grant programs that subsidize instrument access, cushioning the glycomics market against macroeconomic volatility.
By End User: Pharma Companies Lead Adoption
Pharmaceutical and biotechnology firms contributed 48.62% of 2025 revenue, reflecting their need for in-house control of critical quality attributes during biologic development. These companies fund dedicated glycomics core labs and subscribe to enterprise informatics suites that centralize data across global sites. Contract research organizations deepen service menus with glycan mapping to win outsourcing projects, importing instrumentation in bulk and boosting reagent purchases.
Hospitals and clinical laboratories will grow fastest at 14.98% CAGR as regulatory bodies approve diagnostic assays that use glycan signatures to predict therapy response. Early adopters demonstrate shorter patient stratification timelines, encouraging peer institutions to follow. Academic and government institutes remain essential end users because they pioneer new assay formats and validate clinical relevance, feeding discoveries back to industry. Collectively, heterogeneous end-user demand insulates the glycomics market from single-sector downturns.
Geography Analysis
North America retained 38.10% share of the glycomics market in 2025 thanks to sustained NIH funding and an advanced biopharma manufacturing base. The FDA’s validated protocols for glycan profiling now streamline lot-release testing, prompting tool vendors to locate demo centers near Boston, San Diego, and Toronto. Universities such as the University of Georgia received an USD 18 million NSF award to democratize glycoscience infrastructure, creating regional training hubs that seed future adoption.
Europe ranks second in revenue, anchored by Germany’s instrumentation expertise, the United Kingdom’s biologics accelerators, and France’s vaccine institutes. Pan-European regulatory alignment promotes shared validation studies, lowering compliance costs and fostering cross-border collaborations. Contract research organizations in Ireland and the Netherlands provide specialized glycan analysis for U.S. and Asian sponsors, linking continents within a global supply chain.
Asia-Pacific is the fastest climber with a 14.09% CAGR to 2031. China’s shift toward high-value biologics drives demand for glycan monitoring as plants aim for FDA and EMA licensure. Japanese instrument makers ship high-end MS systems to local universities, while South Korean CDMOs bundle glyco-engineering services for Western clients. Southeast Asian nations benefit from China’s capacity diversification strategy, receiving technology transfers and joint ventures that broaden the regional customer base. India’s biosimilar manufacturers pursue U.S. market approvals, further boosting the glycomics market. Australia leverages national research grants to study glycan roles in neurodegeneration, anchoring Oceania’s contribution. Together these dynamics expand the addressable installed base and strengthen long-term revenue visibility.

Competitive Landscape
The glycomics market is moderately fragmented. No single vendor exceeds a one-third share, and the top five suppliers collectively hold roughly half of global revenue, leaving room for emerging specialists. Thermo Fisher Scientific, Agilent Technologies, Waters Corporation, and Bruker command strong brand recognition and extensive service networks. They bundle MS hardware, chromatography columns, and software, which appeals to pharmaceutical clients seeking validated end-to-end solutions. New England Biolabs focuses on high-purity recombinantly expressed enzymes, carving a niche among quality-conscious users.
Strategic transactions shape competition. Astellas Pharma agreed to pay up to USD 784 million to Go Therapeutics for glycoproteomic cancer programs, signaling big-pharma appetite for external innovation. Pentixapharm acquired Glycotope’s discovery unit to enrich radiopharmaceutical targeting. Instrument makers partner with cloud AI firms to integrate automated structure elucidation, reducing customer reliance on scarce expert staff. Vendors that offer subscription analytics lock in multiyear revenue and increase switching costs.
Price competition remains limited because performance differentiation is high and reagent quality directly affects regulatory outcomes. Yet as clinical labs scale up, demand for mid-range instruments may invite lower-cost entrants from Asia, intensifying rivalry over time. Overall, suppliers that combine hardware, reagents, and data analytics stand to gain share as customers favor single-vendor accountability.
Glycomics Industry Leaders
Thermo Fisher Scientific Inc.
Agilent Technologies Inc.
Merck KGaA (Sigma-Aldrich)
Bruker Corporation
Danaher (SCIEX)
- *Disclaimer: Major Players sorted in no particular order

Recent Industry Developments
- April 2025: Glycomine closed a USD 115 million Series C financing to advance glycobiology-based rare-disease therapies.
- March 2025: Bruker launched glyco-PASEF workflow and Spectronaut 18 software for ultra-sensitive glycopeptide analysis.
- January 2025: Waters released BioResolve Protein A Affinity Columns that improve antibody titer measurement by up to seven-fold.
- October 2024: GlycoMimetics agreed to be acquired by Crescent Biopharma, combining glycobiology assets with oncology pipelines.
- August 2024: Pentixapharm bought Glycotope’s target-discovery business, adding preclinical antibodies for tumor-associated carbohydrate structures.


Research Methodology Framework and Report Scope
Market Definitions and Key Coverage
Our study treats the glycomics market as all laboratory-grade enzymes, kits, reagents, and dedicated analytical instruments (for example, mass spectrometers, HPLC/UHPLC systems, microarrays, and lectin-affinity platforms) that enable structural elucidation of glycans across drug discovery, diagnostics, and academic research settings.
Scope exclusion: basic chromatography or proteomics hardware that is not configured for glycan work, as well as pure bioinformatics-only services, falls outside this assessment.
Segmentation Overview
- By Product Type
- Instruments
- Reagents & Kits
- Enzymes
- By Technology
- Mass Spectrometry
- HPLC & UHPLC
- Capillary Electrophoresis
- Microarray & Chip-Based Platforms
- Lectin-Affinity Assays
- Other Techniques
- By Application
- Drug Discovery & Development
- Diagnostics
- Academic Research
- Biopharmaceutical Production
- Vaccine Development
- By End User
- Pharmaceutical & Biotechnology Companies
- Academic & Research Institutes
- Contract Research Organizations
- Hospitals & Clinical Laboratories
- Geography
- North America
- United States
- Canada
- Mexico
- Europe
- Germany
- United Kingdom
- France
- Italy
- Spain
- Rest of Europe
- Asia-Pacific
- China
- Japan
- India
- Australia
- South Korea
- Rest of Asia-Pacific
- Middle East & Africa
- GCC
- South Africa
- Rest of Middle East & Africa
- South America
- Brazil
- Argentina
- Rest of South America
- North America
Detailed Research Methodology and Data Validation
Primary Research
Mordor analysts interviewed instrument product managers, contract research organizations, and bench scientists spread across North America, Europe, and high-growth Asian biotech hubs. Conversations clarified real purchase volumes, typical enzyme kit throughput, and regional funding cycles, letting us validate desk estimates and adjust assumptions where gaps appeared.
Desk Research
We began with open datasets from agencies such as the National Institutes of Health, the European Commission's CORDIS grant register, and the World Health Organization to size active research spend on glycobiology. Trade bodies like the International Society for Glycobiology and export-import shipment records (Volza) helped track cross-border kit and enzyme volumes. Company 10-Ks, SEC filings, and peer-reviewed articles in journals indexed on PubMed outlined price bands, installed bases, and pipeline activity. Supplementary context was drawn from D&B Hoovers for company financials and Dow Jones Factiva for transaction news. These sources illustrate, not exhaust, the secondary foundation we used.
Market-Sizing & Forecasting
Top-down modeling converts public R&D outlays, prevalence-linked diagnostic demand, and trade statistics into addressable spend, which is then stress-tested with selective bottom-up checks such as supplier revenue roll-ups and sampled average selling price-by-unit counts. Key variables like NIH glycomics grant disbursements, global Phase I-III trials that list glycan biomarkers, average mass-spec replacement cycles, and Asian biomanufacturing capacity additions feed a multivariate regression that projects value through 2030. Where supplier data were missing, conservative ranges anchored by interview consensus bridged the gap.
Data Validation & Update Cycle
Every draft passes variance checks against external time-series, after which senior reviewers sign off. Reports refresh yearly; material developments (for example, a new glycan array regulatory approval) trigger interim updates, and an analyst reruns the model before each client delivery.
Why Mordor's Glycomics Baseline Commands Reliability
Published estimates differ because firms pick unlike product baskets, refresh cadences, and currency bases.
We acknowledge these variations up front.
Benchmark comparison
| Market Size | Anonymized source | Primary gap driver |
|---|---|---|
| USD 2.13 B (2025) | Mordor Intelligence | - |
| USD 2.26 B (2025) | Global Consultancy A | Includes generalized proteomics reagents; interview validation unclear |
| USD 1.89 B (2023) | Industry Association B | Older base year, no currency normalization, limited Asia coverage |
| USD 2.53 B (2025) | Regional Consultancy C | Forecast built solely on installed instrument base, ignores consumable replenishment |
In sum, the disciplined scope selection, multi-variable modeling, and annual refresh cycle give Mordor Intelligence's figures a balanced, reproducible baseline that decision-makers can trust more than snapshot estimates built on narrower or dated inputs.


Key Questions Answered in the Report
What is the current size of the glycomics market?
The glycomics market stands at USD 2.42 billion in 2026.
How fast is the glycomics market growing?
It is projected to grow at a 13.63% CAGR, reaching USD 4.58 billion by 2031.
Which technology holds the largest share within the glycomics market?
Mass spectrometry leads with 40.92% revenue share in 2025.
Which application area is expanding the fastest?
Vaccine development is the fastest-growing application with a 14.21% CAGR through 2031.
Why is Asia-Pacific considered the fastest-growing region?
Regional growth is driven by China’s push into biologics manufacturing and increased healthcare investment across emerging markets.
What restraints could slow near-term growth?
High workflow costs and a shortage of skilled glycobiologists currently limit broader adoption, especially in emerging economies.
Page last updated on:


