Market Overview
| Study Period | 2020 - 2031 |
|---|---|
| Forecast Data Period | 2026 - 2031 |
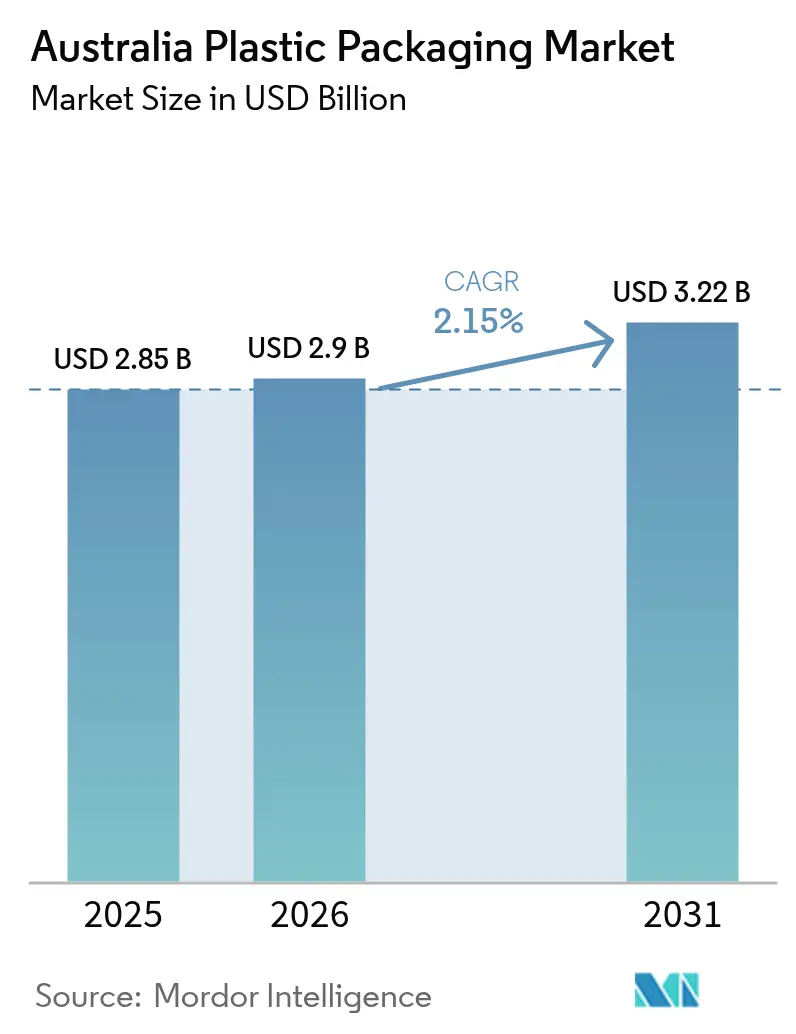
| Base Year Market Size (2025) | USD 2.85 Billion |
| Market Size (2026) | USD 2.9 Billion |
| Market Size (2031) | USD 3.22 Billion |
| Growth Rate (2026 - 2031) | 2.15% CAGR |
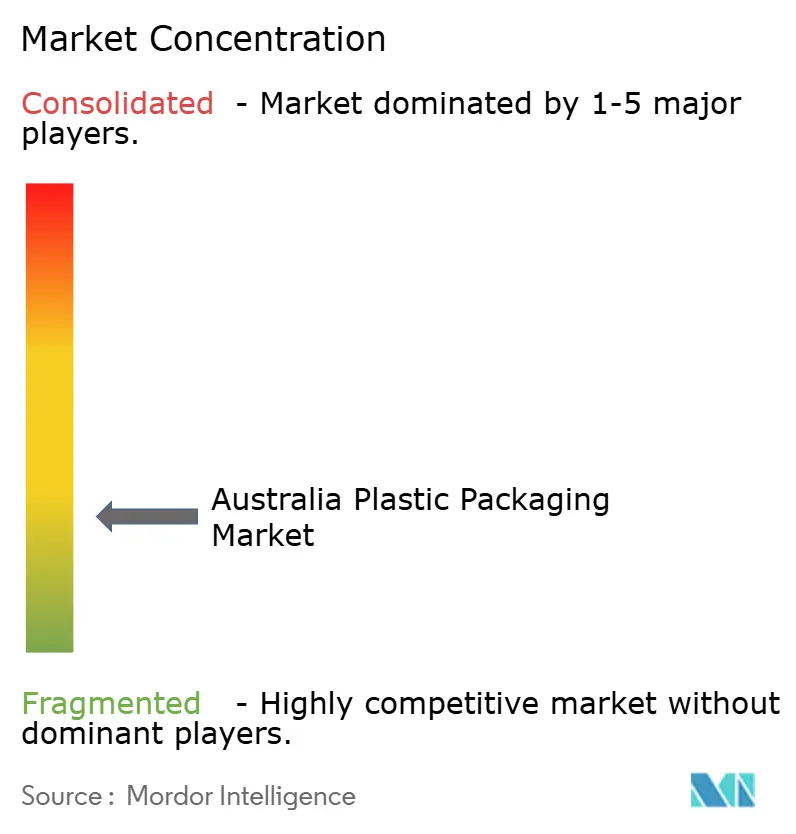
| Market Concentration | Low |
Major Players *Disclaimer: Major Players sorted in no particular order Image © Mordor Intelligence. Reuse requires attribution under CC BY 4.0. | |
Australia Plastic Packaging Market Analysis by Mordor Intelligence
The Australia plastic packaging market size is expected to grow from USD 2.85 billion in 2025 to USD 2.90 billion in 2026 and is forecast to reach USD 3.22 billion by 2031 at 2.15% CAGR over 2026-2031. End-use patterns are pivoting toward food-grade recycled content, flexible designs optimized for e-commerce, and polyethylene terephthalate bottles compatible with state container-deposit schemes. Although absolute tonnage is climbing slowly, segment substitution is accelerating as grocery, beauty, and pharmaceutical brands redesign packs to meet the Australian Packaging Covenant Organisation’s 2025 targets. Polyethylene maintained leadership in 2025, yet polyethylene terephthalate’s stronger growth reflects the premium attached to closed-loop feedstock originating from New South Wales and Victoria deposit systems. Flexible formats such as pouches and films are gaining volume from rigid containers because they cut material use per unit by up to 70%, lower freight costs on the Brisbane-Sydney-Melbourne corridor, and improve parcel-network efficiency for Australia’s USD 46.23 billion (AUD 69 billion) online retail channel.
Key Report Takeaways
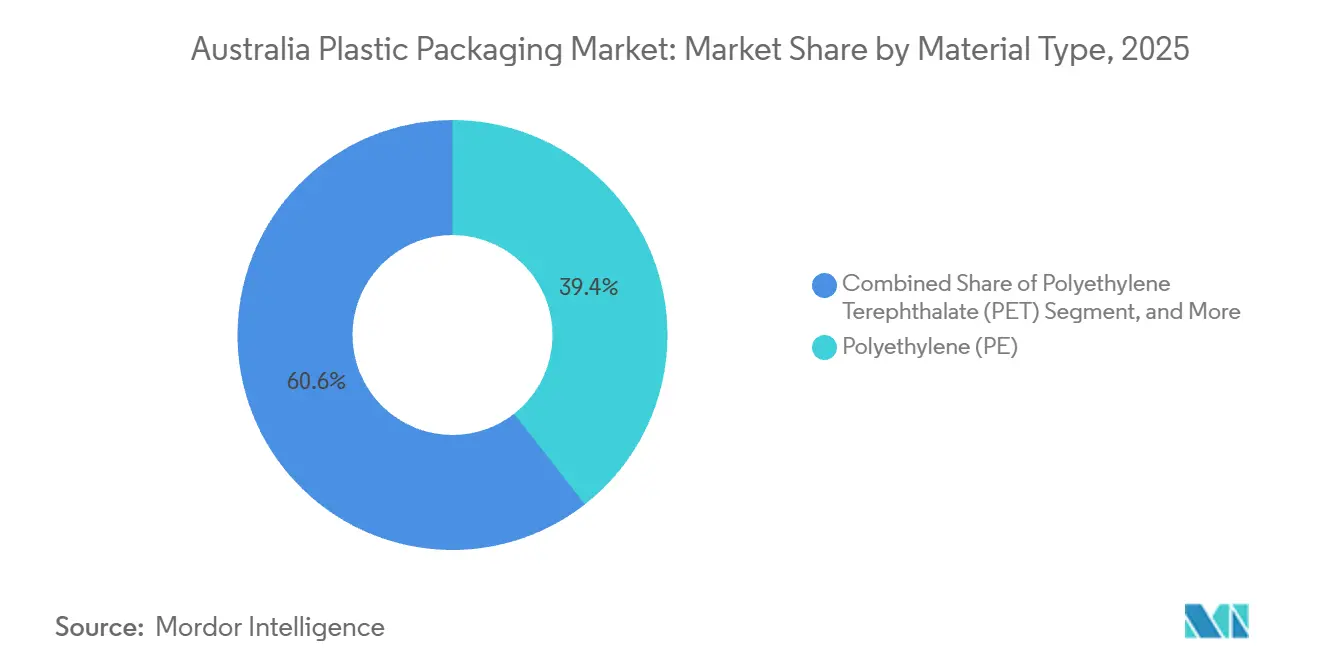
- By material type, polyethylene held 39.44% share of the Australia plastic packaging market size in 2025 while polyethylene terephthalate is projected to expand at a 3.56% CAGR through 2031.
- By packaging type, flexible plastic packaging led with 55.56% share of the Australia plastic packaging market size in 2025 and is advancing at a 3.87% CAGR through 2031.
- By product form, pouches and sachets commanded 31.37% of the Australia plastic packaging market share in 2025, while films and wraps post the highest projected 4.22% CAGR between 2026-2031.
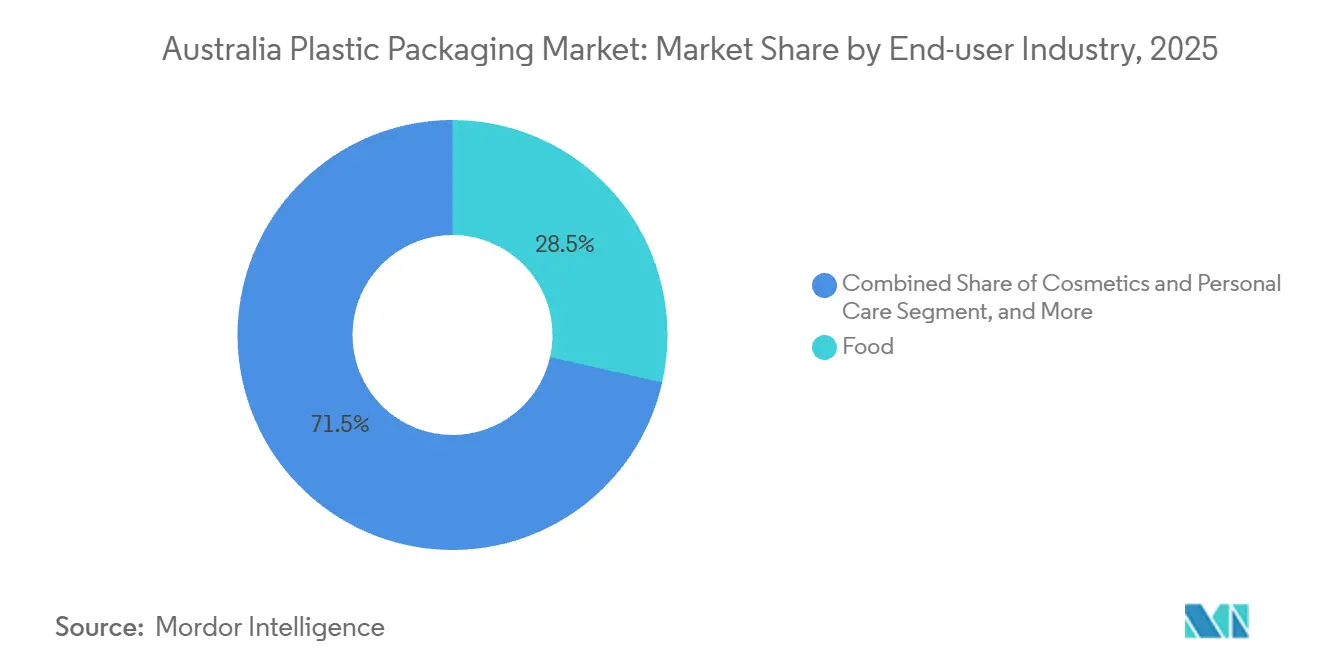
- By end-user industry, food applications accounted for a 28.54% share of the Australia plastic packaging market size in 2025 and cosmetics and personal care is rising at a 3.21% CAGR to 2031.
- By manufacturing process, extrusion captured 30.02% of the Australia plastic packaging market share in 2025 whereas thermoforming is forecast to register a 4.13% CAGR through 2031.
Note: Market size and forecast figures in this report are generated using Mordor Intelligence’s proprietary estimation framework, updated with the latest available data and insights as of 2026.
Australia Plastic Packaging Market Trends and Insights
Drivers Impact Analysis*
| Driver | (~) % Impact on CAGR Forecast | Geographic Relevance | Impact Timeline |
|---|---|---|---|
| Rising Demand for Packaging from the Food and Beverage Sector | +0.6% | National, concentration in New South Wales, Victoria, Queensland | Medium term (2-4 years) |
| E-commerce and Home-Delivery Boom Fueling Lightweight, Protective Formats | +0.5% | National, early gains in Sydney, Melbourne, Brisbane metro areas | Short term (≤ 2 years) |
| Regulatory Push for Eco-Friendly and Recyclable Plastic Packaging Solutions | +0.4% | National, stricter enforcement in New South Wales, Victoria, ACT | Long term (≥ 4 years) |
| Expansion of Domestic Advanced Recycling Capacity Enabling Food-Grade rPET Supply | +0.3% | National, major facilities in Albury, Smithfield, Laverton | Medium term (2-4 years) |
| Harmonized State Container Deposit Schemes Generating High-Quality PET and HDPE Feedstock | +0.2% | National, schemes in six jurisdictions | Long term (≥ 4 years) |
| Federal Circular-Economy Incentives Spurring Regional Investment in Plastics Reprocessing | +0.2% | National, grants in regional NSW, QLD, VIC | Medium term (2-4 years) |
| Source: Mordor Intelligence | |||
Rising Demand for Packaging from fhe Food and Beverage Sector
Food and beverage processors used 28.54% of national plastic packs in 2025, led by protein, dairy, and bakery segments that prioritize barrier properties over recyclability alone. Household formation rose to 9.8 million in 2024, outpacing population growth and fragmenting demand into smaller units that increase packaging intensity per kilogram.[1]Australian Bureau of Statistics, “Household and Family Projections, Australia,” abs.gov.au Beverage players are internalizing feedstock security, illustrated by Asahi’s 500-million-bottle rPET line installed at Albury in 2024. Meat and seafood brands are leaving expanded polystyrene for polypropylene and polyethylene terephthalate trays that satisfy phase-out rules while retaining modified-atmosphere shelf life. Wine houses are moving to polymer bottles and bag-in-box; Packamama’s polymer bottle cuts emissions by 56% compared with glass.
E-commerce and Home-Delivery Boom Fueling Lightweight, Protective Formats
Online retail turnover hit AUD 69 billion (USD 46.23 billion) in 2024 with 9.8 million home-shopping households, forcing converters to design parcels rather than shelf-ready packs. Thin polyethylene mailers and air pillows reduce dimensional weight fees by up to 40% on interstate lanes, a saving amplified on Sydney-Perth hauls exceeding 3,000 kilometers. MasterFoods’ paper-based squeeze packs introduced in November 2024 cut plastic 58% versus bottles and target subscription boxes that rely on mail networks. Brookfarm adopted kerbside-recyclable pouches incorporating a pull-tab that converts the pouch into a rigid shape, improving sortation yield at material recovery facilities. Fulfillment centers adopt gauge-reduced stretch wrap that ships on narrow rolls and slashes plastic kilograms per pallet by 28% relative to 2023 specifications.
Regulatory Push for Eco-Friendly and Recyclable Plastic Packaging Solutions
The Australian Packaging Covenant Organisation mandates 100% recyclable or compostable packaging plus 70% plastics recovery and 20% average recycled content by 2025, but the recovery rate stood at only 14% in 2021-22, leaving a 56-point gap. States add extra layers: New South Wales requires tethered caps by 2030, Victoria is trialing kerbside soft-plastic bins in 30 councils, and Western Australia enforces the nation’s toughest single-use bans.[2]New South Wales Environment Protection Authority, “Plastics Plan 2.0,” epa.nsw.gov.au Soft Plastic Stewardship Australia won an eight-year Australian Competition and Consumer Commission authorisation in November 2025, imposing a AUD 160 (USD 107.2) per-tonne levy on brand owners to finance collection and processing.[3]Australian Competition and Consumer Commission, “Soft Plastic Stewardship Australia response to submissions,” accc.gov.au Multinational groups can spread the levy over broad portfolios, but smaller converters handling 500-1,000 SKUs absorb 3-5 times higher per-unit costs, accelerating consolidation. Federal eco-modulation proposals due 2027 will widen fee differentials between mono-material recyclable packs and difficult-to-recycle laminates.
Expansion of Domestic Advanced Recycling Capacity Enabling Food-Grade rPET Supply
Circular Plastics Australia’s Altona North plant and Pact Group’s Albury site push domestic food-grade rPET throughput to 40,000 tonnes a year, processing 2 billion bottles yet still covering only 60% of local demand. Import reliance exposes converters to price swings between USD 1,200-1,800 per tonne during 2024-2025. Licella and Amcor’s February 2025 pact brings pyrolysis-based chemical recycling into the equation, promising near-virgin quality polymer suitable for pharmaceutical contact without the mechanical yield loss that caps bottle-to-bottle recovery at 75%. iQRenew’s SPEC facility in Taree will rise from 15,000 to 24,000 tonnes of soft-plastic processing thanks to USD 6.10 million (AUD 9.1 million) in federal aid, creating pellets for Australia Post satchels and R.M. Williams shoe boxes. Container deposit schemes processed 9.6 billion units in 2023-24 with contamination below 2%, a clarity level that lets rPET stay in bottle loops instead of downcycling into fiber.
Restraints Impact Analysis*
| Restraint | (~) % Impact on CAGR Forecast | Geographic Relevance | Impact Timeline |
|---|---|---|---|
| Heightened Environmental Activism and Consumer Backlash Against Single-Use Plastics | -0.3% | National, stronger sentiment in ACT, Victoria, NSW urban centers | Short term (≤ 2 years) |
| Escalating Bans and Levies on Problematic Packaging Formats Across States | -0.2% | National, divergent timelines in NSW, Victoria, WA, Queensland | Medium term (2-4 years) |
| Volatile Imported rPET Prices Undermining Domestic Recyclate Competitiveness | -0.1% | National, converters reliant on imported feedstock | Short term (≤ 2 years) |
| Post-REDcycle Collapse Leaving Limited Soft-Plastic Collection Infrastructure | -0.1% | National, acute gaps in regional NSW, Queensland, SA | Medium term (2-4 years) |
| Source: Mordor Intelligence | |||
Heightened Environmental Activism and Consumer Backlash Against Single-Use Plastics
REDcycle’s November 2022 collapse stranded 12,000 tonnes of soft plastics and ignited media framing that cast the failure as systemic, spurring rapid consumer distrust. Woolworths, Coles, and Aldi joined the Soft Plastic Stewardship Australia levy in 2025, yet the scheme projects only 23,000 tonnes of annual recovery by 2033, well below legacy volumes. Retailers delist packs without Australasian Recycling Label certification, compelling suppliers to reformulate or exit a grocery channel that commands 65% of national food spend. Social-media campaigns can cut brand sales 5-10% within weeks, shrinking packaging decision cycles from 18 months to as little as six. Pro-Pac Packaging’s voluntary administration in October 2025 after losing recycled-content-centric contracts signals the revenue risks attached to sustainability gaps. Early movers such as MasterFoods and SIG have already captured shelf space with 58% plastic-reduced and recycle-ready formats that comply with incoming regulations.
Escalating Bans and Levies on Problematic Packaging Formats Across States
Australia’s federation results in seven separate rulebooks, raising compliance costs to as much as USD 335,000 (AUD 500,000) per annum for brands operating nationwide. New South Wales orders tethered caps by 2030, Victoria pilots kerbside soft-plastic bins, and Western Australia enforces the widest single-use prohibitions, forcing converters into parallel inventory streams. The AUD 107.2 (USD) per-tonne Soft Plastic Stewardship levy only hits business-to-consumer films, giving industrial stretch wrap a free pass that distorts competition. Expanded polystyrene bans eliminated 8,000 tonnes of demand during 2024-2025, but leave processors to choose between polyethylene terephthalate, polypropylene, or pulp alternatives, each with disparate cost curves. Orora exited closures in February 2025 to avoid AUD 13.4-20.1 million (AUD 20-30 million) in tethered-cap mold upgrades, underlining how regulation can redirect capital allocation.
*Our forecasts treat driver/restraint impacts as directional, not additive. The impact forecasts reflect baseline growth, mix effects, and variable interactions.
Segment Analysis
By Material Type: PET Gains On Food-Grade Recycling Push
Polyethylene commanded 39.44% share of the Australia plastic packaging market size in 2025, propelled by high-density milk bottles, low-density films, and linear low-density stretch wraps. Polyethylene terephthalate is set to outpace at a 3.56% CAGR as container-deposit feedstock lifts recycled content availability and beverage brands chase closed loops. Circular Plastics Australia converts 2 billion bottles yearly at Altona North and Laverton, yet imports supply 40% of national food-grade needs, exposing buyers to volatile landed prices. Polypropylene ranks third, but only 3% of packs carried recycled polypropylene in 2017-18, explaining the material’s push for breakthroughs such as Martogg’s no-tooling-change rPP launched 2024. Polystyrene is retreating fast following bans in three states, with reusable KoolPak solutions replacing foam in cold-chain niches. Lesser materials, including polyvinyl chloride and bio-based polyethylene, remain marginal due to recyclability concerns and cost premiums.
Although polyethylene will retain scale through 2031, its below-market growth mirrors maturity in bags and agricultural films hit by single-use crackdowns. Meanwhile, polyethylene terephthalate’s rise is anchored in bottle-to-bottle loops that deliver near-virgin aesthetics without compromising food safety, a property validated by Asahi’s Albury line and Licella’s chemical-recycling venture. Polypropylene may accelerate once Martogg’s solution completes Therapeutic Goods Administration approvals, bridging the gap between recycled-content mandates and actual supply. Industry players tracking the Australia plastic packaging market watch closely whether state governments harmonize post-consumer collection for polypropylene, a step that would standardize feedstock quality and unlock economies of scale. Should that occur, polypropylene could challenge polyethylene’s dominance in food trays and cosmetics jars by the late forecast horizon.


By Packaging Type: Flexible Formats Capture E-Commerce Upside
Flexible plastic packaging controlled 55.56% of Australia plastic packaging market share in 2025 and will expand at a 3.87% CAGR through 2031 on the strength of pouches, sachets, and e-commerce mailers. MasterFoods’ USD 2.01 million (AUD 3 million) paper-based squeeze pack, Detpak’s 71% plastic-reduced grape bags, and Brookfarm’s kerbside-recyclable cereal pouches demonstrate how mono-material laminates can meet recyclability goals without sacrificing functionality. The horizontal and vertical form-fill-seal machinery backlog rose double digits in 2025 as converters installed new lines for meal-kit and personal-care business. Ultra-thin stretch film lowered resin kilograms per pallet by nearly a third between 2020 and 2025, underlining freight-cost leverage across the east-coast freight spine. Flexible packs are also absorbing applications once served by rigid PET jars, such as confectionery and instant coffee, as brands exploit the billboard effect of high-definition flexographic inks.
Rigid plastic packaging held 44.44% share in 2025, and its 0.43% CAGR reflects saturation in beverage bottles notwithstanding Asahi’s 500-million-unit rPET push. Blow-molders face lightweighting pressure; average beverage bottle weight dropped from 28 grams in 2020 to 24 grams in 2025, slicing tonnage despite steady volumes. Thermoformed polypropylene dairy tubs and polypropylene jars for premium cosmetics remain bright spots due to elevated margins that justify recycled-content premiums. Nevertheless, converters scaling rigid capacity face regulatory uncertainty, especially around tethered caps and colorant restrictions that may require further mold investment before 2030. As a result, multinational majors within the Australia plastic packaging market are funneling capital toward high-barrier laminates for medical and nutraceutical uses where differentiation offsets slower unit growth.
By Product Form: Films Outpace Pouches On Gauge Reduction
Pouches and sachets owned 31.37% of market share in 2025, winning favor in coffee, confectionery, and pet food where resealability and in-pack cooking are valued. Yet films and wraps post a faster 4.22% CAGR to 2031 as fulfillment centers pursue 30-micron mailers that slice freight charges and minimize breakage in parcel networks. The Australia plastic packaging market size devoted to films grew sharply after e-grocers substituted padded boxes with co-extruded mailers lined with air pillows that use 80% less resin per shipment. Wash-off label technologies introduced by UPM Raflatac in 2025 deliver 99.94% adhesive removal, elevating clear rPET bale purity and reducing yellowing during multiple recycling cycles.
Bottle and jar volumes plateau because beverage brands shift to aluminum and bag-in-box, while trays and containers reinvent themselves in polypropylene and polyethylene terephthalate as foam exits food retail. Bags and sacks, once a high-volume channel, contract under reusable-bag mandates and compostable alternatives. Niche forms such as closures, clamshells, and blister packs must navigate Therapeutic Goods Administration tamper-evident codes and state tethered-cap rules, demanding costly tooling. Consequently, films become the fastest lever for converters chasing volume in the Australia plastic packaging market because gauge reduction can roll out inside six months without capital-heavy equipment changes.
By End-User Industry: Cosmetics Outgrow Food On Premium Formats
Food maintained the highest 28.54% share of the Australia plastic packaging market size in 2025, reflecting protein, dairy, and bakery reliance on oxygen barriers and modified-atmosphere packs. Growth moderates to 2.1% CAGR as retailers enforce reusable or recyclable guidelines and consumers shift toward fresh produce with minimal packaging. Cosmetics and personal care accelerates at 3.21% CAGR through 2031 as dermatological and prestige brands invest in recyclable polypropylene jars and refill cartridges that carry 40-60% gross margins. Beauty conglomerates harmonize global specs, so Australian units piggyback on European Union and California design pilots, compressing local launch lead times. Beverage ranks second in volume but shows flat growth as aluminum cans and bag-in-box wine siphon share from polyethylene terephthalate bottles.
Pharmaceutical-grade packs move at a 2.5% clip under aging demographics and chronic-disease prevalence. Therapeutic Goods Administration rules for child-resistant closures and blister-pack tamper evidence drive demand for precision injection and thermoform lines. Industrial segments grow 1.8% due to mining-sector cyclicality yet remain vital for bulk drums and intermediate bulk containers. Electronics, automotive, and appliances stay niche but could benefit from extended-producer-responsibility frameworks expected 2027. Cosmetics’ surge over food demonstrates how high-margin categories can absorb recycled-content premiums, a critical dynamic shaping future capital allocation within the Australia plastic packaging market.
By Manufacturing Process: Thermoforming Gains On Foam Replacement
Extrusion represented 30.02% of Australia plastic packaging market share in 2025, producing the bulk of blown and cast films for grocery, agriculture, and industrial stretch wrap. Thermoforming, however, charts a 4.13% CAGR through 2031 on the back of expanded polystyrene tray substitution in meat and seafood. The method’s tooling is 60-70% cheaper than injection molding, and cycle times of 8-12 seconds suit regional processors running sub-million unit batches. Pact and Circular Plastics Australia have joined forces to supply rPET sheet that thermoforms seamlessly on existing lines, eliminating down-gauging limitations.
Injection molding still holds the second-largest share and gains a shot in the arm from Impact International’s USD 335 million (AUD 500 million) project aimed at industrial components, but food and beauty converters hesitate to add high-capex presses ahead of tethered-cap mandates. Blow molding grows modestly at 2.3% due to bottle lightweighting goals and aluminum migration. Rotational and compression molding remain niche, reserved for specialty tanks and closures. Altogether, thermoforming stands out as the immediate beneficiary of regulatory foam bans, supporting a new wave of rPET and rPP adoption that will reshape the Australia plastic packaging market by 2031.
Geography Analysis
Australia’s plastic packaging consumption is concentrated along the eastern seaboard where Brisbane, Sydney, and Melbourne account for roughly 65% of national demand. New South Wales and Victoria together captured about 55% of the Australia plastic packaging market share in 2025, leveraging dense food-processing hubs in Sydney’s west and Melbourne’s northern arc. Proximity to container-deposit feedstock and advanced recycling at Altona North, Smithfield, and Laverton reduces logistics cost for rPET and rHDPE, giving local converters a competitive cost-of-goods edge. Queensland followed with near 20% share supported by Visy’s USD 469 million (AUD 700 million) multiyear investment package that includes a Yatala glass plant capable of 1 billion bottles a year and a Hemmant corrugated complex supplying fresh-produce exporters.
Western Australia, South Australia, Tasmania, the Northern Territory, and the Australian Capital Territory jointly represented about 25% of 2025 demand. Freight distance to east-coast rPET processors and the small scale of local recovery infrastructure inflate material costs, nudging Perth converters toward reusable or fiber-based systems compliant with Western Australia’s strict single-use bans. Regional New South Wales and Queensland illustrate collection gaps post-REDcycle, prompting iQRenew’s Taree expansion yet still leaving inland communities reliant on interstate trucking of baled films at non-economic rates. Tasmania and the Northern Territory lack in-state rPET facilities, compelling brands to import virgin resin or ship feedstock over Bass Strait, which can add USD 0.06 per kilogram to material cost.
State policy divergence shapes investment. New South Wales drives Sydney-based closure mold upgrades ahead of the 2030 tethered-cap deadline. Victoria’s kerbside soft-plastic pilot already registers 92.4% household participation and sub-2% contamination, outperforming mature New South Wales schemes and setting a template other states may emulate. Western Australia’s comprehensive ban schedule is steering Perth firms into mono-material polypropylene barrier trays and pulp-molded food service lines. Queensland’s deposit scheme, linked digitally to brand ownership, provides granular data that underpins Visy’s vertically integrated model, reinforcing the state’s emerging status as a recycling and remanufacturing hub for the broader Asia-Pacific.
Competitive Landscape
The Australia plastic packaging market remains fragmented/ Amcor’s USD 13 billion takeover of Berry Global vaulted the group to global leadership and set off a review that could divest slower-growing rigid beverage assets, widening openings for mid-tier bottle converters. Visy’s vertically integrated play spanning kerbside collection, material recovery, polymer reprocessing, and converting insulates earnings from feedstock swings but demands continuous capital injections exceeding USD 1.34 billion (AUD 2 billion) over ten years. Pact Group’s July 2025 delisting signals a pivot to long-horizon privately funded infrastructure after USD 70.35 million (AUD 105 million) worth of 2024 plant upgrades. Orora offloaded its closures arm rather than invest USD 13.4-20.1 million in tethered-cap retooling, refocusing on glass and corrugated, whereas Pro-Pac Packaging’s administration underscores the commercial cost of lagging on recycled-content offers.
Niche disruptors are scaling by targeting regulatory pain points. iQRenew leverages federal grants to fill post-REDcycle soft-film gaps, funneling pellets into Australia Post satchels and R.M. Williams packaging. Martogg’s patent-pending recycled polypropylene lowers barriers for converters seeking food-grade rPP without million-dollar mold modifications. Licella’s chemical-recycling alliance with Amcor could deliver feedstock that meets pharmaceutical contact rules, skipping mechanical impurities. White-space opportunities lie in Therapeutic Goods Administration-compliant child-resistant closures, cosmetic airless dispensers incorporating 50% rPP, and industrial drums under closed-loop leasing arrangements that sidestep single-use constraints.
Strategic moves center on securing feedstock and scaling flexible capacity. Amcor increased its stake in ePac, gaining digital pouch printing that cuts minimum order quantities to 5,000 units, ideal for rapid private-label iterations. Visy launched an aluminum can with 83% recycled content, aligning beverage clients with higher-deposit redemption rates. Pact won United States Food and Drug Administration clearance for rFresh100 rHDPE resin in dairy bottles, a credential that underlines Australia’s role as a test bed for food-grade recycled innovations before export to North America. As consolidation proceeds, the balance between mega-mergers and specialist niches will define competitive intensity through the forecast horizon.
Australia Plastic Packaging Industry Leaders
Amcor plc
Visy Industries Australia Pty Ltd
Orora Packaging Australia Pty Ltd
Pact Group Holdings Ltd
Pro-Pac Packaging Ltd
- *Disclaimer: Major Players sorted in no particular order

Recent Industry Developments
- January 2026: Visy began cold commissioning of its Yatala glass plant, set to produce 1 billion bottles annually once commercial runs start mid-2026.
- December 2025: Impact International announced USD 335 million (AUD 500 million) for new injection-molding capacity targeting automotive and industrial clients.
- December 2025: Australia Post and R.M. Williams launched a circular mailer made with 100% Australian recycled soft plastics sourced from iQRenew’s SPEC facility.
- November 2025: The Australian Competition and Consumer Commission granted Soft Plastic Stewardship Australia an eight-year authorisation including a USD 107.2 (AUD 160) per-tonne levy on brand owners.


Australia Plastic Packaging Market Report Scope
Plastics are used in packaging materials for food, beverages, and oil. They are used mainly because of their performance, cost-effectiveness, and durability. Depending on the type of product being packed, plastics can be of different grades and material combinations, such as polyethylene, polypropylene, and polyvinyl chloride.
The Australia Plastic Packaging Market Report is Segmented by Material Type (Polyethylene, Polypropylene, Polyethylene Terephthalate, Polystyrene and EPS, and Other Material Types), Packaging Type (Flexible Plastic Packaging, and Rigid Plastic Packaging), Product Form (Bottles and Jars, Trays and Containers, Pouches and Sachets, Bags and Sacks, Films and Wraps, and Other Product Forms), End-User Industry (Food, Beverage, Pharmaceuticals and Healthcare, Cosmetics and Personal Care, Industrial, and Other End-user Industries), Manufacturing Process (Extrusion, Injection Molding, Blow Molding, Thermoforming, and Other Manufacturing Processes). The Market Forecasts are Provided in Terms of Value (USD).
By Material Type
| Polyethylene (PE) |
| Polypropylene (PP) |
| Polyethylene Terephthalate (PET) |
| Polystyrene and EPS |
| Other Material Types |
By Packaging Type
| Flexible Plastic Packaging |
| Rigid Plastic Packaging |
By Product Form
| Bottles and Jars |
| Trays and Containers |
| Pouches and Sachets |
| Bags and Sacks |
| Films and Wraps |
| Other Product Forms |
By End-User Industry
| Food |
| Beverage |
| Pharmaceuticals and Healthcare |
| Cosmetics and Personal Care |
| Industrial |
| Other End-user Industries |
By Manufacturing Process
| Extrusion |
| Injection Molding |
| Blow Molding |
| Thermoforming |
| Other Manufacturing Processes |
| By Material Type | Polyethylene (PE) |
| Polypropylene (PP) | |
| Polyethylene Terephthalate (PET) | |
| Polystyrene and EPS | |
| Other Material Types | |
| By Packaging Type | Flexible Plastic Packaging |
| Rigid Plastic Packaging | |
| By Product Form | Bottles and Jars |
| Trays and Containers | |
| Pouches and Sachets | |
| Bags and Sacks | |
| Films and Wraps | |
| Other Product Forms | |
| By End-User Industry | Food |
| Beverage | |
| Pharmaceuticals and Healthcare | |
| Cosmetics and Personal Care | |
| Industrial | |
| Other End-user Industries | |
| By Manufacturing Process | Extrusion |
| Injection Molding | |
| Blow Molding | |
| Thermoforming | |
| Other Manufacturing Processes |


Key Questions Answered in the Report
How large will the Australia plastic packaging market be by 2031?
It is projected to reach USD 3.22 billion by 2031, expanding at a 2.15% CAGR from 2026-2031.
Which segment is growing fastest within national plastic packaging?
Films and wraps lead growth at a 4.22% CAGR because e-commerce operators prefer ultra-thin mailers and stretch film.
Why is polyethylene terephthalate gaining share against polyethylene?
Container deposit schemes supply high-purity rPET that lets beverage and beauty brands close loops, driving a 3.56% CAGR for PET.
How are state policies influencing packaging investment?
Divergent bans and levies require separate compliance strategies, prompting mold upgrades in New South Wales and soft-plastic pilots in Victoria.
What strategies are majors using to secure recycled feedstock?
Firms such as Visy and Amcor invest in vertical integration, deposit-scheme recovery, and chemical recycling partnerships to lock in food-grade supply.
Page last updated on:


