Solar Vehicle Market Size and Share
Market Overview
| Study Period | 2020 - 2031 |
|---|---|
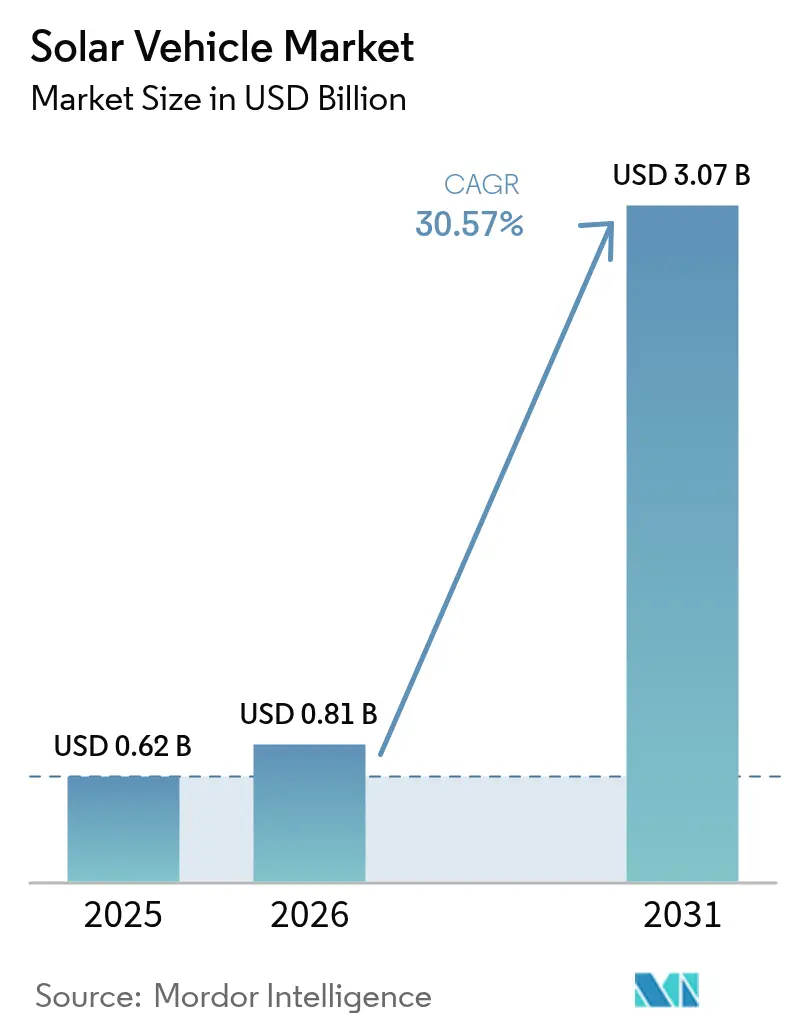
| Market Size (2026) | USD 0.81 Billion |
| Market Size (2031) | USD 3.07 Billion |
| Growth Rate (2026 - 2031) | 30.57% CAGR |
| Fastest Growing Market | Asia Pacific |
| Largest Market | Asia-Pacific |
| Market Concentration | Low |
Major Players
*Disclaimer: Major Players sorted in no particular order Image © Mordor Intelligence. Reuse requires attribution under CC BY 4.0. |
|
Solar Vehicle Market Analysis by Mordor Intelligence
The solar vehicle market size was valued at USD 0.62 billion in 2025 and estimated to grow from USD 0.81 billion in 2026 to reach USD 3.07 billion by 2031, at a CAGR of 30.57% during the forecast period (2026-2031). Declining photovoltaic (PV) costs, now below prevailing grid electricity prices in major electric-vehicle regions, combine with emerging solid-state batteries to make vehicle-integrated solar systems economically viable. Early adopters gain from zero-emission fleet mandates such as the EU Fit-For-55 package and California’s Advanced Clean Trucks regulation, underpinning reliable order pipelines for OEMs. Competitive intensity rises as legacy automakers accelerate solar-roof programs while specialists refine lightweight chassis that maximize surface area for PV skins. Demand also reflects rising interest in bidirectional vehicle-to-grid models that transform cars and trucks into mobile power assets during peak electricity demand.
Key Report Takeaways
- By vehicle type, passenger cars led with 98.46% of the solar vehicle market share in 2025, while commercial vehicles are forecast to post the fastest CAGR at 53.12% through 2031.
- By electric-drivetrain type, hybrid electric vehicles dominated with 99.05% of the solar vehicle market share in 2025; battery electric vehicles are projected to expand at a 58.47% CAGR to 2031.
- By battery chemistry, lithium-ion packs accounted for 86.74% of the solar vehicle market in 2025, whereas solid-state lithium-metal batteries are expected to grow at a 57.96% CAGR to 2031.
- By solar-panel technology, polycrystalline silicon captured 98.82% of the solar vehicle market size in 2025 deployments, while thin-film perovskite solutions are advancing at a 59.41% CAGR to 2031.
- By charging architecture, solar-plus-plug-in hybrids held 81.52% of the solar vehicle market share in 2025, with on-board solar-only systems set to rise at 56.11% CAGR to 2031.
- By geography, Asia-Pacific commanded 56.21% of the 2025 solar vehicle market share and is forecast to register the highest regional CAGR of 37.12% to 2031.
Note: Market size and forecast figures in this report are generated using Mordor Intelligence’s proprietary estimation framework, updated with the latest available data and insights as of 2026.
Global Solar Vehicle Market Trends and Insights
Drivers Impact Analysis*
| Driver | (~) % Impact on CAGR Forecast | Geographic Relevance | Impact Timeline |
|---|---|---|---|
| Declining Solar-PV LCOE Below Grid Electricity in Major EV Markets | +8.2% | Global, with Early Gains in China, California, Germany | Medium term (2–4 years) |
| Government Zero-Emission Fleet Mandates (EU Fit-For-55, California ACT, etc.) | +7.5% | North America and EU, Spill-Over to Asia-Pacific | Short term (≤ 2 years) |
| Emerging Bidirectional V2G Revenue Models for Fleet Owners | +6.3% | Global, with Early Gains in California, Netherlands, Japan | Medium term (2–4 years) |
| Battery-to-Wheel Efficiency Gains from Integrated PV Skins | +5.1% | Global | Medium term (2–4 years) |
| Solid-State Battery Breakthroughs Enabling Ultra-Light Solar Chassis | +4.7% | Asia-Pacific Core, Spill-Over to North America | Long term (≥ 4 years) |
| Premium-Segment OEM Branding Advantages from "Energy-Autonomous" Badges | +3.8% | North America and EU | Short term (≤ 2 years) |
| Source: Mordor Intelligence | |||


Declining Solar-PV LCOE Below Grid Electricity in Major EV Markets
Solar photovoltaic levelized cost of electricity has achieved grid parity across key electric vehicle adoption regions, fundamentally altering the economic calculus for vehicle-integrated solar systems. Fraunhofer ISE's 2024 analysis demonstrates that solar-plus-battery storage configurations now deliver electricity at costs 20-30% below conventional grid rates in California, Germany, and eastern China[1]"Research for the energy transition", Fraunhofer Institute for Solar Energy Systems ISE, ise.fraunhofer.de.. This cost advantage creates a compelling value proposition for solar vehicle owners who can achieve energy independence while reducing operational expenses. The trend accelerates as utility-scale solar manufacturing capacity reaches 1.8 terawatts globally by 2025, driving further cost reductions through economies of scale. Fleet operators benefit from this dynamic, as commercial vehicles with larger roof surfaces can generate sufficient electricity to offset significant portions of their energy consumption. The economic advantage becomes more pronounced in regions with high electricity tariffs and abundant solar irradiation, creating geographic hotspots for solar vehicle adoption.
Government Zero-Emission Fleet Mandates Drive Commercial Adoption
Regulatory frameworks across major automotive markets increasingly mandate zero-emission vehicle adoption in commercial fleets, creating predictable demand for solar-enhanced electric vehicles. The EU's Fit-For-55 package requires 30% of new urban buses to be zero-emission by 2025, rising to 65% by 2030. California's Advanced Clean Trucks regulation mandates that 40% of truck sales be zero-emission by 2030. These mandates particularly favor solar vehicles in commercial applications where extended range and reduced charging infrastructure dependence provide operational advantages. Fleet operators recognize that solar integration can extend vehicle range by 20-30% under optimal conditions, reducing charging frequency and improving route flexibility. The regulatory momentum creates a first-mover advantage for manufacturers developing solar commercial vehicles, as fleet procurement cycles typically span 5-7 years and early compliance positions companies favorably for long-term contracts. Government incentives further amplify adoption by reducing total cost of ownership through tax credits and accelerated depreciation schedules for zero-emission commercial vehicles.
Battery-to-Wheel Efficiency Gains From Integrated PV Skins
Vehicle-integrated photovoltaic systems deliver measurable efficiency improvements by directly powering auxiliary systems and reducing battery drain from climate control and electronics. Mercedes-Benz's solar paint technology, unveiled in 2024, demonstrates how thin-film photovoltaic coatings can generate electricity across the entire vehicle surface rather than being confined to roof panels. This approach maximizes energy capture while maintaining aerodynamic efficiency and aesthetic appeal. Webasto's EcoPeak roof concept generates approximately 350 kilowatt-hours annually, sufficient to power vehicles for 2,500 kilometers without grid charging. The efficiency gains become particularly significant in stop-and-go urban driving, where conventional regenerative braking provides limited energy recovery. Advanced photovoltaic integration also enables vehicles to maintain battery charge during extended parking periods, addressing range anxiety concerns that persist among electric vehicle adopters. These efficiency improvements translate directly into reduced charging costs and extended vehicle range, creating tangible value propositions for consumers and fleet operators.
Premium-Segment OEM Branding Advantages From Energy-Autonomous Positioning
Luxury automotive manufacturers increasingly position solar integration as a premium differentiator that signals environmental leadership and technological sophistication to affluent consumers. Toyota's collaboration with Sharp and NEDO on high-efficiency solar battery trials demonstrate how established manufacturers leverage solar technology to enhance brand positioning in the premium electric vehicle segment. The "energy-autonomous" messaging resonates particularly strongly with environmentally conscious consumers who view solar vehicles as the ultimate expression of sustainable mobility. Premium positioning allows manufacturers to command higher margins while absorbing the additional costs associated with photovoltaic integration and specialized manufacturing processes. Hyundai's nano cooling film technology, which reduces interior temperatures by over 10°C without darkening windows, exemplifies how solar-adjacent innovations create premium value propositions. The branding advantage extends beyond individual consumers to corporate fleet buyers who seek to demonstrate environmental responsibility through vehicle procurement decisions. Early adoption of solar technology establishes manufacturers as innovation leaders and creates competitive moats that are difficult for followers to overcome.
Restraints Impact Analysis*
| Restraint | (~) % Impact on CAGR Forecast | Geographic Relevance | Impact Timeline |
| High Capital Cost of PV-Embedded Body Panels | -4.2% | Global | Short term (≤ 2 years) |
| Lack of Unified Homologation Standards for Road-Legal PV Roofs | -3.1% | Global, with Acute Impact in EU and North America | Medium term (2–4 years) |
| Limited Recycling Infrastructure for Composite PV-Integrated Materials | -2.6% | Asia-Pacific and EU Regulatory Regions | Long term (≥ 4 years) |
| Intermittent Power Output Complicating Standardized Charging Integration | -2.9% | Global, More Acute in Emerging Markets with Weak Grid Support | Medium term (2–4 years) |
| Source: Mordor Intelligence | |||
High Capital Cost of PV-Embedded Body Panels
Manufacturing costs for vehicle-integrated photovoltaic systems remain substantially higher than those of conventional automotive components, creating price barriers that limit mass market adoption. Specialized solar cells designed for automotive applications require custom manufacturing processes that lack the economies of scale achieved in stationary solar installations, resulting in costs 3-4 times higher per watt than standard photovoltaic modules[2]"Flexible solar panels look set to disrupt the industry", Israel21c, israel21c.org. . The integration complexity extends beyond solar cells, including specialized wiring harnesses, power management electronics, and structural modifications that accommodate photovoltaic components while maintaining crash safety standards. Opes Solar Mobility's new factory in Germany, which began production in 2024, represents efforts to achieve manufacturing scale for vehicle-specific photovoltaic modules. However, production costs remain elevated compared to conventional automotive components. The cost premium becomes particularly challenging for mass market vehicles where price sensitivity limits manufacturers' ability to absorb additional component expenses. However, declining photovoltaic material costs and increasing manufacturing volumes suggest that cost barriers will diminish as the market matures and achieves greater scale.
Lack of Unified Homologation Standards for Road-Legal PV Roofs
Fragmented regulatory frameworks across global automotive markets create compliance complexity and increase development costs for manufacturers pursuing solar vehicle commercialization. Vehicle-integrated photovoltaic systems must satisfy both automotive safety regulations and electrical standards, requiring dual certification processes that vary significantly between jurisdictions. The absence of harmonized standards forces manufacturers to develop market-specific solutions rather than leveraging global platforms, increasing engineering costs, and delaying product launches. UNECE regulations provide some framework for vehicle modifications, but specific provisions for solar integration remain underdeveloped, creating regulatory uncertainty that discourages investment[3]"Vehicle Regulations", United Nations Economic Commission for Europe, unece.org. . The complexity intensifies for commercial vehicles that operate across multiple jurisdictions and must comply with varying technical requirements for photovoltaic installations. Industry associations increasingly advocate for unified standards that streamline certification processes and reduce compliance costs, though regulatory harmonization typically requires multi-year development cycles. The regulatory fragmentation particularly impacts smaller manufacturers and startups that lack the resources to navigate multiple certification processes simultaneously.
*Our forecasts treat driver/restraint impacts as directional, not additive. The impact forecasts reflect baseline growth, mix effects, and variable interactions.
Segment Analysis
By Vehicle Type: Commercial Fleets Drive Adoption
Passenger cars commanded 98.46% of the solar vehicle market share in 2025, while commercial vehicles demonstrate the fastest growth trajectory at 53.12% CAGR (2026-2031), reflecting the superior economics of solar integration in fleet applications. Large roof surfaces on trucks, buses, and delivery vehicles enable more extensive photovoltaic installations that generate meaningful energy contributions. At the same time, predictable route patterns allow fleet operators to optimize solar charging strategies. Passenger cars benefit from premium positioning and energy-autonomous branding, particularly in luxury segments where consumers value environmental differentiation over pure economic returns.
The commercial vehicle momentum builds on fleet operators' focus on total cost of ownership optimization and regulatory compliance with zero-emission mandates. Flixbus's deployment of solar panels on intercity coaches demonstrates how commercial operators leverage solar technology to reduce fuel costs and extend electric range on long-distance routes. Fleet applications also benefit from centralized maintenance capabilities and professional drivers who can optimize solar charging through route planning and parking strategies. The commercial segment's growth trajectory suggests that fleet adoption will drive manufacturing scale and cost reductions that eventually benefit passenger car applications.


By Electric-Drivetrain Type: HEV Dominance Shifts to BEV
Hybrid electric vehicles captured 99.05% of the solar vehicle market share in 2025 as manufacturers initially integrated solar systems into existing hybrid platforms to minimize development complexity and regulatory risk. However, battery electric vehicles accelerate at 58.47% CAGR (2026-2031) as solid-state battery technology enables more efficient solar energy storage and utilization. Toyota's roadmap for solid-state batteries, expected to launch within four years, promises to double electric range while reducing costs by 20-40%, creating compelling platforms for solar integration. Plug-in hybrid electric vehicles occupy a middle position, offering flexibility for consumers transitioning from conventional powertrains while incorporating solar charging capabilities.
The shift toward battery electric vehicles reflects improving energy storage efficiency and declining battery costs that make pure electric powertrains more viable for solar applications. Stellantis's partnership with CEA on next-generation battery cell technology demonstrates how manufacturers pursue advanced chemistry solutions that optimize solar energy utilization. The transition also benefits from expanding charging infrastructure that reduces range anxiety and enables solar vehicles to supplement rather than replace grid charging. As battery energy density improves and costs decline, pure electric platforms become increasingly attractive for solar integration due to their simplified powertrains and optimized energy management systems.
By Battery Chemistry: Solid-State Breakthrough Pending
Lithium-ion chemistry maintains 86.74% of the solar vehicle market share in 2025 through established manufacturing infrastructure and proven performance in automotive applications, while solid-state lithium-metal technology surges at 57.96% CAGR as manufacturers pursue next-generation energy storage solutions. Solid-state batteries offer superior energy density and safety characteristics, enabling lighter vehicle designs and more efficient solar energy utilization. However, commercial deployment remains limited by manufacturing complexity and cost considerations. Lead acid chemistry persists in niche applications where cost sensitivity outweighs performance requirements, particularly in commercial vehicles with auxiliary power systems.
The solid-state transition represents a fundamental shift in battery architecture that could unlock solar vehicle potential through improved energy storage efficiency and reduced weight penalties. Lithium-ion systems require thermal management and safety systems that add complexity and weight to solar vehicle designs, while solid-state alternatives promise simplified architectures and enhanced performance. However, manufacturing scale-up challenges and material cost considerations limit solid-state deployment, creating opportunities for manufacturers who successfully navigate the technology transition. The evolution of chemistry also influences solar panel selection, as solid-state batteries can accommodate wider voltage ranges and more variable charging patterns that optimize photovoltaic energy capture.
By Solar-Panel Technology: Perovskite Emergence Accelerates
Polycrystalline silicon technology dominates with 98.82% of the solar vehicle market share in 2025 due to manufacturing maturity and cost advantages. However, thin-film perovskite solutions demonstrate exceptional growth at 59.41% CAGR as efficiency improvements and manufacturing innovations address historical limitations. Perovskite tandem cells achieve laboratory efficiencies exceeding 30% and offer superior performance in low-light conditions that benefit vehicle applications, though durability concerns and material scarcity issues constrain commercial deployment. Monocrystalline silicon maintains a premium position in applications requiring maximum efficiency, while thin-film CIGS technology serves specialized applications where flexibility and weight considerations outweigh efficiency requirements.
The technology transition reflects ongoing research investments and manufacturing innovations that address perovskite's historical weaknesses in stability and scalability. Recent breakthroughs in encapsulation techniques and material formulations suggest that perovskite technology could achieve commercial viability within the forecast period, potentially disrupting established silicon-based supply chains. However, critical material scarcity for indium and other rare elements creates supply chain risks that could limit perovskite adoption despite superior performance characteristics. The evolution of technology also influences vehicle design strategies, as different photovoltaic technologies require varying integration approaches and structural accommodations.

By Charging Architecture: Hybrid Systems Optimize Flexibility
Solar plus plug-in hybrid charging configurations captured 81.52% of the solar vehicle market share in 2025 as consumers and fleet operators prioritize charging flexibility and range assurance over pure solar dependence. Onboard solar-only systems accelerate at a 56.11% CAGR as technology improvements and cost reductions make grid-independent operation more viable for specific applications and geographic regions. The hybrid approach enables vehicles to optimize energy sources based on weather conditions, driving patterns, and electricity pricing. At the same time, pure solar systems appeal to users seeking maximum energy independence and environmental benefits.
Aptera's production-intent solar electric vehicle, advancing toward market readiness in 2025, demonstrates the potential for solar-only architectures in specialized applications where aerodynamic efficiency and lightweight design enable extended solar range. The evolution of charging architecture reflects the improvement of photovoltaic efficiency and battery technology, which gradually expands the feasible operating envelope for solar-only vehicles. However, seasonal irradiation variability and weather dependence favor hybrid systems with backup charging capabilities. The choice of architecture also influences vehicle design and cost structures, as pure solar systems require larger photovoltaic installations and more sophisticated energy management systems to ensure reliable operation.
Geography Analysis
Asia-Pacific accounted for the largest regional slice of the solar vehicle market, reaching 56.21% of the solar vehicle market in 2025 on the back of China’s 90% global PV module output and Japan’s deep R&D bench in high-efficiency cells. Government programs such as China’s “Made in China 2025” and Japan’s NEDO grants fuel local component sourcing advantages that compress bill-of-materials costs. BYD’s cross-border push into Japan illustrates China’s intent to extend manufacturing scale benefits into premium export markets. Toyota and Sharp co-develop tandem cells that maintain domestic competitive parity.
North America traced the second-fastest growth path due to California’s zero-emission mandates and the Inflation Reduction Act’s production tax credits for domestically manufactured solar cells. Pickup trucks and SUVs dominate the region’s vehicle mix, presenting expansive roof real estate for PV arrays. Rivian is piloting community solar programs that feed excess electricity into chargers at its Illinois plant, illustrating potential factory-to-fleet circularity.
Europe offers a mosaic of national incentives underpinned by the EU-wide Fit-For-55 targets. While regulatory certainty exists at the bloc level, divergent VAT breaks and infrastructure density create a patchwork demand profile. Lightyear’s pivot to supplying embedded PV kits after securing EUR 10 million in 2024 demonstrates the capital intensity of full-vehicle production and Europe’s openness to modular supply-chain roles. Germany’s Opes Solar Mobility facility partially derisks EU exposure to Asian module suppliers and supports OEM localization strategies to reduce geopolitical import dependencies.


Competitive Landscape
Market concentration remains low. Traditional automakers leverage manufacturing scale and dealer networks, yet newcomers specialize in thin-film adhesion, ultra-light materials, or aerodynamic designs that legacy firms cannot replicate quickly. Toyota integrates Sharp’s triple-junction cells into the forthcoming bZ7 sedan, aiming at early 2026 availability. Mercedes-Benz unveiled solar paint trials that convert the entire body shell into a generation surface, transforming brand perception and opening aftermarket service lines.
Start-ups pursue lean asset strategies. Aptera outsources battery packs to CTNS, focusing internal resources on composite monocoque manufacturing for weight savings. After insolvency threats, Sono Motors shifted toward licensing its proprietary solar body panels to vans and buses instead of maintaining a full vehicle program. Partnerships between cell specialists and automotive OEMs proliferate; Stellantis pairs with CEA to co-develop solid-state packs poised to integrate seamlessly with roof-mounted PV, shortening time-to-market for next-generation architectures.
Chinese suppliers, buoyed by domestic incentives and scale, enter the competitive arena with aggressive pricing. SAIC units source PV cells directly from vertically integrated module lines, enabling margin protection during lithium-price volatility. As preferences tilt toward regionalized supply chains, European and North American OEMs intensify local sourcing, giving fledgling domestic cell makers room to ramp and slightly diluting Chinese share within the solar vehicle market.
Solar Vehicle Industry Leaders
-
Ford Motor Company
-
Toyota Motor Corporation
-
Lightyear Technologies B.V.
-
Aptera Motors Corp.
-
SONO MOTORS GmbH
- *Disclaimer: Major Players sorted in no particular order


Recent Industry Developments
- June 2025: Swap Robotics received an undisclosed investment from Silicon Ranch to expand solar robotic operations and product development. The company will focus on utility-scale solar construction and maintenance technologies that could influence vehicle-integrated photovoltaic manufacturing processes.
- January 2025: Aptera announced progress toward market readiness with its production-intent solar electric vehicle, demonstrating advancements in solar-only vehicle architectures and specialized aerodynamic design for extended solar range.


Global Solar Vehicle Market Report Scope
The solar vehicle market report offers the latest technological advancements, trends, and updates from all the mentioned segments.
The solar vehicle market has been segmented on the basis of vehicle type, electric vehicle type, battery type, solar panel type, and geography.
Based on vehicle type, the market is segmented into passenger cars and commercial vehicles.
By electric vehicle type, the market is divided into battery electric vehicles and hybrid electric vehicles.
By battery type, it is segmented into lithium-ion, lead-acid, and other battery types.
By solar panel type, the market is segmented into mono-crystalline and poly-crystalline.
By geography, the market is segmented into North America, Europe, Asia-Pacific, and Rest of the World.
| Passenger Cars |
| Commercial Vehicles |
| Battery Electric Vehicle (BEV) |
| Hybrid Electric Vehicle (HEV) |
| Plug-in Hybrid Electric Vehicle (PHEV) |
| Lithium-ion (NMC/LFP) |
| Solid-state Lithium-metal |
| Lead Acid |
| Monocrystalline Silicon |
| Polycrystalline Silicon |
| Thin-film (CIGS/perovskite) |
| On-board Solar-only |
| Solar + Plug-in Hybrid Charging |
| North America | United States |
| Canada | |
| Rest of North America | |
| South America | Brazil |
| Argentina | |
| Rest of South America | |
| Europe | Germany |
| United Kingdom | |
| France | |
| Spain | |
| Italy | |
| Russia | |
| Rest of Europe | |
| Asia-Pacific | China |
| Japan | |
| India | |
| South Korea | |
| Rest of Asia-Pacific | |
| Middle East and Africa | Saudi Arabia |
| United Arab Emirates | |
| Egypt | |
| Turkey | |
| South Africa | |
| Rest of Middle East and Africa |
| Vehicle Type | Passenger Cars | |
| Commercial Vehicles | ||
| Electric-Drivetrain Type | Battery Electric Vehicle (BEV) | |
| Hybrid Electric Vehicle (HEV) | ||
| Plug-in Hybrid Electric Vehicle (PHEV) | ||
| Battery Chemistry | Lithium-ion (NMC/LFP) | |
| Solid-state Lithium-metal | ||
| Lead Acid | ||
| Solar-Panel Technology | Monocrystalline Silicon | |
| Polycrystalline Silicon | ||
| Thin-film (CIGS/perovskite) | ||
| Charging Architecture | On-board Solar-only | |
| Solar + Plug-in Hybrid Charging | ||
| Geography | North America | United States |
| Canada | ||
| Rest of North America | ||
| South America | Brazil | |
| Argentina | ||
| Rest of South America | ||
| Europe | Germany | |
| United Kingdom | ||
| France | ||
| Spain | ||
| Italy | ||
| Russia | ||
| Rest of Europe | ||
| Asia-Pacific | China | |
| Japan | ||
| India | ||
| South Korea | ||
| Rest of Asia-Pacific | ||
| Middle East and Africa | Saudi Arabia | |
| United Arab Emirates | ||
| Egypt | ||
| Turkey | ||
| South Africa | ||
| Rest of Middle East and Africa | ||


Key Questions Answered in the Report
What is the projected size of the solar vehicle market by 2031?
The solar vehicle market is forecast to reach USD 3.07 billion by 2031, growing at a 30.57% CAGR.
Which region leads current adoption of solar vehicles?
Asia-Pacific holds 56.21% of 2025 sales, driven by China’s PV manufacturing scale and Japan’s solar R&D strength.
Why are commercial fleets critical to future growth?
Larger roof areas on trucks and buses allow greater solar wattage, and fleet operators benefit from lower total cost of ownership, pushing commercial segments toward a 53.12% CAGR to 2031.
How do solid-state batteries affect solar vehicle design?
They double energy density, reduce pack weight, and accept variable charge rates, enabling lighter chassis and extended solar-powered range.
Page last updated on:


