
Semiconductor Front End Equipment Market Size and Share
Market Overview
| Study Period | 2020 - 2031 |
|---|---|
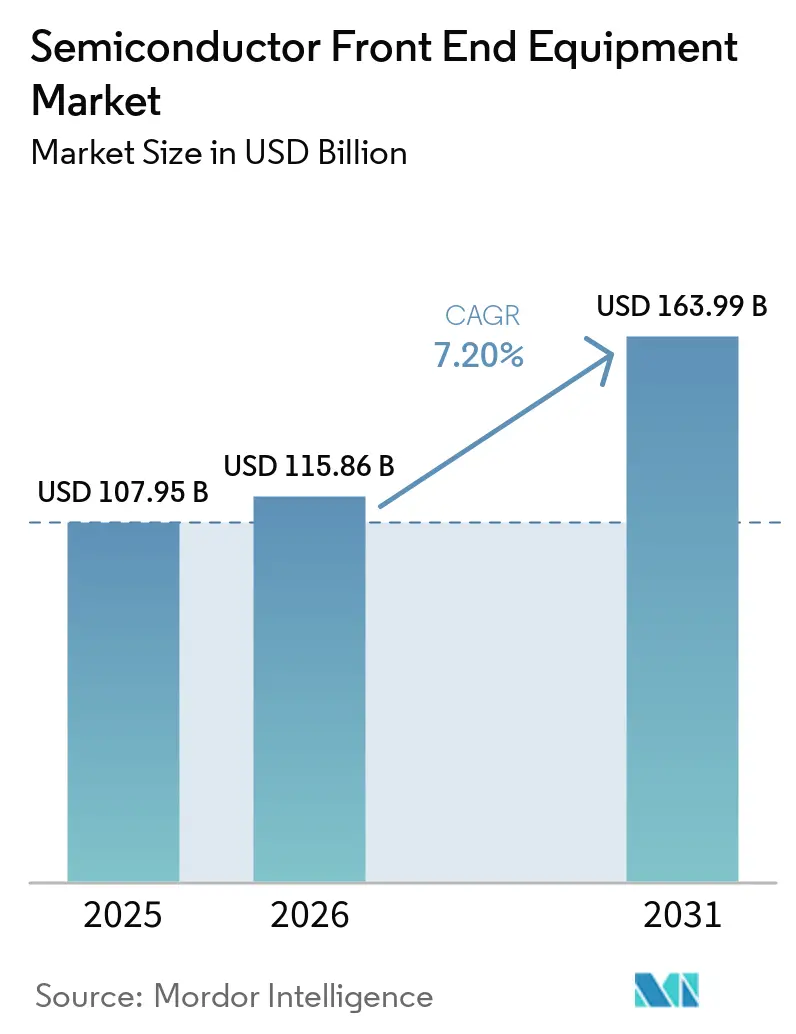
| Market Size (2026) | USD 115.86 Billion |
| Market Size (2031) | USD 163.99 Billion |
| Growth Rate (2026 - 2031) | 7.20 % |
| Fastest Growing Market | Asia Pacific |
| Largest Market | Asia Pacific |
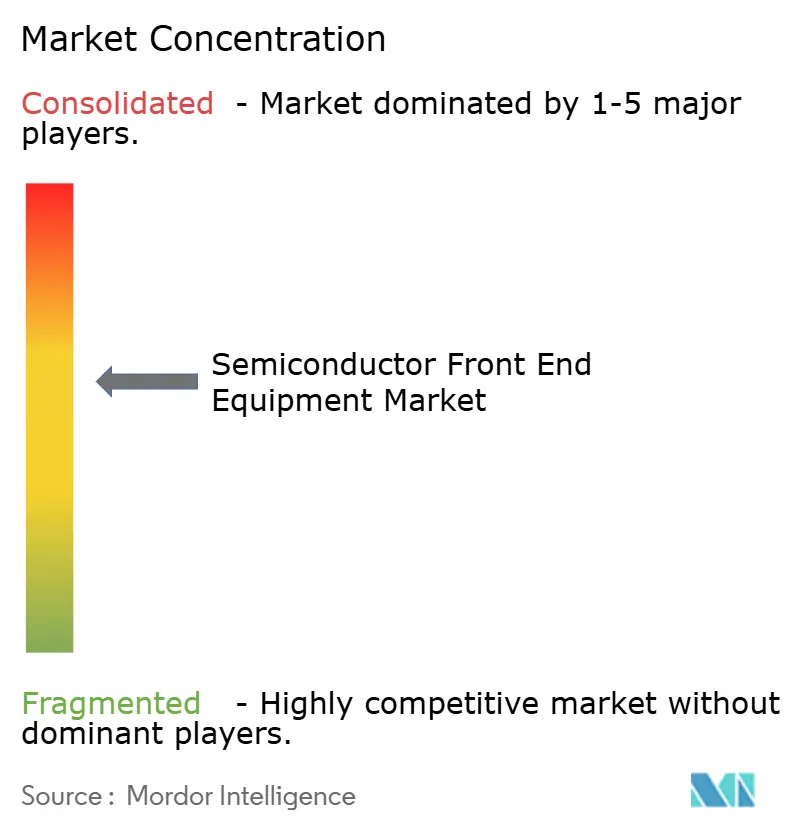
| Market Concentration | Medium |
Major Players *Disclaimer: Major Players sorted in no particular order Image © Mordor Intelligence. Reuse requires attribution under CC BY 4.0. | |
Semiconductor Front End Equipment Market Analysis by Mordor Intelligence
The semiconductor front-end equipment market size was valued at USD 107.95 billion in 2025 and estimated to grow from USD 115.86 billion in 2026 to reach USD 163.99 billion by 2031, at a CAGR of 7.2% during the forecast period (2026-2031). Heightened demand for artificial-intelligence accelerators, the rapid adoption of high-bandwidth memory, and state-directed fab construction in China are reinforcing a multi-year capital-expenditure cycle. Foundries are fast-tracking 2 nm and 1.4 nm nodes that require more lithography, etch, and metrology steps per wafer. Memory makers are allocating larger shares of their budgets to through-silicon-via and wafer-bonding tools as HBM3E and forthcoming HBM4 products scale. Simultaneously, export-control measures are channeling Chinese spending toward mature-node deposition and etch platforms, intensifying price competition in legacy tool categories. Supply-chain tightness around EUV optics and backside power-delivery inspection is extending tool lead times, forcing customers to place orders up to two years in advance.
Key Report Takeaways
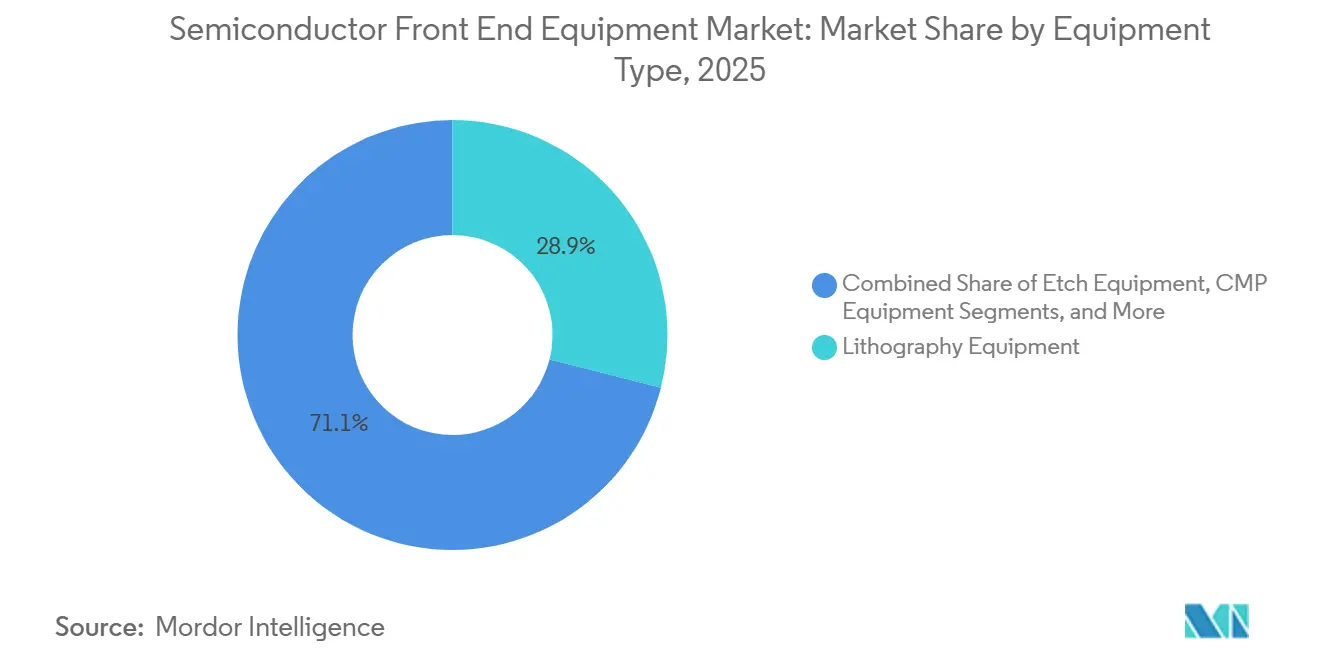
- By equipment type, lithography led with 28.94% of the semiconductor front end equipment market share in 2025, while High-NA EUV tools are expected to post the fastest 11.72% CAGR through 2031.
- By end-user, foundry and logic customers commanded 46.21% of 2025 revenue, yet memory manufacturers are projected to record the highest 10.40% CAGR to 2031.
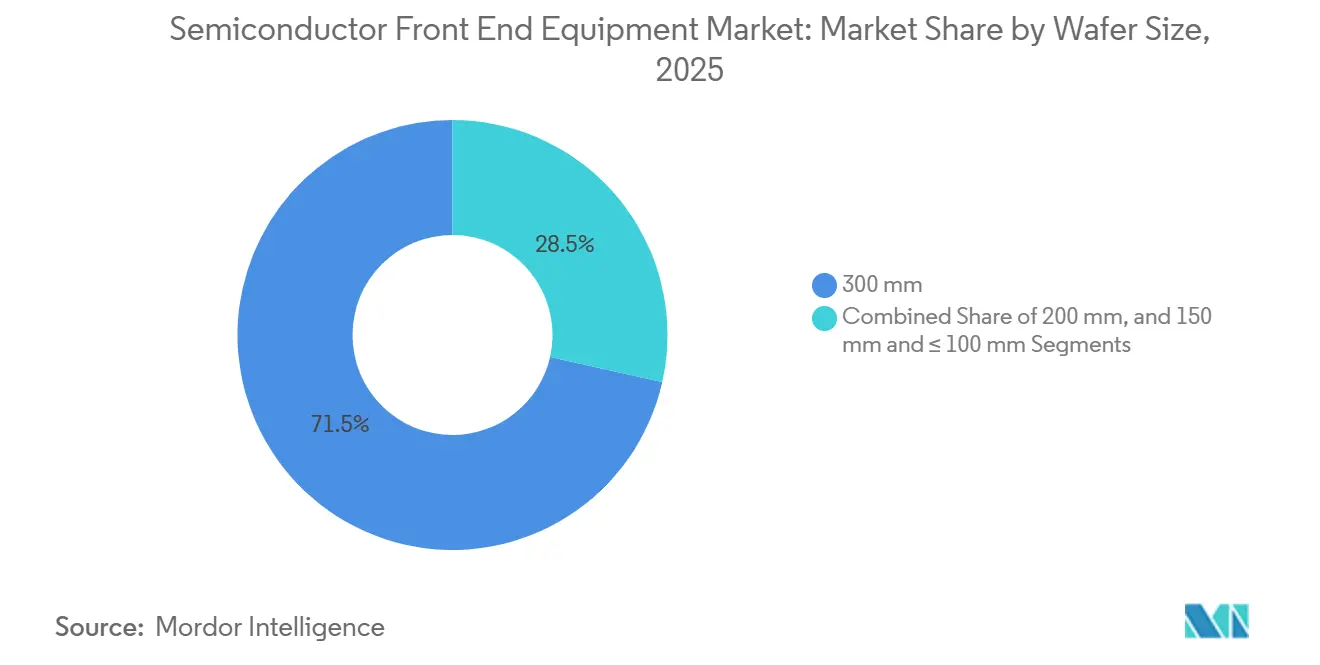
- By wafer size, the 300 mm segment held 71.49% share of the semiconductor front end equipment market size in 2025 and is slated to advance at an 8.98% CAGR between 2026-2031.
- By process node, mature nodes above 65 nm retained 38.62% share in 2025, whereas the ≤5 nm bracket is forecast to expand at a 9.32% CAGR through 2031.
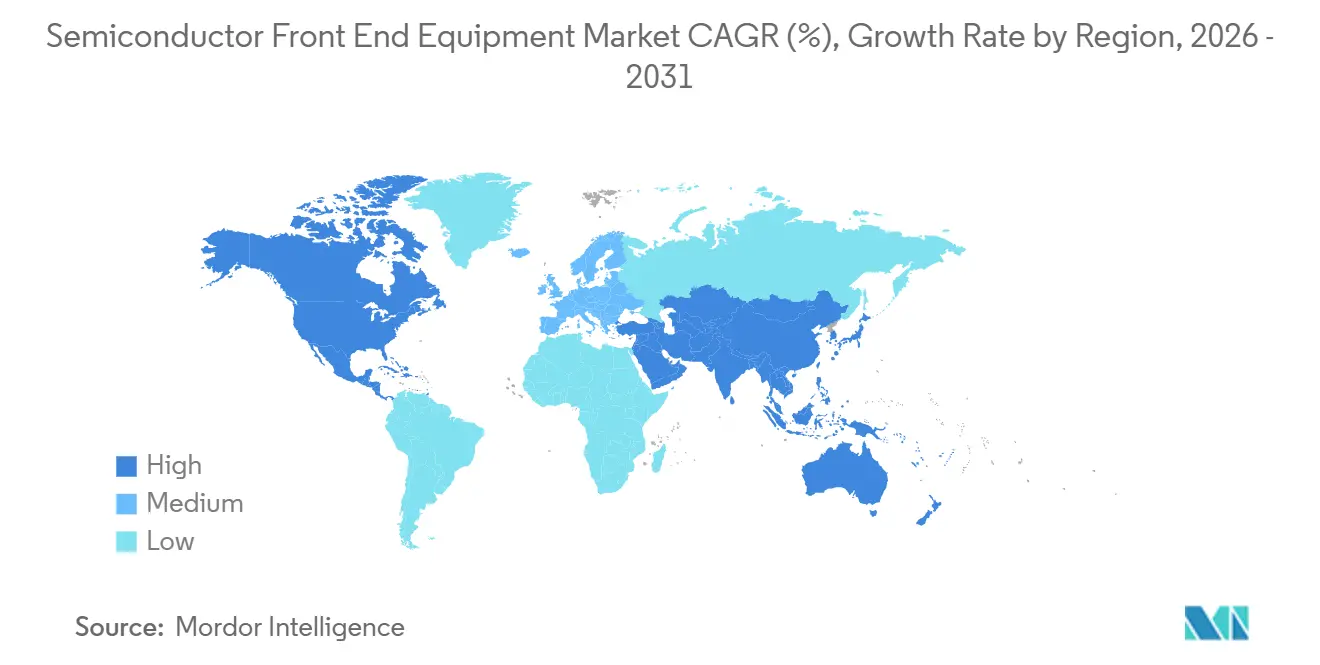
- By geography, Asia-Pacific accounted for 55.17% of 2025 revenue and is on track for an 8.40% CAGR, supported by intensive capacity additions across Taiwan, South Korea, and India.
Note: Market size and forecast figures in this report are generated using Mordor Intelligence’s proprietary estimation framework, updated with the latest available data and insights as of January 2026.
Global Semiconductor Front End Equipment Market Trends and Insights
Drivers Impact Analysis*
| Driver | (~) % Impact on CAGR Forecast | Geographic Relevance | Impact Timeline |
|---|---|---|---|
| AI-Accelerated Node Migration to Below 3 nm | +1.8% | Taiwan, South Korea, select U.S. fabs | Medium term (2-4 years) |
| Massive State-Backed Fab Build-Out in China | +1.2% | Mainland China, spillover to Southeast Asia | Long term (≥ 4 years) |
| 5G and IoT Device Rebound Lifting Mature-Node Demand | +0.9% | Global, early gains in Asia-Pacific and North America | Short term (≤ 2 years) |
| HBM-Driven TSV and Deep-Silicon Etch Intensity Spike | +1.5% | South Korea, Taiwan, select U.S. memory fabs | Medium term (2-4 years) |
| High-NA EUV Roll-Out Spawning Actinic Metrology Demand | +1.1% | Taiwan, South Korea, U.S., Europe | Long term (≥ 4 years) |
| India’s Greenfield 300 mm Fabs 2026-29 | +0.7% | India | Long term (≥ 4 years) |
| Source: Mordor Intelligence | |||


AI-Accelerated Node Migration To Below 3 nm
Foundries are significantly accelerating their node-transition cycles, introducing nanosheet processes into production years ahead of their previously established roadmaps. This rapid advancement is evident in TSMC's N2 ramp, Intel's 18A line, and Samsung's 2 nm gate-all-around flow, all of which require approximately 30% more etch and deposition steps compared to their FinFET predecessors. These additional steps have led to a notable increase in the tool count per production line. Furthermore, only ASML has the capability to supply the essential EUV scanners required for these advanced layers. However, ASML's production capacity is limited, with a 2026 ceiling of approximately 90 units, which imposes significant constraints on fab start-ups and their ability to scale operations effectively.[1]ASML Holding N.V., “High-NA EUV Shipment Forecast,” asml.com
HBM-Driven TSV And Deep-Silicon Etch Intensity Spike
Memory producers have significantly increased their orders for deep-reactive-ion etchers and copper-fill deposition tools, driven by the advancements in HBM3E packages, which now stack up to 12 dies. This stacking capability translates into tens of thousands of high-aspect-ratio vias per wafer, necessitating the use of advanced manufacturing tools. Both Lam Research’s Flex platform and Applied Materials’ Sym3 Y chamber have reported substantial double-digit order growth within this segment, highlighting the growing demand for these technologies in the memory production market.
Massive State-Backed Fab Build-Out In China
Beijing's third Integrated Circuit Fund is actively supporting the development of multiple 28 nm and 40 nm production lines, which is expected to drive the country's equipment expenditures to a significant USD 28 billion by 2025. This strategic initiative highlights China's commitment to strengthening its semiconductor manufacturing capabilities and reducing reliance on foreign technology. Indigenous suppliers, such as NAURA and AMEC, have successfully expanded their share of domestic etch and CVD spending to 35%, marking a substantial increase from 18% just two years ago. This growth underscores the rapid advancements made by local players in the semiconductor equipment market. Consequently, Western vendors are being redirected toward premium, leading-edge niches, as they adapt to the evolving competitive landscape shaped by China's focused investments and policy measures.[2]Government of China, “Integrated Circuit Fund Phase III Policy Release,” gov.cn
High-NA EUV Roll-Out Spawning Actinic Metrology Demand
Intel and imec have recently received their first EXE:5000 High-NA systems, marking a significant milestone in advanced semiconductor manufacturing. However, the anamorphic optics integrated into these systems necessitate a shift for fabs toward actinic inspection processes, which are more complex and specialized. Currently, Lasertec remains the sole provider of blank inspection solutions, but its 30-month lead time is exacerbating an already constrained and challenging supply chain environment. This situation highlights the critical need for diversification and innovation in inspection technologies to meet growing demand. Additionally, each High-NA tool is outfitted with approximately USD 8 million worth of dedicated metrology hardware, which is contributing to the rapid expansion of a fast-growing adjacent market, further emphasizing the importance of advancements in metrology to support the evolving semiconductor industry.[3]imec, “Actinic Metrology Requirements for High-NA EUV,” imec-int.com
Restraints Impact Analysis*
| Restraint | (~) % Impact on CAGR Forecast | Geographic Relevance | Impact Timeline |
|---|---|---|---|
| Precision Optics Supply Bottlenecks Inflating Lead-Times | -0.6% | Global, acute at High-NA adopters | Medium term (2-4 years) |
| Tightening Export Controls on Advanced Lithography | -0.5% | China, secondary global effects | Long term (≥ 4 years) |
| Back-Side Power-Delivery Defect Hurdles Delaying Tools | -0.4% | U.S., Taiwan, South Korea | Short term (≤ 2 years) |
| Net-Zero Fab Mandates Raising Wet-Bench TCO | -0.3% | European Union, California, select Asia-Pacific | Long term (≥ 4 years) |
| Source: Mordor Intelligence | |||
Precision Optics Supply Bottlenecks Inflating Lead-Times
All EUV mirror sets globally are manufactured exclusively by Carl Zeiss SMT. The company's production facility in Oberkochen has the capacity to produce 40 assemblies annually for standard EUV systems and approximately 10 assemblies per year for High-NA tools. This limited production capacity results in scanner lead times that can extend up to 30 months, creating significant bottlenecks in the supply chain. Furthermore, any disruption in the production process could severely impact timelines, delaying the ramp-up of sub-2 nm technology by as much as 18 months. Recognizing these risks, ASML is actively pursuing dual sourcing strategies by collaborating with Japanese optics firms to ensure a more robust and reliable supply chain.
Tightening Export Controls On Advanced Lithography
In 2025, stricter license requirements were rolled out by the United States, Netherlands, and Japan, effectively putting a stop to the shipment of ArF immersion and EUV tools to clients in China. This regulatory shift has created significant challenges for Western vendors, who now find themselves juggling two distinct portfolios: one featuring advanced tools designed for global markets and another comprising mature-node variants specifically tailored for the Chinese market. The need to maintain and develop these separate product lines has led to a notable spike in R&D expenses, as companies are required to allocate additional resources to sustain and evolve both portfolios simultaneously. This dual-portfolio strategy, while necessary to comply with regulatory changes, has introduced a considerable financial burden on these vendors. As a result, this strain on resources is anticipated to trim the long-term CAGR of the semiconductor front-end equipment market by about half a percentage point, potentially altering the market's overall growth trajectory and influencing its competitive dynamics in the forecast period.
*Our forecasts treat driver/restraint impacts as directional, not additive. The impact forecasts reflect baseline growth, mix effects, and variable interactions.
Segment Analysis
By Equipment Type: Lithography Commands Share, High-NA EUV Drives Growth
In 2025, lithography tools accounted for 28.94% of the revenue, buoyed by assertive foundry and memory strategies. These tools play a critical role in the semiconductor manufacturing process, enabling precise patterning required for advanced chip designs. High-NA EUV platforms, each carrying a price tag close to USD 380 million, are set to expand at an 11.72% CAGR, propelling the semiconductor front-end equipment market tied to patterning technologies. The increasing demand for these platforms highlights their importance in meeting the growing complexity of semiconductor devices. Following closely, etch systems claimed a 22% share, driven by the rising prominence of gate-all-around structures and enhanced plasma steps for backside power delivery. These systems are essential for achieving the intricate designs required in modern chips. Deposition tools held a 19% stake, underscoring the growing adoption of ALD for high-k dielectrics. The wider use of ALD reflects the industry's shift towards materials and processes that enhance device performance and efficiency. Meanwhile, inspection and metrology climbed to a 12% share, even as overlay budgets tightened. This growth indicates the increasing need for precise quality control and measurement in semiconductor manufacturing.
Legacy categories, including ion implantation, CMP, cleaning, track-coat developers, and thermal processing, accounted for the remaining 18% of expenditures. These categories, while mature, remain vital to the overall semiconductor manufacturing ecosystem. Vendors entrenched in these established domains grapple with ASP pressures from swiftly advancing Chinese rivals, who can slash prices by as much as 25%. The competitive pricing from Chinese competitors poses significant challenges for multinational suppliers. As a result, global suppliers are redirecting R&D investments towards more lucrative offerings like EUV, TSV, and actinic inspection. This strategic shift aims to capitalize on higher-margin opportunities and maintain a competitive edge in the evolving semiconductor market.


By End-User Industry: Memory Surges As HBM Ramps Accelerate
In 2025, TSMC, Samsung Foundry, and Intel spearheaded the foundry and logic houses, accounting for 46.21% of the total expenditure. These companies have consistently led the market due to their advanced manufacturing capabilities and significant investments in cutting-edge technologies. Meanwhile, the memory segment, dominated by SK Hynix, Samsung, and Micron, is poised for the swiftest growth at a 10.40% CAGR, buoyed by HBM capacity expansions. This rapid growth in the memory sector is not only driving advancements in technology but also bolstering the market share of TSV etch, copper fill, and wafer-bonding tools in the semiconductor front-end equipment arena. These tools are critical for enabling the production of high-performance memory solutions.
Texas Instruments and Infineon, pivoting their lines for automotive analog and power chips, propelled integrated device manufacturers to capture 18% of the expenditures. This shift highlights the growing importance of automotive applications in the semiconductor industry, particularly as vehicles become increasingly reliant on advanced electronic systems. Meanwhile, a surge in demand for electric-vehicle inverters bolstered specialty analog and power customers, who claimed the remaining 12%. This demand underscores the expanding role of electric vehicles in shaping the semiconductor market. The ongoing divergence in equipment focus, prioritizing leading-edge lithography for logic and TSV and deposition for memory, continues to influence supplier strategies. Suppliers are adapting their roadmaps to address these distinct priorities, ensuring they remain competitive in a rapidly evolving market landscape.
By Wafer Size: 300 mm Dominates, Driven By Cost-Per-Die Economics
The 300 mm format accounted for 71.49% of total spending and is set to grow at a robust 8.98% CAGR. This growth highlights the increasing adoption of the 300 mm diameter across both cutting-edge and established fabs, which has resulted in a diverse demand for tools. These tools span critical areas such as EUV patterning, multi-pattern etch, and refurbished DUV platforms, showcasing the versatility and importance of the 300 mm format in the semiconductor industry. The widespread use of this diameter is driven by its ability to support both leading-edge and mature-node technologies, making it a preferred choice for manufacturers aiming to optimize production efficiency. Furthermore, as new facilities are established in key regions like India and the United States, the allocation of the semiconductor front-end equipment market to 300 mm capacity additions is expected to rise significantly, further driving market growth and enhancing regional production capabilities.
On the other hand, in 2025, 200 mm utilization reached 88%, reflecting limited short-term migration paths for analog and RF chips. This high utilization rate underscores the challenges faced by manufacturers in transitioning to newer technologies, as the demand for analog and RF chips continues to grow. To address these challenges, equipment manufacturers have introduced retrofit kits that enable 200 mm tools to emulate the capabilities of 300 mm processes. These kits provide a cost-effective solution by reducing capital expenditure while enhancing the functionality of existing tools, allowing manufacturers to extend the lifecycle of their equipment. Meanwhile, the 150 mm and ≤100 mm segments, which are primarily used for compound semiconductors, together contributed a modest 7% of the overall revenue. This limited contribution highlights the niche applications of these smaller diameter formats, which remain essential for specific semiconductor processes despite their smaller market share. These segments cater to specialized markets, such as power electronics and optoelectronics, where compound semiconductors play a critical role in enabling advanced functionalities.
By Process Node Technology: Mature Nodes Hold Share, ≤5 nm Leads Growth
Nodes above 65 nm accounted for 38.62% of spending, driven by automotive and industrial designs that prioritize reliability and durability over sheer density. These nodes continue to play a significant role in the semiconductor market, especially in applications where performance stability and long-term functionality are critical. Meanwhile, equipment tied to the ≤5 nm tier is witnessing the fastest growth at a 9.32% CAGR, underscoring the AI-driven push for larger transistor budgets and enhanced computational capabilities. This growth reflects the increasing demand for cutting-edge technologies that support advanced AI applications and high-performance computing, while also creating downstream requirements for semiconductor back-end equipment. As a result, the market share for semiconductor front-end equipment is increasingly leaning towards advanced patterning, metrology, and backside power-delivery tools, which are essential for enabling the production of these next-generation nodes.
Mid-range nodes, spanning 6 nm to 16 nm, catered to mid-tier smartphone processors, offering a balance between performance and cost efficiency. These nodes are widely adopted in devices that require moderate processing power without incurring the high costs associated with advanced nodes. In contrast, the 28-65 nm range focused on cost-sensitive consumer electronics and IoT silicon, which are integral to a variety of everyday applications. Chinese fabs emerged as the dominant purchasers for these nodes, broadening the market for local suppliers and creating new opportunities for domestic manufacturers. This trend has also exerted pricing pressures on global vendors, compelling them to adapt their strategies to remain competitive in a rapidly evolving market landscape.
Geography Analysis
In 2025, the Asia-Pacific region maintained its dominance with a substantial 55.17% market share, primarily driven by Taiwan's advanced semiconductor hubs, South Korea's significant memory expansions, and India's proactive establishment of subsidy-supported fabs. Taiwan alone accounted for approximately 25% of the global demand for semiconductor tools, with its N2, N2P, and A16 production lines making substantial investments in EUV lithography and actinic metrology technologies. Meanwhile, South Korea's capital expenditures were heavily focused on advancing HBM and 2 nm processes, channeling significant orders toward TSV, dielectric etch, and copper fill technologies to enhance production capabilities.
North America followed as the second-largest contributor, securing a 22% revenue share in the global market. The region's growth was significantly influenced by major projects such as Intel's developments in Ohio, Arizona, and Oregon, Texas Instruments' establishment of 300 mm analog production lines, and GlobalFoundries' expansion efforts in Malta. These initiatives have collectively reshaped the regional supply chain, prompting equipment vendors to respond by setting up local manufacturing modules and service hubs. This strategic move aims to capitalize on the incentives provided under the CHIPS Act, further strengthening the region's position in the global semiconductor market.
Europe held an approximate 12% market share, with its focus centered on specialty analogs, power semiconductor sectors, and pioneering research initiatives for High-NA EUV technologies. Companies like STMicroelectronics and Infineon emphasized the development of cost-efficient mature nodes to remain competitive, while collaborations between imec and ASML advanced next-generation actinic metrology solutions. Although South America, the Middle East, and Africa remained minor contributors to the global market, initiatives backed by Saudi Arabia indicate potential long-term growth. However, realizing this growth will depend on addressing critical ecosystem challenges, including the development of skilled labor, access to water resources, and the availability of reliable utilities.

Regulatory Landscape
Export controls and licensing rules continue to shape front-end equipment shipments and product roadmaps, especially for advanced lithography and computing-related technologies. In December 2024, the United States updated Foreign-Produced Direct Product Rule (FDPR) controls for advanced computing via a Federal Register action, reinforcing compliance exposure for equipment and toolchains that incorporate US-origin technology. During 2025, the United States, Netherlands, and Japan tightened license requirements that effectively curtailed shipments of ArF immersion and EUV systems to certain China-based customers, pushing global suppliers toward dual-portfolio strategies that separate leading-edge offerings from mature-node variants.
Industrial policy and coordination frameworks are also shifting alongside these trade controls. In April 2026, US Senators introduced the Multilateral Alignment of Technology Controls on Hardware (MATCH) Act to drive more uniform export-control alignment with allied countries, including a defined timeline for cooperation. In June 2026, the European Commission published a proposal referred to as Chips Act 2.0, building on earlier Member State initiatives and keeping Europe focused on semiconductor resilience and scaling innovation to industrial production. This influences where tool vendors prioritize service, localization, and qualification activities.
Competitive Landscape
In the semiconductor front-end equipment market, a handful of players dominate. By 2025, Applied Materials, ASML, Lam Research, Tokyo Electron, and KLA are projected to command around 65% of the market's revenue. ASML, with its grip on EUV lithography, is intensifying its High-NA deliveries, solidifying its lead in sub-2 nm patterning. The company’s advancements in lithography technology have positioned it as a critical player in enabling next-generation semiconductor manufacturing. Applied Materials, a frontrunner in deposition, is swiftly securing patents for innovative backside power-delivery methods, which are expected to enhance power efficiency and performance in advanced chips. Meanwhile, Lam Research has carved out a niche, excelling in deep-silicon etching for TSV and gate-all-around structures, which are essential for scaling semiconductor devices to smaller nodes.
Tokyo Electron boasts strengths in track-coat-develop and thermal processing, leveraging its expertise to maintain a competitive edge in these critical areas of semiconductor fabrication. At the same time, KLA fortifies its position in process control, recently launching e-beam and actinic inspections that address the growing need for precise defect detection and yield improvement in advanced manufacturing nodes. Yet, Chinese suppliers NAURA, AMEC, and SMEE have captured a notable 35% of the domestic market. They've achieved this by offering competitive pricing and quicker lead times, particularly in mature-node deposition, etch, and lithography. This shift underscores the growing competitiveness of Chinese players in the global semiconductor equipment market. In response, Western giants are fine-tuning their strategies. They're segmenting their portfolios, channeling cutting-edge R&D into high-margin nodes, and adapting legacy products to stave off commoditization, ensuring they remain relevant in both advanced and mature markets.
These strategic maneuvers highlight a growing divide. Established players are pouring resources into expansive regional service networks, aiming to mitigate supply chain risks and ensure uninterrupted support for their global customer base. In contrast, emerging challengers are forming joint ventures and leveraging government-supported pilot lines to showcase their tool performance and gain credibility in the market. Sustainability is now a pivotal factor in purchasing decisions, unveiling opportunities in energy-efficient wet processing, closed-loop CMP, and energy-as-a-service contracts. These trends reflect the increasing importance of environmental considerations in the semiconductor industry. Even in this consolidated landscape, niche leaders like Lasertec and SCREEN prove that specialized segments, despite their high barriers, can command premium margins. Their focus on high-barrier, high-value segments demonstrates that innovation and specialization remain key drivers of profitability in the semiconductor equipment market.
Semiconductor Front End Equipment Industry Leaders
Applied Materials Inc.
KLA Corporation
ASML Holding NV
LAM Research Corporation
Tokyo Electron Limited
- *Disclaimer: Major Players sorted in no particular order

Market Opportunities and Future Outlook
A clear whitespace for front-end equipment suppliers sits where leading-edge logic scaling meets the process-control and materials stack needed for new device architectures. As nanosheet processes and backside power delivery move forward, fabs add more critical etch, deposition (including ALD), and metrology steps per wafer. High-NA EUV also increases demand for actinic inspection, and limited capacity among specialized providers for blank inspection keeps procurement and capacity-planning front-loaded.
Geographic expansion programs add another near-term pocket of opportunity tied to new fab builds and localization efforts. In July 2026, TSMC disclosed an additional USD 100 billion US investment commitment for new advanced manufacturing and packaging sites, while Intel announced a EUR 5 billion expansion at its Leixlip, Ireland campus. Both announcements point to sustained tool-install activity across lithography, etch, deposition, and inspection. India is also emerging as a 300 mm demand center, supported by India-linked greenfield fab initiatives and supplier alignment moves such as ASML's May 2026 memorandum of understanding with Tata Electronics for lithography equipment associated with India's first commercial 300 mm fab project in Dholera, Gujarat.
Recent Industry Developments
- July 2026: ASML highlighted a High-NA EUV readiness milestone tied to Intel Foundry moving into high-volume manufacturing using EXE High-NA EUV technology on the Intel 18A process. The step signals High-NA tooling progressing from early installs into volume manufacturing use-cases, tightening the coupling between lithography roadmaps and downstream metrology and process-control demand.
- June 2026: Applied Materials opened a USD 500 million manufacturing and R&D campus in Tampines, Singapore. The site expands regional capacity and support infrastructure for customers in Asia-Pacific, helping shorten service cycles and improve supply chain resilience for high-mix front-end tool demand driven by AI-related capacity additions.
- December 2025: Applied Materials detailed a USD 600 million expansion at its Kalispell facility to increase Endura Volta PVD capacity, with completion targeted for Q4 2027. The investment reinforces domestic manufacturing depth for critical deposition platforms used in advanced device structures, supporting faster tool delivery and spares availability for high-utilization fabs.


Research Methodology Framework and Report Scope
Market Definition and Coverage
For this study, the market covers revenue from equipment used in wafer fabrication steps before assembly and packaging, across major semiconductor regions. It includes tools tied to patterning, material removal, film formation, cleaning, and process control that support device manufacturing at different nodes and wafer sizes.
Scope exclusions: Back-end assembly, test equipment, and outsourced packaging services are not counted in this market total.
Segmentation Overview
- By Equipment Type
- Lithography Equipment
- Etch Equipment
- Deposition and Thin-Film Equipment
- Ion Implantation Equipment
- CMP Equipment
- Cleaning Equipment
- Inspection and Metrology
- Track, Coater and Developer
- Thermal Processing
- By End-User Industry
- Foundry and Logic
- IDM, Integrated Device Manufacturer
- Memory, DRAM and NAND
- Specialty Analog and Power
- By Wafer Size
- 300 mm
- 200 mm
- 150 mm and = 100 mm
- By Process Node Technology
- = 5 nm
- 6-16 nm
- 28-65 nm
- > 65 nm (Mature)
- By Geography
- North America
- United States
- Canada
- Mexico
- South America
- Brazil
- Argentina
- Rest of South America
- Europe
- Germany
- United Kingdom
- France
- Italy
- Spain
- Rest of Europe
- Asia Pacific
- China
- Japan
- South Korea
- India
- Australia
- New Zealand
- Rest of Asia-Pacific
- Middle East and Africa
- Middle East
- United Arab Emirates
- Saudi Arabia
- Turkey
- Rest of Middle East
- Africa
- South Africa
- Nigeria
- Kenya
- Rest of Africa
- Middle East
- North America
Data Sources, Market Sizing, and Validation
Desk Research
Desk research was used to set the market perimeter and build a demand map by region and fab type. We reviewed public statistics and industry releases such as SEMI updates (equipment billings and outlook commentary), SIA publications, OECD and World Bank macro series, and trade and industrial releases from sources such as the US Census Bureau and Eurostat. We combined these with company filings, earnings transcripts, investor presentations, and reputable press coverage to track capex cycles, node transitions, and tool mix shifts.
To keep the model practical, paid databases were used selectively for company financials and intelligence, news and financials tracking, and semiconductor value chain references. This helped cross-check revenue splits, regional exposure, and timing of major capacity additions without relying on a single data stream. The desk research sources listed here are illustrative only, and many other public and paid sources were used for data collection, validation, and clarification during analysis.
Primary Interviews and Surveys
Primary work focused on confirming what portion of fab spending translates into front-end tool shipments, and how the mix changes as nodes shrink and memory ramps. We spoke with a spread of equipment-side and fab-side roles, including product, procurement, process engineering, and strategy teams, and then checked inputs across APAC, EMEA, and the Americas to reduce regional bias in utilization assumptions and lead-time assumptions.
Distribution of primary research fieldwork respondents
| Company type | Respondent position | Region |
|---|---|---|
| Top tier: 33% | CXOs: 19% | APAC: 38% |
| Mid tier: 48% | Functional/Unit leaders: 35% | EMEA: 36% |
| Smaller Players: 19% | Managers: 46% | Americas: 26% |
Market-Sizing & Forecasting
Sizing starts from a top-down build where equipment demand is reconstructed from semiconductor capex plans, fab capacity additions, and process intensity shifts by node and wafer size. We then pressure-test the total with selective bottom-up checks such as sampled tool class revenues, ASP x shipment proxies where disclosures exist, and channel feedback on lead times and delivery phasing, which are used to adjust obvious over or under counts.
Key inputs in the model include announced fab build-outs and ramp schedules, node migration (for example, the share moving into 5 nm and below versus mature nodes), wafer-size mix (300 mm versus 200 mm and below), memory versus foundry capex swings, and step-count inflation that raises tool intensity for lithography, etch, deposition, and inspection. Where public detail is missing, gaps are handled by applying conservative penetration and mix assumptions that were validated in interviews, and then normalized so regional totals stay consistent with observed investment cycles.
For forecasting, scenario analysis was used because the market is sensitive to cycle timing, export controls, and ramp delays that are not captured well by a single trend line. Variables such as expected AI server demand, HBM-related capacity additions, and expected lead-time easing were discussed with industry respondents, and the final forecast reflects a base case that stays aligned with these consensus signals.
Data Validation & Update Cycle
Validation is done through multiple checks so the market total is not driven by one assumption. We compare outputs against independent signals such as equipment billings direction, fab construction timing, and reported capex guidance, and then investigate any large variance by tool group and region before sign-off. When an anomaly is found, the underlying driver is revisited, followed by re-checks with respondents if the shift is material.
The report is refreshed annually, and interim updates are triggered when major events occur, such as sharp capex revisions, new fabs being paused, or policy changes that alter equipment access. Before delivery, we review the latest public disclosures again so clients receive an updated view that matches the most recent market conditions.
Mordor Intelligence's Global Semiconductor Front End Equipment Market Sizing Compared With Other Published Estimates
Published market values for front-end equipment can look inconsistent because different studies do not always count the same equipment families, time the cycle the same way, or apply the same currency and shipment recognition logic. We see the biggest spread when the model blends front-end and back-end tools, or when it assumes faster node ramps than what fab timelines can realistically support.
In practice, the gap is usually driven by whether inspection and metrology, cleaning, CMP, and track tools are included as front-end equipment, and also by how analysts treat delayed shipments that slide across calendar years. Some figures lean on a single capex-to-equipment ratio and extend it forward, while others apply aggressive ASP growth without checking it against tool mix and wafer-start trends. This is where Mordor Intelligence is separated by counting only pre-assembly wafer fab tools and cross-checking cycle timing with node and wafer-size mix inputs.
Benchmark comparison
| Source | Market Size | Gaps in Research Methodology |
|---|---|---|
| Mordor Intelligence | USD 115.86 B (2026) | |
| Industry Association A | USD 135.10 B (2025) | This figure reflects total semiconductor manufacturing equipment billings, which can include back-end equipment and service-related billings depending on reporting cuts, and it is stated for a different year than the 2026 base used here. |
| Trade Journal B | USD 97.07 B (2024) | This estimate appears to use an earlier cycle year and may apply a broader or narrower tool list without clearly stating treatment of metrology, cleaning, and CMP, which can shift totals materially when mix changes. |
The table shows that timing and scope choices explain much of the spread, especially when cycle years are not aligned and adjacent equipment categories are grouped differently. By tying the total to observable fab build-outs, node migration, and wafer-size mix, the estimate stays traceable to inputs that can be rechecked and updated as market conditions change.


Key Questions Answered in the Report
What is the projected value of the semiconductor front end equipment market in 2031?
It is forecast to reach USD 163.99 billion by 2031, driven by AI workloads, HBM ramps, and sustained Asia-Pacific fab expansions.
Which equipment type is expected to grow fastest through 2031?
High-NA EUV lithography systems, expanding at an estimated 11.72% CAGR as sub-2 nm patterning moves into mass production.
Why are memory manufacturers increasing capital outlays?
HBM3E and planned HBM4 stacks require extensive TSV etch, copper fill, and wafer-bond tools, driving a 10.40% CAGR for memory-sector equipment demand.
How will export controls influence tool suppliers?
Restrictions on advanced lithography sales to China compel vendors to split product lines and may trim roughly 0.5 percentage points from long-term growth.
Page last updated on:


 Your data is secure and never sold or shared.


