China Semiconductor Device Market Size and Share
Market Overview
| Study Period | 2020 - 2031 |
|---|---|
| Forecast Data Period | 2026 - 2031 |
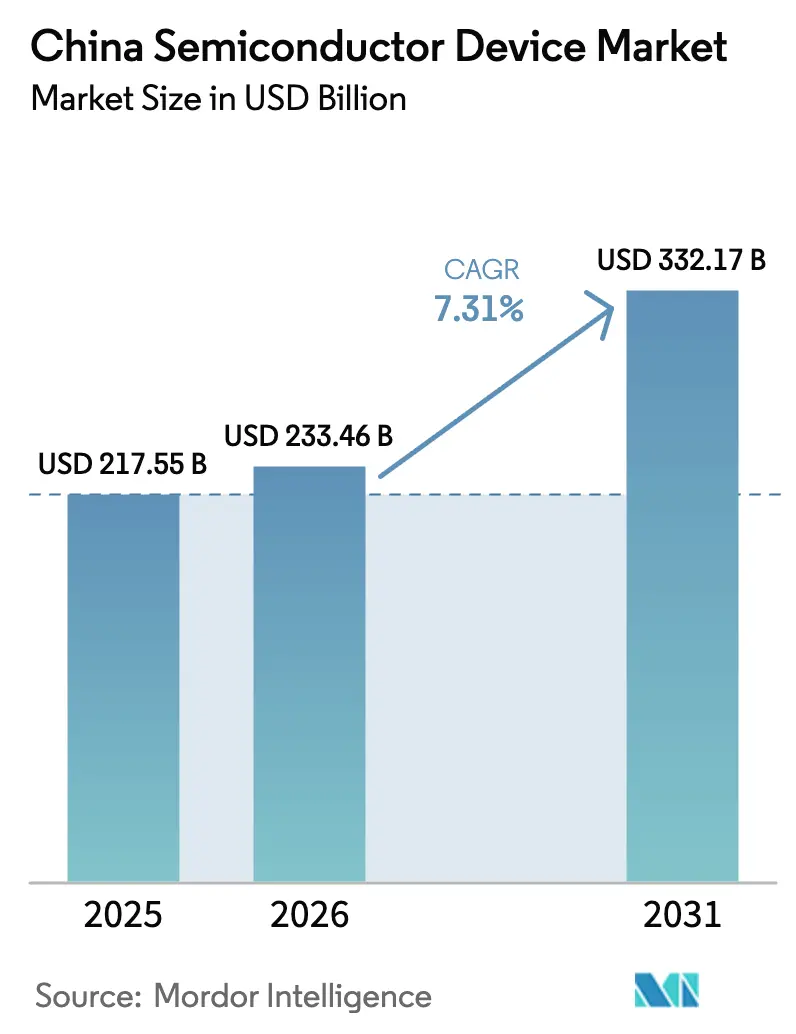
| Base Year Market Size (2025) | USD 217.55 Billion |
| Market Size (2026) | USD 233.46 Billion |
| Market Size (2031) | USD 332.17 Billion |
| Growth Rate (2026 - 2031) | 7.31% CAGR |
| Market Concentration | Medium |
Major Players *Disclaimer: Major Players sorted in no particular order Image © Mordor Intelligence. Reuse requires attribution under CC BY 4.0. | |
China Semiconductor Device Market Analysis by Mordor Intelligence
The China semiconductor device market size was valued at USD 217.55 billion in 2025 and estimated to grow from USD 233.46 billion in 2026 to reach USD 332.17 billion by 2031, at a CAGR of 7.31% during the forecast period (2026-2031). State-directed funding, vigorous private investment, and a policy mandate for technological self-sufficiency have turned the industry into a strategic priority. Rapid capacity additions at domestic foundries, breakthroughs in 3D NAND and advanced packaging, and rising demand from 5G, AI, and new-energy vehicles underpin the expansion. Tight export controls on extreme-ultraviolet (EUV) tools have slowed the migration to sub-10 nm nodes; yet, firms have redirected their efforts toward improving mature-node efficiency, compound semiconductors, and novel architectures that bypass EUV. Competitive pressure has led to increased consolidation, as exemplified by Empyrean-Xpeedic in EDA and YMTC’s funding round, illustrating a trend toward scale, vertical integration, and IP accumulation.
Key Report Takeaways
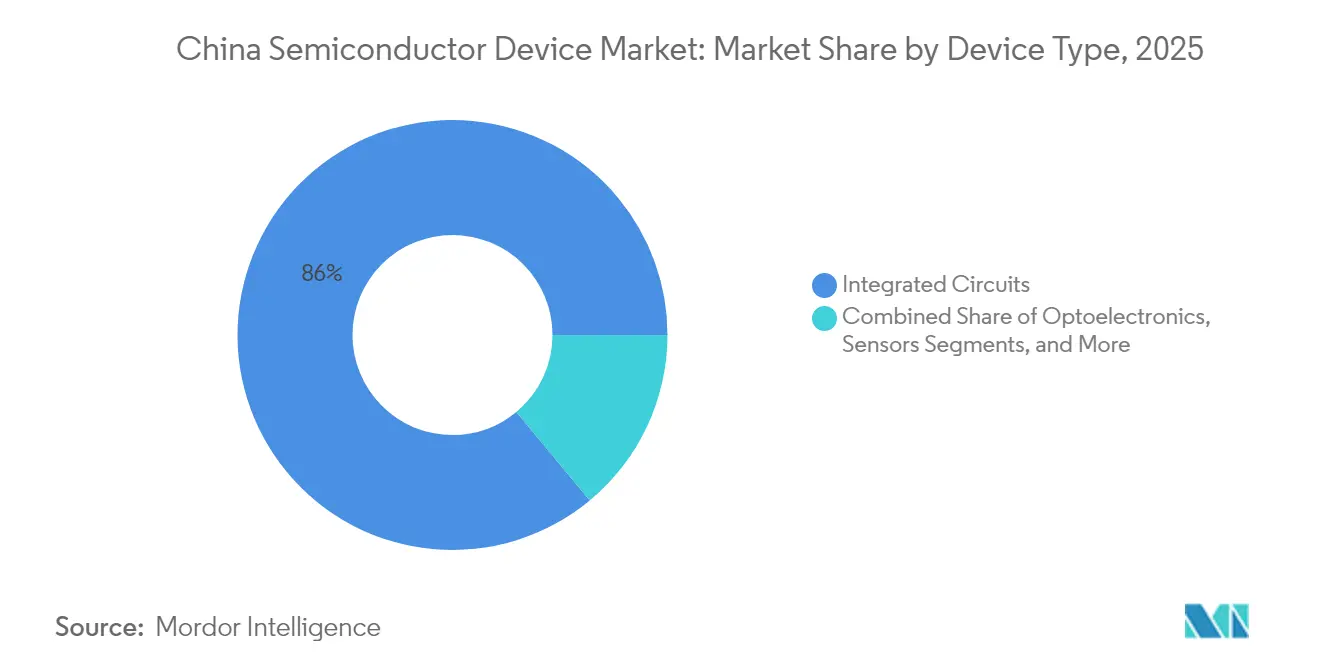
- By device type, integrated circuits led with 86.02% revenue share in 2025; sensors and MEMS posted the quickest 8.06% CAGR through 2031.
- By business model, the design/fabless segment held 67.35% of the China semiconductor device market share in 2025, while integrated device manufacturers are expected to advance at an 7.86% CAGR through 2031.
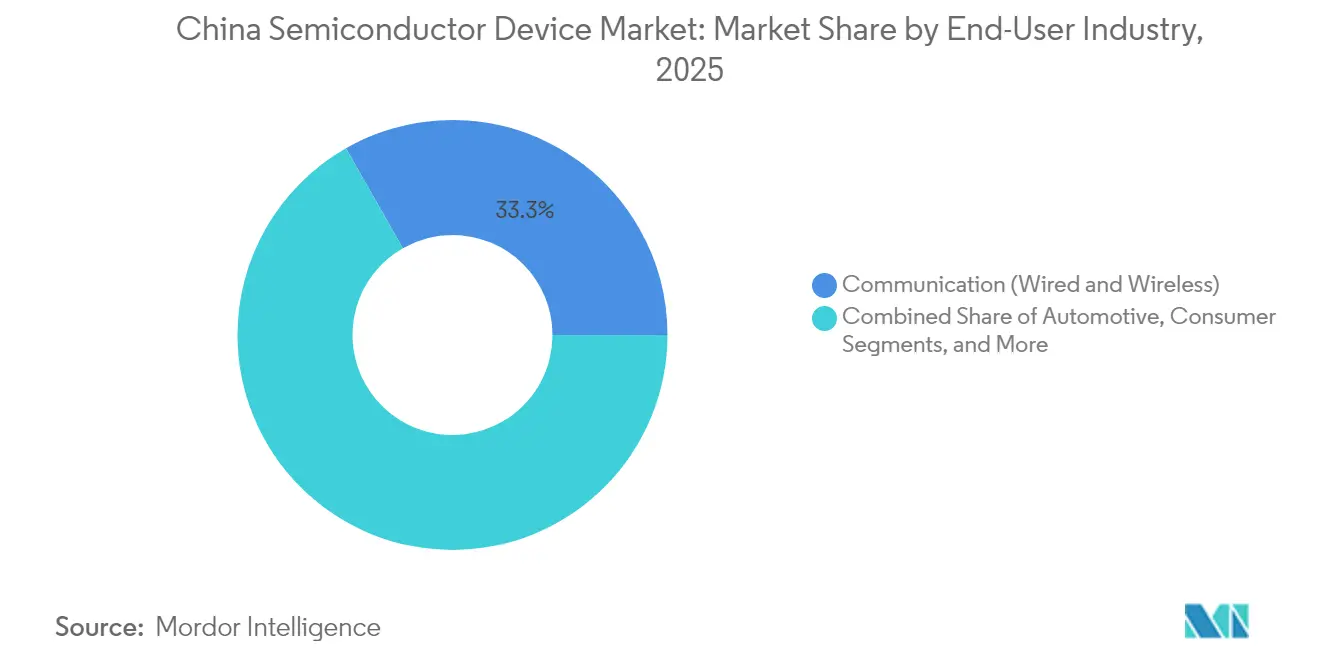
- By end-user industry, communication accounted for 33.25% of the China semiconductor device market size in 2025, and AI applications are projected to expand at a 9.28% CAGR through 2031.
Note: Market size and forecast figures in this report are generated using Mordor Intelligence’s proprietary estimation framework, updated with the latest available data and insights as of 2026.
China contributes to a system defined not by any single country or region but by the interaction of many. The global semiconductor device market data by Mordor Intelligence represents that combined structure.
China Semiconductor Device Market Trends and Insights
Drivers Impact Analysis*
| Driver | (~) % Impact on CAGR Forecast | Geographic Relevance | Impact Timeline |
|---|---|---|---|
| Accelerated "Made-in-China 2025" IC Capacity Expansion Programs | +1.9% | National, concentrated in Beijing, Shanghai, and Shenzhen | Long term (≥ 4 years) |
| AI-centric Edge-Computing Demand from Tier-1 Chinese Cloud Providers | +1.6% | National, with clusters in Beijing, Hangzhou, and Shenzhen | Medium term (2-4 years) |
| Automotive-grade SiC/GaN Adoption in NEV Powertrains | +1.3% | National, led by Guangdong, Jiangsu, and Shanghai | Medium term (2-4 years) |
| National 5G Base-station Build-out Driving RF-Front-End IC Uptake | +1.1% | National infrastructure deployment | Short term (≤ 2 years) |
| Industrial Upgrade to "Industry 4.0" Smart-Factories | +0.8% | Manufacturing hubs in Jiangsu, Zhejiang, and Guangdong | Long term (≥ 4 years) |
| Post-pandemic rebound of AIoT-enabled consumer devices (smart wearables, AR/VR) | +0.7% | National, concentrated in Guangdong, Zhejiang, consumer electronics hubs | Medium term (2-4 years) |
| Source: Mordor Intelligence | |||
Accelerated “Made-in-China 2025” IC Capacity Expansion Programs
China expanded foundry capacity by 15% in 2024 and is scheduled to add another 14% in 2025 as SMIC, Huahong, and Nexchip ramp mature-node lines.[1]SEMI, “Global Semiconductor Fab Capacity Projected to Expand 6% in 2024 and 7% in 2025,” semi.org Localization now stretches beyond fabrication to photoresist stripping and wet-clean tools, where domestic suppliers have achieved high usage rates. By 2027, China is projected to hold 31% of global 28 nm capacity, reshaping pricing at mature nodes. The program’s success hinges on stable power, process-engineering talent, and second-source equipment lines that mitigate export-control exposure. Taken together, the rollout cements domestic supply for consumer, industrial, and automotive electronics, lifting utilization rates and margins across the ecosystem.
AI-Centric Edge-Computing Demand from Tier-1 Chinese Cloud Providers
Alibaba pledged CNY 380 billion (USD 52.9 billion) over 2025-2027 for AI-ready cloud infrastructure, while Tencent and Baidu announced comparable outlays. Demand spans GPUs, high-bandwidth memory, and network switch ASICs, channeling orders to local fabs and memory houses. DeepSeek’s foundation model showcases China’s ability to align software and hardware, easing reliance on foreign accelerators. Edge-AI workloads favor low-latency, on-premise compute, steering buyers toward domestically designed SOCs that comply with national data-sovereignty rules. The virtuous loop between hyperscaler capex and chip-level innovation is therefore a prime mid-term growth catalyst.
Automotive-Grade SiC/GaN Adoption in NEV Powertrains
SiC devices enhance efficiency in 800-V drivetrains and high-power charging applications. China is on track to consume 40% of global SiC wafers by 2030, up from 15% in 2023, as local sourcing is expected to reach 60%. BYD Semiconductor already controls 28.9% of domestic power-module revenue and is scaling vertically from wafering to packaging. Subsidized wafer producers have reduced 6-inch SiC substrate prices to USD 500, which is one-third of international quotes, thereby accelerating design-in at domestic OEMs.[2]KrASIA, “Global Tech Industry Braces for 'China Shock' in Mature Chips,” kr-asia.com A robust NEV penetration forecast of 60% of passenger-car sales in 2025 ensures a sustained demand for SiC MOSFETs, GaN chargers, and power modules.
National 5G Base-Station Build-Out Driving RF Front-End IC Uptake
More than 5 million 5G macro-sites are required to meet coverage goals, each base station embedding triple the RF-front-end content of 4G systems. Domestic filter, PA, and antenna-tuning vendors gain early design wins, supported by preferential procurement clauses in equipment tenders. Spillover demand from massive-MIMO radios, small cells, and fixed-wireless CPE multiplies silicon volume for drivers, LNAs, and timing chips. Ongoing densification through 2028 guarantees a steady backlog for suppliers of RF CMOS, GaAs, and SiGe devices.
Restraints Impact Analysis*
| Restraint | (~) % Impact on CAGR Forecast | Geographic Relevance | Impact Timeline |
|---|---|---|---|
| US Export-Control Entity-List Restrictions on EUV and EDA Tools | -1.6% | National, affecting advanced node fabs | Long term (≥ 4 years) |
| Talent Drain to Overseas Design Houses | -0.8% | Major tech hubs: Beijing, Shanghai, Shenzhen | Medium term (2-4 years) |
| Electricity-Intensive Fabs Facing Provincial Carbon-Quota Caps | -0.5% | Manufacturing provinces with carbon constraints | Long term (≥ 4 years) |
| Persistent Price Volatility of 300 mm Prime Wafers | -0.4% | The global supply chain is affecting all regions | Short term (≤ 2 years) |
| Source: Mordor Intelligence | |||
US Export-Control Entity-List Restrictions on EUV and EDA Tools
Washington’s October 2024 and December 2024 rules bar shipment of EUV scanners, advanced deposition gear, and high-end EDA licenses to Chinese fabs. Domestic producers remain confined to 28 nm for mass production and must innovate around 7 nm proof-of-concept wafers without ASML EUV. Work-arounds include 2D-material transistors piloted at 1 nm gate length and advanced DUV multiple-patterning, but commercial yields are years away. Longer equipment lead-times, software license uncertainty, and compliance audits dampen the pace of node migration.
Talent Drain to Overseas Design Houses
China required 199,300 semiconductor professionals in 2022, yet had only 164,300 on payrolls, a gap widening as foreign firms offer premium packages and relocation support. Taiwanese prosecutors opened cases against 11 Chinese entities for alleged talent poaching, raising frictions and cross-strait scrutiny.[3]Taipei Times, “EDITORIAL: Keep Tech Talent In, Poachers Out,” taipeitimes.com Beijing has countered with 25 doctoral IC programs and “reverse-brain-drain” incentives; high-profile returnees such as former Apple RF engineer Kong Long signal partial success. Nevertheless, shortages remain acute in EDA algorithm design, device physics, and process-integration leadership, restricting project ramp-ups.
*Our forecasts treat driver/restraint impacts as directional, not additive. The impact forecasts reflect baseline growth, mix effects, and variable interactions.
Segment Analysis
By Device Type: Integrated Circuits Anchor Market Dominance
Integrated circuits accounted for 86.02% revenue in 2025, and their share is forecast to edge higher as AI, 5G, and server demand require larger die sizes and stacked V-cache solutions. Within the Chinese semiconductor market, integrated circuits are expected to expand at an 8.02% CAGR, adding more than USD 69.2 billion in new output by 2031. YMTC’s 232-layer 3D NAND and CXMT’s 80% DDR5 yield underscore momentum in memory, while SMIC’s 12-inch lines run at 89.6% utilization on robust consumer and industrial demand.
Discrete power devices, optoelectronics, and sensors together occupy the remaining 13.98% share but are benefiting from NEV electrification and 5G optical-component pull. Domestic SiC diode capacity is doubling every 18 months, and VCSEL shipments for 3D sensing in smartphones are moving to local fabs. Although smaller in value, these categories contribute critical differentiation in automotive safety, smart-factory deployments, and AR/VR hardware, sustaining multi-segment resilience.


By Business Model: Fabless Design Houses Outpace IDMs
Fabless companies captured 67.35% of the Chinese semiconductor market share in 2025 as design IP, system architecture, and software integration rose in strategic importance. The cohort is projected to grow at 7.78% CAGR to 2031, aligned with deep AI inference, computing, networking, and ASIC customization trends.
IDMs remain indispensable for power, automotive, and sensor devices where process control and quality traceability are paramount. BYD Semiconductor’s vertical model secures more than 70% in-house chip content for its electric vehicles, demonstrating IDM relevance in safety-critical systems. Yet, capex intensity and export-license risk give the fabless approach flexibility and capital efficiency, particularly as 28 nm and above nodes meet most domestic volume needs.
By End-User Industry: Communication Leads as AI Surges
The communication sector held 33.25% revenue share in 2025, thanks to 5G macro-site rollout and fiber backhaul upgrades that consume RF, optical, and network-switch silicon. AI workloads represent the fastest-growing slice, expanding at a 9.28% CAGR on hyperscaler build-outs and enterprise edge applications.
Automotive demand escalates as NEVs average USD 1,200 semiconductor content per vehicle, triple their 2020 level. Industrial users adopt Industry 4.0 PLCs and machine-vision modules, while consumer electronics remain steady on smart-home and AR devices. This blend diversifies revenue and cushions cyclical swings tied to smartphone refresh cycles.
Geography Analysis
Eastern-seaboard clusters generate a significant share of national output, with Beijing specializing in R&D, Shanghai in high-volume fabrication, and Shenzhen-Dongguan in design-heavy consumer electronics. The Yangtze River Delta commands the largest slice of China's semiconductor market size through co-located fabs, OSAT houses, and logistics corridors that shorten lead times to OEM assembly lines.
Government investment incentives allocate land, tax holidays, and below-market utility tariffs to anchor mega-fabs. SMIC’s Beijing, Shanghai, and Shenzhen sites together offer over 1.2 million 12-inch wafer-starts per month capacity and plan a further increase 250,000 wpm by 2027. Shenzhen’s focus on SoC design leverages proximity to Huawei HiSilicon, Oppo, and drone maker DJI, fostering tight feedback loops.
Inland provinces such as Anhui and Sichuan now court backend and compound-semiconductor lines to balance coastal congestion and energy constraints. NDRC earmarked CNY 3.33 trillion (USD 470 billion) for national R&D in 2024, part of which funds university research centers and inter-city high-speed rail links that reduce talent-mobility friction.
The semiconductor device market is analyzed by Mordor Intelligence across multiple other geographies, with in-depth regional assessments available for Asia and Europe. This is complemented by country-specific insights for South Korea and Japan, reflecting various localized market behavior and policy environments' coverage.
Competitive Landscape
SMIC and Huahong jointly hold under 20% of domestic foundry revenue, indicating moderate concentration among the 40-plus independent fabs. Memory specialist YMTC and DRAM player CXMT together account for a relatively small share of the China semiconductor device market size, while EDA supplier Empyrean has gained scale with its Xpeedic stake.
Strategic thrusts include vertical integration of BYD’s module-to-vehicle stack and ecosystem alliances such as STMicroelectronics’ partnership with Huahong for 40 nm MCU supply to Chinese automotive OEMs. Meanwhile, platform giants Alibaba, Tencent, and Huawei are expanding their in-house chip R&D efforts to secure supply, improve system optimization, and hedge against potential sanctions.
Novel architectures (2D-material transistors, RISC-V cores) and advanced packaging (chiplets, hybrid bonding) provide white-space for challengers. Consolidation is expected to accelerate as Big Fund III invests USD 47.5 billion in lithography, EDA, and talent development. The market, therefore, remains fragmented but on a clear path to a tighter oligopolistic structure.
China Semiconductor Device Industry Leaders
Semiconductor Manufacturing International Corp (SMIC)
Taiwan Semiconductor Manufacturing Co (TSMC)
Hua Hong Group
Samsung Electronics Co Ltd
Yangtze Memory Technologies Co (YMTC)
- *Disclaimer: Major Players sorted in no particular order


Recent Industry Developments
- June 2025: Big Fund III redirected fresh capital toward lithography and EDA, seeking domestic substitutes for ASML and Synopsys offerings.
- May 2025: SMIC reported USD 2.247 billion Q1 revenue with 89.6% utilization, expanding 28 nm lines in three cities.
- April 2025: YMTC raised CNY 1.6 billion (USD 220 million) to accelerate 232-layer NAND ramp.
- April 2025: Chinese researchers taped out a 1 nm RISC-V demo chip using 2D materials and DUV multi-patterning.


Research Methodology Framework and Report Scope
Market Definitions and Key Coverage
Our study defines the China semiconductor device market as annual revenue generated within the country from discrete semiconductors, optoelectronics, sensors and MEMS, and all classes of integrated circuits (analog, logic, memory and micro-devices) sold by IDMs and fabless vendors. The scope captures value at the manufacturer shipment level and therefore excludes outsourced assembly, test services, equipment, materials and design software.
Scope Exclusion: Equipment, EDA tools, and semiconductor materials remain outside the modeled market.
Segmentation Overview
- By Device Type (Shipment Volume for Device Type is Complementary)
- Discrete Semiconductors
- Diodes
- Transistors
- Power Transistors
- Rectifier and Thyristor
- Other Discrete Devices
- Optoelectronics
- Light-Emitting Diodes (LEDs)
- Laser Diodes
- Image Sensors
- Optocouplers
- Other Device Types
- Sensors and MEMS
- Pressure
- Magnetic Field
- Actuators
- Acceleration and Yaw Rate
- Temperature and Others
- Integrated Circuits
- By Integrated Circuit Type
- Analog
- Micro
- Microprocessors (MPU)
- Microcontrollers (MCU)
- Digital Signal Processors
- Logic
- Memory
- By Technology Node (Shipment Volume Not Applicable)
- < 3nm
- 3nm
- 5nm
- 7nm
- 16nm
- 28nm
- > 28nm
- By Integrated Circuit Type
- Discrete Semiconductors
- By Business Model
- IDM
- Design/ Fabless Vendor
- By End-user Industry
- Automotive
- Communication (Wired and Wireless)
- Consumer
- Industrial
- Computing/Data Storage
- Data Center
- AI
Detailed Research Methodology and Data Validation
Primary Research
Interviews and pulse surveys with domestic fabless founders, foundry planners, equipment distributors, and senior analysts in Shenzhen, Shanghai, and Beijing helped us refine unit yields, wafer-start plans, and average selling prices. They also tested preliminary elasticity assumptions before final modeling.
Desk Research
We started with public datasets from the China Customs Administration, the National Bureau of Statistics, and the World Semiconductor Trade Statistics program. We then added trade-body material from the China Semiconductor Industry Association as well as technical journals such as IEEE Xplore for node-migration benchmarks. Company filings, prospectuses and quarterly results supplied price and mix nuances, which were corroborated through paid libraries we access (D&B Hoovers for company financials and Dow Jones Factiva for news flow). These references are illustrative, not exhaustive; many other open sources were reviewed to fill information gaps and cross-check trends.
Market-Sizing & Forecasting
Our model begins with a top-down reconstruction of Chinese semiconductor demand using 5G handset shipments, NEV production, data-center server installs, three-year wafer-start trajectories and prevailing blended ASPs. Results are then pressure-tested through selective bottom-up checks such as sampled 28 nm and 14 nm wafer pricing and supplier roll-ups for Tier 1 IC vendors. Multivariate regression is applied on key drivers, including 5G base-station count, wafer capacity (mn wafers / month), and automotive SiC adoption rate to project the 2025-2030 path. Where bottom-up evidence is thin, variance caps driven by historical ASP compression ranges are used to constrain outliers.
Data Validation & Update Cycle
Modeled outputs pass a three-step review: analyst peer review, senior domain lead sign-off, and year-on-year anomaly screening against macro and trade indicators. Our reports refresh annually and are re-checked mid-cycle if export-control rules, subsidy policies, or large wafer-fab announcements materially alter the outlook.
Why Mordor's China Semiconductor Device Baseline Commands Reliability
Estimates published across firms vary because each group chooses different coverage lines, conversion methods and refresh cadences. Some tally packaging and equipment revenues, while others omit mature nodes or treat foundry sales as imports.
Benchmark comparison
| Market Size | Anonymized source | Primary gap driver |
|---|---|---|
| USD 217.55 B (2025) | Mordor Intelligence | - |
| USD 265.20 B (2024) | Global Consultancy A | Includes front-end equipment and OSAT revenues, inflating value |
| USD 190.00 B (2024) | Industry Journal B | Excludes discrete devices and counts only domestically owned vendors |
The comparison shows that when service lines are harmonized and mixed-node revenues are weighted by real ASP trends, Mordor Intelligence sits between optimistic and conservative extremes. This balanced stance, anchored to transparent variables and repeatable steps, provides decision-makers with a dependable baseline for strategy planning.


Key Questions Answered in the Report
What is the projected size of China’s semiconductor sector in 2031?
The market is forecast to reach USD 332.17 billion by 2031 on a 7.31% CAGR.
Which device category dominates Chinese chip revenue?
Integrated circuits held 86.02% of 2025 revenue and continue to lead.
How are export controls affecting Chinese fabs?
Controls that block EUV scanners and advanced EDA slow sub-10 nm migration and trim forecast CAGR by an estimated 1.6%.
Why is SiC important for China’s electric-vehicle plans?
Silicon-carbide devices raise drivetrain efficiency, and China is set to consume 40% of global SiC wafers by 2030.
Which province leads in design and fabless activity?
Guangdong, anchored by Shenzhen, hosts the largest cluster of fabless firms serving consumer and telecom OEMs.
How does the competitive landscape look?
The sector remains fragmented but is consolidating around SMIC, Huahong, YMTC, BYD Semiconductor, and rising fabless leaders.
Page last updated on:


