
Market Overview
| Study Period | 2020 - 2031 |
|---|---|
| Market Size (2026) | USD 3.62 Billion |
| Market Size (2031) | USD 9.04 Billion |
| Growth Rate (2026 - 2031) | 20.11% CAGR |
| Fastest Growing Market | Asia Pacific |
| Largest Market | Europe |
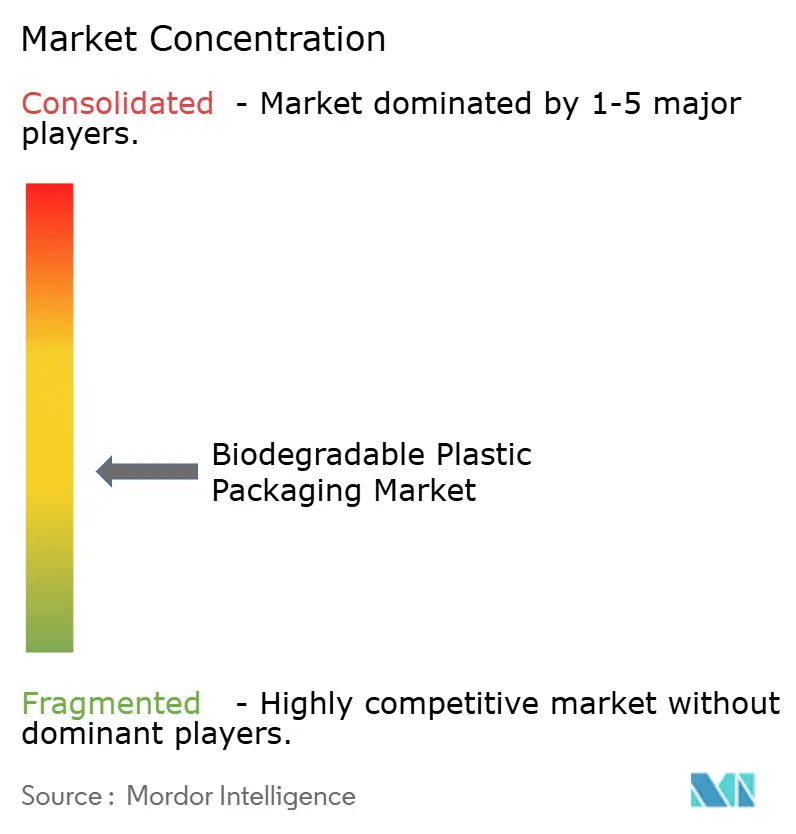
| Market Concentration | Medium |
Major Players *Disclaimer: Major Players sorted in no particular order Image © Mordor Intelligence. Reuse requires attribution under CC BY 4.0. | |
Biodegradable Plastic Packaging Market Analysis by Mordor Intelligence
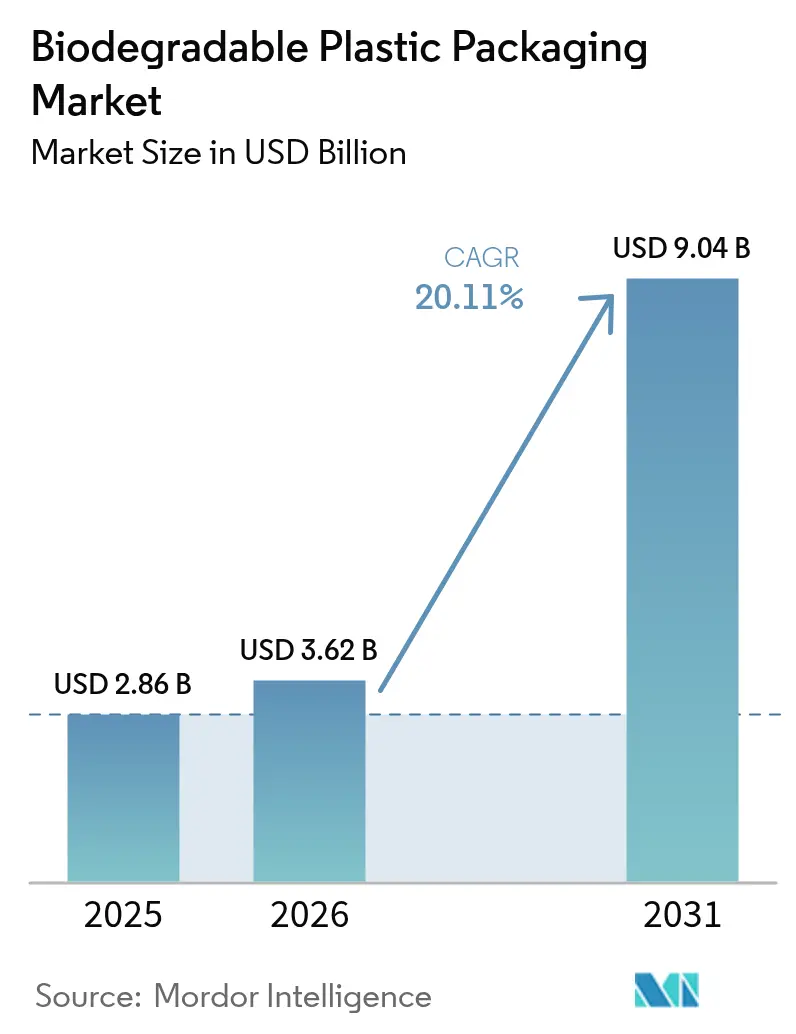
The Biodegradable Plastic Packaging Market size is projected to be USD 2.86 billion in 2025, USD 3.62 billion in 2026, and reach USD 9.04 billion by 2031, growing at a CAGR of 20.11% from 2026 to 2031.
Commercial demand is accelerating as governments tighten single-use plastic bans, retailers embed compostability metrics into supplier scorecards, and converters retrofit legacy film-blowing lines to run bio-resins. Brand owners are prioritizing end-of-life transparency on pack, which is boosting adoption of certified home-compostable formats in regions where industrial infrastructure is thin. Meanwhile, consolidation among global converters is reshaping capacity allocation toward recyclable fiber alternatives, forcing bio-resin suppliers to defend share with superior barrier performance and lower carbon footprints. Feedstock volatility for corn and sugarcane remains a structural challenge, yet new capacity planned in India and Europe aims to diversify geographic sourcing and stabilize long-term supply.
Key Report Takeaways
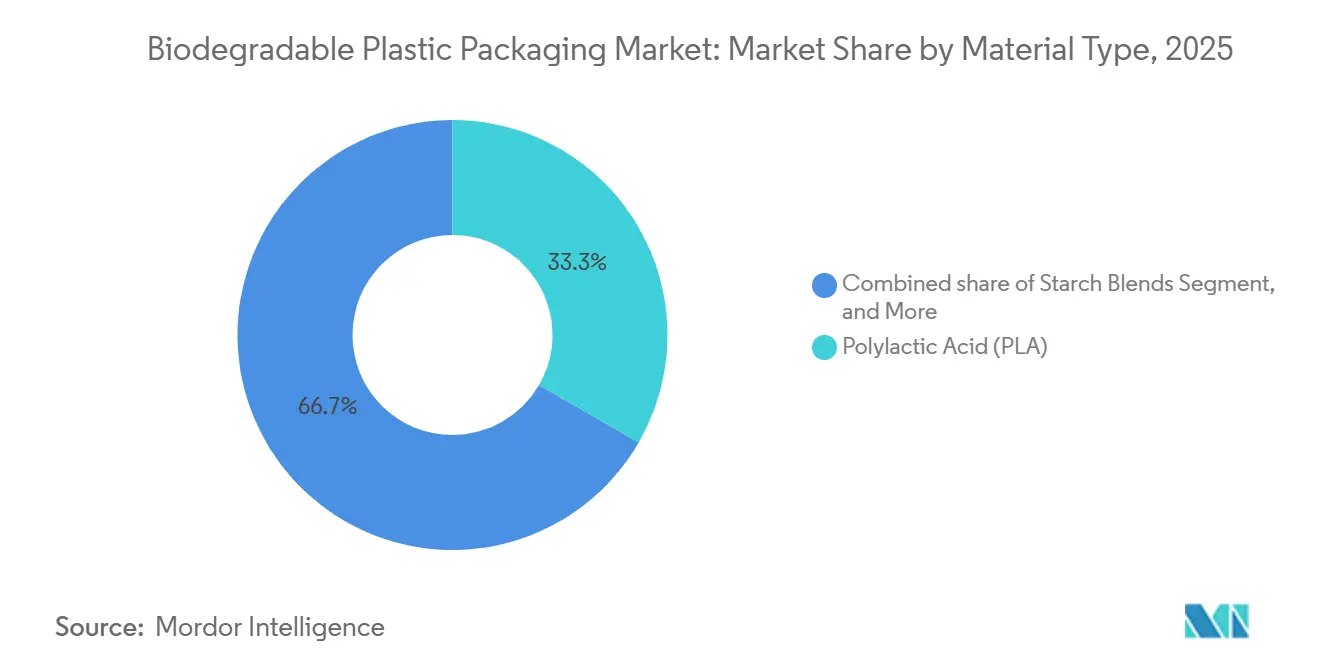
- By material type, polylactic acid led with 33.34% of the biodegradable plastic packaging market share in 2025, while polyhydroxyalkanoates are forecast to expand at a 21.43% CAGR through 2031.
- By packaging type, flexible formats accounted for 46.37% of the biodegradable plastic packaging market in 2025, yet rigid formats are projected to grow at a 20.39% CAGR through 2031.
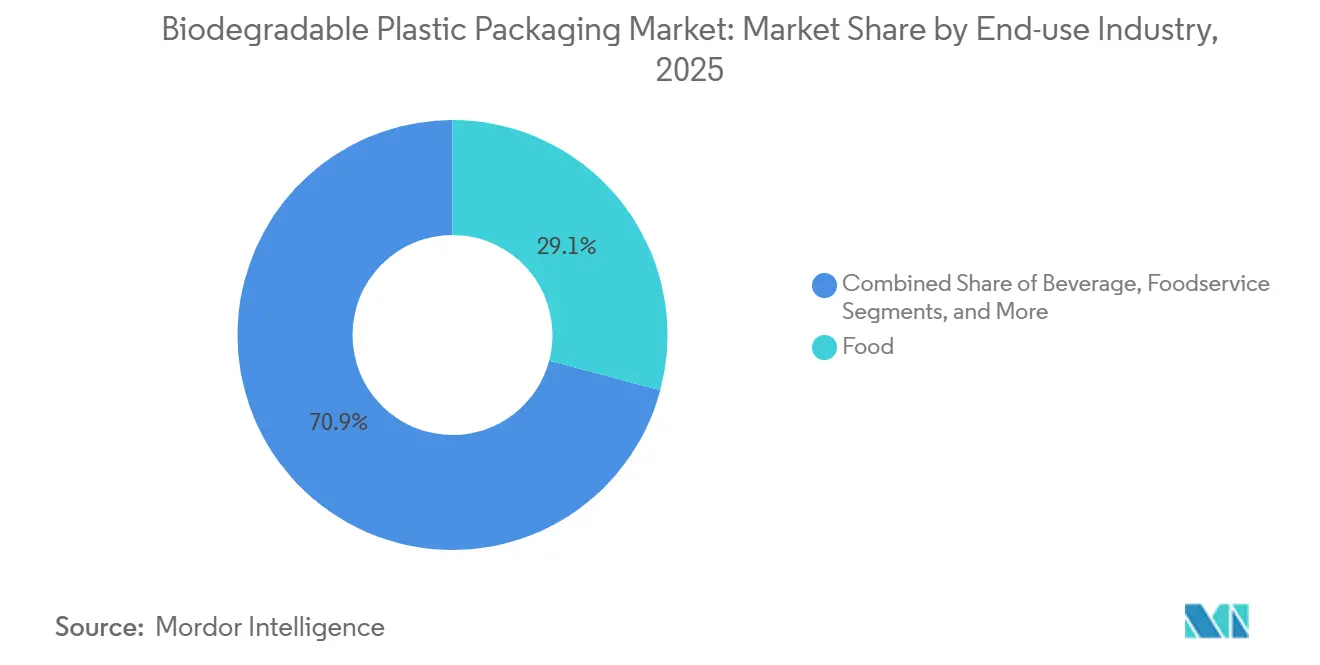
- By end-use industry, food accounted for 29.13% of revenue share in 2025, whereas personal care and home care are poised to grow at a 21.67% CAGR during 2026-2031.
- By compostability, industrial-compostable solutions captured 57.04% of the market in 2025, but home-compostable formats are gaining at a 20.43% CAGR over the forecast period.
- By geography, Europe retained a 39.37% share in 2025, yet Asia-Pacific is the fastest-growing region at a 21.18% CAGR through 2031.
Note: Market size and forecast figures in this report are generated using Mordor Intelligence’s proprietary estimation framework, updated with the latest available data and insights as of 2026.
Global Biodegradable Plastic Packaging Market Trends and Insights
Drivers Impact Analysis*
| Driver | (~) % Impact on CAGR Forecast | Geographic Relevance | Impact Timeline |
|---|---|---|---|
| Accelerated Bans On Single-Use Petro-Plastic Packaging Across EU And India | +4.2% | Europe, Asia-Pacific (India) | Short Term (≤ 2 Years) |
| Food-Delivery App Proliferation Requiring Compost-Ready Formats In North America | +3.1% | North America | Medium Term (2–4 Years) |
| Retailer Plastic-Neutral Pledges Boosting Demand | +2.8% | Global, Focused On North America And Europe | Medium Term (2–4 Years) |
| Re-Tooling Of Existing Film-Blowing Lines To Run Bio-Resins | +2.3% | Global | Long Term (≥ 4 Years) |
| Brand Shift To Transparent Carbon Labeling On Packs | +1.9% | Global | Medium Term (2–4 Years) |
| Corporate-Level Internal Carbon Price Adoption Above USD 70 t-CO₂ | +1.6% | Global | Long Term (≥ 4 Years) |
| Source: Mordor Intelligence | |||
Accelerated Bans On Single-Use Petro-Plastic Packaging Across EU And India
Regulatory enforcement rather than voluntary pledges is now steering procurement. India’s single-use plastic ban prompted 861,740 inspections and the seizure of 1,985 t of contraband items, along with monetary penalties that deter non-compliant imports.[1]Ministry of Environment Forest and Climate Change, “Single-Use Plastic Ban Enforcement Data,” moef.gov.in The European Regulation 2025/40 restricts compostable packaging to tea bags, coffee pods, and fruit labels where industrial composting exists, increasing certification costs and narrowing eligible applications.[2]European Commission, “Regulation (EU) 2025/40 on Packaging and Packaging Waste,” ec.europa.eu India’s Solid Waste Management Rules 2026 require four-stream segregation at source, a mandate that favors standardized biodegradable formats certified by bodies such as TÜV Austria. Collectively, these measures push brands toward verifiable bio-resin solutions and expand the addressable market for biodegradable plastic packaging.
Food-Delivery App Proliferation Requiring Compost-Ready Formats In North America
DoorDash, Uber Eats, and Grubhub delivered billions of take-away meals during 2024-2025, transferring packaging responsibility from restaurants to municipalities. The United States Environmental Protection Agency estimates that USD 36-43 billion of infrastructure is required by 2030 to manage organics and recyclables.[3]United States Environmental Protection Agency, “National Strategy for Reducing Food Loss and Waste and Recycling Organics,” epa.gov Closed Loop Partners funded eight new composting projects in 2025, yet fewer than 200 U.S. sites currently accept certified compostable packaging. This mismatch is driving first-mover advantage for converters supplying home-compostable SKUs certified to ASTM D6400 and EN 13432, enabling them to bypass industrial bottlenecks.
Retailer Plastic-Neutral Pledges Boosting Demand
Walmart’s Project Gigaton asks suppliers to prove progress on recyclable or compostable packaging, anchoring procurement contracts to verified impact metrics.[4]Walmart, “Project Gigaton and Plastic Packaging Reduction,” corporate.walmart.com Carrefour eliminated single-use plastics from several private-label lines across Europe and now mandates compostability or recyclability for new tenders. Retail compliance portals translate these pledges into purchase orders, thereby lowering demand risk for bio-resin producers. The Ellen MacArthur Foundation reported a 6% reduction in virgin plastic use among signatories between 2018 and 2024, reinforcing a systemic pivot toward lower-impact materials.
Re-Tooling Of Existing Film-Blowing Lines To Run Bio-Resins
Retrofits cost roughly 10-20% of the original line price, largely for screws, dies, and temperature controls, allowing converters to switch material grades without building greenfield capacity. BASF’s ecovio-based Ezycompost launch in 2025 demonstrates how tailored resins can fit existing equipment windows while meeting home-compost standards. These lower capital hurdles shorten payback periods and speed scale-up, giving medium-sized players access to the biodegradable plastic packaging market.
Restraints Impact Analysis*
| Restraint | (~) % Impact on CAGR Forecast | Geographic Relevance | Impact Timeline |
|---|---|---|---|
| Tight Industrial-Composting Infrastructure Outside Western Europe | -3.8% | Global | Short Term (≤ 2 Years) |
| Feedstock Price Volatility For PLA (Corn, Sugarcane) | -2.1% | Global | Medium Term (2–4 Years) |
| Consumer Confusion Around “Compostable” Versus “Biodegradable” Claims | -1.4% | Global | Medium Term (2–4 Years) |
| Mechanical-Recycling Stream Contamination Penalties In U.S. And Japan | -1.2% | North America, Asia-Pacific | Short Term (≤ 2 Years) |
| Source: Mordor Intelligence | |||
Tight Industrial-Composting Infrastructure Outside Western Europe
Fewer than 200 U.S. plants accept certified compostable packaging, and many municipalities outright exclude it due to contamination risks. India’s segregation mandate lacks matching compost capacity, leaving peri-urban regions dependent on landfill. The EU’s Regulation 2025/40 cements these constraints by authorizing compostability only where proven facilities exist. As a result, home-compostable alternatives gain traction, though they often sacrifice moisture and oxygen barriers, limiting use in high-performance flexible films.
Feedstock Price Volatility For PLA (Corn, Sugarcane)
Corn averaged USD 4-5 bushel during 2024-2025, yet remains prone to weather shocks, compressing polylactic acid margins. TotalEnergies Corbion’s Thai plant relies on sugarcane, and Brazilian cane yields dipped in 2024 before stabilizing one year later. Balrampur Chini Mills’ 80,000 t y-1 Indian facility, slated for commissioning in October 2026, will cost INR 2,850 crore (USD 347 million) and aims to localize feedstock supply. Even so, commodity-linked cost swings remain a competitive disadvantage against petro-plastic incumbents.
*Our forecasts treat driver/restraint impacts as directional, not additive. The impact forecasts reflect baseline growth, mix effects, and variable interactions.
Segment Analysis
By Material Type: PHA Gains Despite Production Setbacks
Polylactic acid contributed the largest biodegradable plastic packaging market size in 2025, reflecting established scale at NatureWorks’ 150,000 t y-1 U.S. plant and TotalEnergies Corbion’s 75,000 t y-1 Thai facility. Polyhydroxyalkanoates, however, are projected to post the strongest CAGR at 21.43%, buoyed by superior barrier and marine degradation properties. Although Danimer Scientific filed for bankruptcy in 2025, Meredian Holdings acquired its assets, signaling continued investor interest in PHA. Starch blends sustain cost-sensitive shopping bags, while BASF’s ecovio combines PBAT and PLA to boost toughness in food wraps. Polybutylene succinate serves mulch films and rigid cups where heat resistance is critical. Balrampur Chini Mills’ upcoming Indian PLA line will add regional redundancy, softening import exposure for South Asian converters. Small-volume cellulose and polyvinyl alcohol films cater to water-soluble or high-oxygen-barrier niches, keeping the biodegradable plastic packaging industry diversified.
The medium-term outlook hinges on feedstock dynamics. Corn price plateaus hold current PLA spot rates, whereas sugarcane-linked costs leave PBS and PHA pricing vulnerable to El Niño events. Certification clarity from TÜV Austria and the Biodegradable Products Institute is narrowing performance variability perceptions and fostering multi-material blends that pair PLA’s processability with PHA’s ambient compostability. This interplay is expected to sustain double-digit expansion for the entire biodegradable plastic packaging market through 2031.



By Packaging Type: Rigid Formats Accelerate On Foodservice Demand
Flexible films dominated revenue in 2025, thanks to thin-gauge efficiencies in snacks, fresh produce, and bakery segments. Yet rigid trays, clamshells, and coffee pods are now the fastest-growing sub-sector at a 20.39% CAGR, lifted by municipal bans on expanded polystyrene and rising carry-out meals. Sealed Air’s CRYOVAC compostable meat tray illustrates how multi-layer coatings can deliver moisture and oxygen resistance without compromising compostability. Coffee brands are piloting PHA or molded-fiber pods to replace aluminum or multi-laminate capsules by 2027. Flexible wrap growth will persist in e-commerce mailers and produce bags, but the value upside lies in converted rigid systems where brand differentiation is visible on the shelf and disposal instructions are explicit. Amcor’s alliance with Metsä Group to commercialize molded fiber trays underscores an industry pivot toward recyclable fiber even within the broader biodegradable plastic packaging market.
Compostability labeling rules are another accelerant. The EU’s new pictograms require clear consumer instructions, favoring uniform rigid substrates over multi-material flexibles. North American foodservice chains increasingly specify ASTM D6400 conformity, boosting demand for thermoformed bowls and cutlery made from PLA-PBAT blends. This regulatory plus consumer pressure synergy positions rigid formats as a key growth pillar inside the biodegradable plastic packaging market size forecast.
By End-Use Industry: Personal Care Emerges As Growth Leader
Food applications accounted for the majority of revenue in 2025, yet personal care and home care brands are projected to deliver the steepest uptick, with a 21.67% CAGR. Transparent carbon labels help shampoos, detergents, and skin-care SKUs communicate lower life-cycle impacts, and compostable film sachets or rigid jars are now commercially available. Unilever and Procter & Gamble are piloting refill pods made from home-compostable resins that dissolve under ambient microbial action. In foodservice, institutional kitchens adopt compo-certified cutlery and takeaway boxes to comply with city diversion targets, driving incremental volume in the biodegradable plastic packaging market. Beverage penetration lags owing to oxygen sensitivity, but polyethylene furanoate projects could unlock next-generation bio-bottles before 2030. Pharmaceuticals contribute a small but strategic demand in blister packs that can be incinerated cleanly post-use, aligning with hospital waste protocols. Agricultural films represent a niche yet high-value outlet in which in-soil degradation reduces retrieval labor costs.
Consumer sentiment studies indicate willingness to pay premiums for green beauty packaging, a trend amplified through social media. Marquee launches, such as compostable mascara tubes and solid shampoo bars in PHA jars, are setting category benchmarks. This behavioral pull reinforces a durable demand runway for the biodegradable plastic packaging industry beyond traditional grocery aisles.
By Compostability: Home-Compostable Formats Gain Momentum
Industrial-compostable products still lead biodegradable plastic packaging market share, yet home-compostable offerings are closing the gap swiftly due to infrastructure scarcity in North America and large parts of Asia. TÜV Austria OK Compost Home seals provide consumers with clear disposal guidance, and backyard-ready formats are now viable for dry snacks, personal care refills, and some bakery goods. BASF’s Ezycompost barrier paper is among the first mainstream launches targeting this channel. In contrast, EN 13432-certified industrial items remain essential for high-grease or high-moisture foods that demand elevated barrier performance.
Municipal regulations reinforce this bifurcation. U.S. curbside programs rarely accept compostable plastics, prompting retailers to favor backyard options. Europe’s infrastructure head-start sustains the industrial stream, though Regulation 2025/40 narrows allowable SKUs, ensuring only use-cases with proven organics pathways persist. Brand owners balancing global SKUs increasingly employ dual-certification, pairing home-compostable specs for North America with industrial standards for Europe, keeping the overall biodegradable plastic packaging market agile across jurisdictions.
Geography Analysis
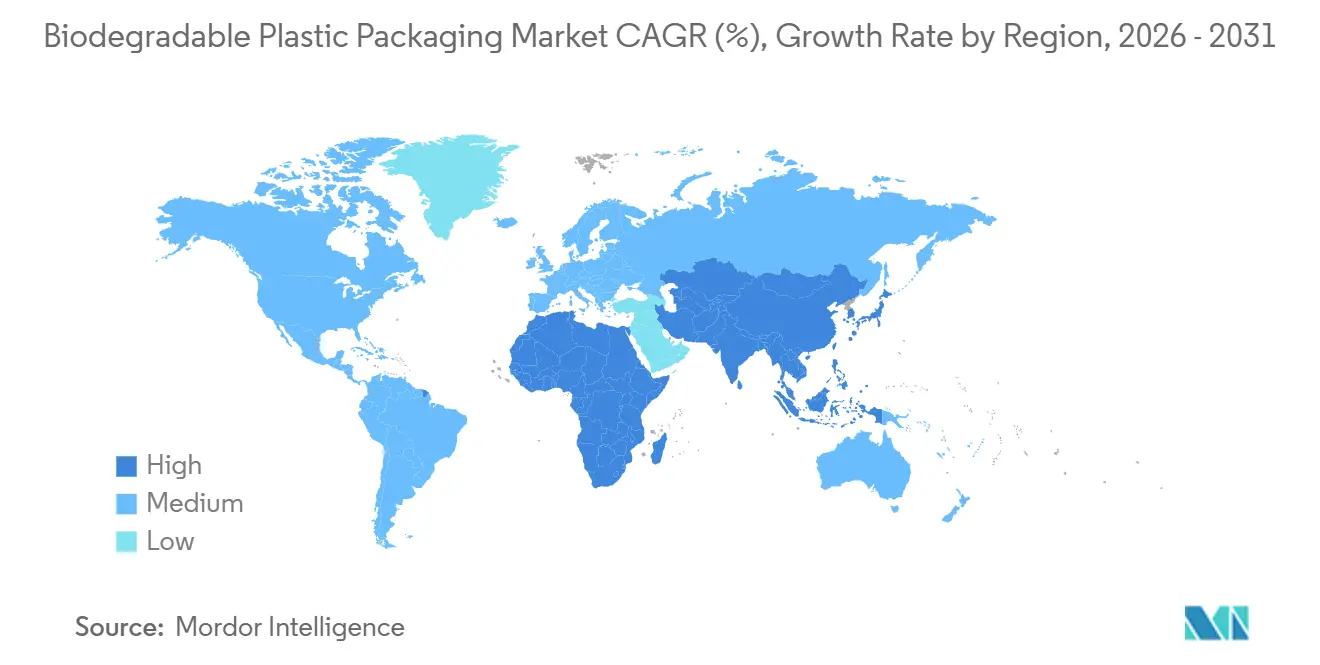
Europe maintained the largest biodegradable plastic packaging market size in 2025 on the back of integrated composting networks and stringent single-use bans. Germany, France, and the Netherlands operate dense organics collection systems that accept EN 13432-certified packs, giving converters a predictable end-of-life channel. Market growth, however, is moderating as the new EU law limits compostability to narrow use-cases, steering incremental investment toward recyclable fiber.
Asia-Pacific is the breakout growth region at a 21.18% CAGR. China’s five-year plan subsidizes bio-resin expansion, and India’s upcoming PLA line from Balrampur Chini Mills reduces import dependency while meeting domestic plastic-ban quotas. Australia and New Zealand lead municipal home-compost programs, offering proof-of-concept for backyard degradation standards across the wider area. Feedstock abundance in Thailand, Indonesia, and the Philippines supports PLA and PBS cost bases, reinforcing regional competitiveness within the biodegradable plastic packaging market.
North America trails Europe on absolute share but shows a strong pipeline of infrastructure funding. Closed Loop Partners’ grants and state-level extended producer responsibility bills forecast a gradual uptick in industrial composting capacity, though real impact will materialize post-2030. Canada’s zero-plastic-waste agenda encourages pilot curbside trials, while Mexico weighs nationwide bag bans modeled on Chilean law. South America remains nascent; Brazil experiments with mandated compostable shopping sacks in São Paulo, yet landfill reliance hampers scale. The Middle East and Africa record sporadic adoption in hospitality and luxury retail, chiefly in the United Arab Emirates, Saudi Arabia, and South Africa where sustainability certification is part of destination branding. These geographies together contribute a modest but rising slice of the biodegradable plastic packaging industry as multinationals push uniform ESG targets.

Regulatory Landscape
Regulatory action is tightening definitions and allowable use-cases for compostable and biodegradable packaging, shifting demand toward certified formats and stronger documentation. In the European Union, Regulation (EU) 2025/40 on Packaging and Packaging Waste entered into force on 11 February 2025 and applies from 12 August 2026, setting harmonized sustainability and labeling requirements across the packaging life cycle and narrowing where compostable plastic packaging is treated as appropriate.
Outside the EU, market access is shaped by country-specific rules and product safety pathways. In the United States, food-contact eligibility for biodegradable polymers continues to run through the FDA Food Contact Substance Notification (FCN) framework rather than a single federal biodegradability standard, so compliance remains focused on intended conditions of use and substantiation for each notification. In India, the Solid Waste Management Rules 2026 mandate four-stream segregation at source, which increases the practical value of recognizable third-party compostability certification such as TÜV Austria to reduce consumer confusion and enforcement risk.
Value Chain Analysis
The value chain covers agricultural and bio-based feedstock suppliers (corn and sugarcane), bio-resin producers (notably PLA and blends such as PBAT/PLA), and packaging converters that turn resins into flexible films and rigid formats. Brand owners and retailers set supplier requirements, while end-of-life channels include industrial composting, limited organics acceptance programs, and, in some cases, home composting. Large-scale resin supply remains concentrated around integrated producers such as NatureWorks and TotalEnergies Corbion, while specialty suppliers such as BASF with ecovio support converters seeking tuned performance and certification outcomes.
Key bottlenecks sit in conversion economics and end-of-life acceptance. Biobased and biodegradable plastics can carry meaningful cost premiums versus conventional plastics, and limited industrial composting acceptance in markets such as the United States constrains industrial-compostable throughput, pushing more design work toward home-compostable or hybrid pathways. Converter retrofits (including screw, die, and temperature-control changes for film-blowing lines) and certification and traceability efforts tied to ASTM D6400, EN 13432, TÜV Austria, and BPI are important midstream steps that determine which products can scale through retailer portals and municipal waste systems.
Competitive Landscape
Three multibillion-dollar mergers between 2024 and 2025 rewired the market hierarchy. Amcor’s USD 8.4 billion acquisition of Berry Global widened its flexible and rigid portfolio and signaled a strategic tilt toward fiber-based trays. Novolex’s USD 6.7 billion bid for Pactiv Evergreen consolidates North American foodservice packaging, giving the combined company unmatched restaurant reach. CD&R’s USD 10.3 billion purchase of Sealed Air folds protective films into a private-equity platform betting on material-agnostic solutions.
While mega-deals trend toward recyclability, specialized players target white-space opportunities inside the biodegradable plastic packaging market. Avantium inked a joint development agreement with Amcor Rigid Packaging on polyethylene furanoate, securing capacity reservation that de-risks scale-up. BASF collaborates with Metpack on home-compostable barrier papers to meet bakery and dry goods demand. Meredian Holdings’ rescue of Danimer’s PHA assets underscores continued appetite for advanced bio-polyesters despite prior balance-sheet strain.
Certification differentiation is intensifying. TÜV Austria and the Biodegradable Products Institute have become gatekeepers as retailers mandate proof of home or industrial degradation. Converters without dual certification face delisting risk. Feedstock integration is another battleground: NatureWorks and TotalEnergies Corbion control large PLA capacities, but upcoming Indian and European plants promise to dilute concentration and moderate price swings. Overall, competition pivots on speed to validate performance under evolving regulatory definitions, rather than on raw tonnage alone.
Biodegradable Plastic Packaging Industry Leaders
Amcor plc
BASF SE
NatureWorks LLC
Tetra Pak International S.A.
Kuraray Co., Ltd.
- *Disclaimer: Major Players sorted in no particular order

Market Opportunities and Future Outlook
Compliance-led packaging redesign in Europe creates an opportunity for suppliers that can provide PPWR-ready documentation and clearer consumer labeling ahead of the 12 August 2026 application date for Regulation (EU) 2025/40. This increases value for converters and resin suppliers that can deliver certified compostable or functionally equivalent low-impact solutions in permitted use-cases, while also supporting fiber-compatible barrier layers for applications moving toward paper recycling streams.
Supply expansion and localized manufacturing are opening whitespace in Asia and North America, especially where brand owners prioritize secure sourcing and certified performance. NatureWorks opened a fully integrated 75,000 metric ton per annum PLA facility in Thailand in April 2026, while Balrampur Chini Mills has an 80,000 tpa PLA project underway in Uttar Pradesh, supported by state-policy incentives under the Uttar Pradesh Bio Plastic Industrial Policy 2024 and helping converters in South Asia build regional redundancy. In the United States, NantBioRenewables expanded manufacturing in Gadsden, Alabama in April 2026 to add multi-material capabilities, including TÜV-certified home-compostable and BPI-certified commercially compostable materials, aligning product development with markets where industrial composting access is uneven and certification acts as a procurement gatekeeper.
Recent Industry Developments
- June 2026: Amcor partnered with Kelpi to evaluate seaweed-based barrier coatings for the AmFiber fiber-based packaging platform. The collaboration targets functional barrier performance while keeping packs compatible with fiber-centric circularity pathways, and it helps Amcor broaden sustainable packaging options where compostable plastics face acceptance constraints.
- November 2025: CD&R finalized its USD 10.3 billion acquisition of Sealed Air. The deal consolidated capabilities across protective and food packaging, shaping how large converters allocate R&D and production toward material-agnostic solutions that include compostable and bio-based formats alongside recyclable alternatives.
- September 2024: Avantium, Tereos, and LVMH signed a memorandum to construct a large-scale polyethylene furanoate (PEF) plant in Europe targeting premium beverage and cosmetic packaging. The project underlined brand-led pull for next-generation bio-based polymers and reinforced investment interest in high-barrier, lower-fossil-content packaging materials.


Research Methodology Framework and Report Scope
Market Definition and Coverage
This market covers packaging solutions made using biodegradable plastics that are designed to break down under defined conditions, and that are sold into packaging applications across end-use industries. It is measured in value terms and reflects the demand for finished packaging formats, not just raw resin output.
Scope exclusions: We exclude non-biodegradable bioplastics and conventional fossil-based plastic packaging, and we also avoid counting recycling services or waste-management revenues as part of the packaging market value.
Segmentation Overview
- By Material Type
- Starch Blends
- Polylactic Acid (PLA)
- Poly(Butylene Adipate-co-Terephthalate) (PBAT)
- Polybutylene Succinate (PBS)
- Polyhydroxyalkanoates (PHA)
- Other Material Types
- By Packaging Type
- Flexible Packaging
- Bags and Pouches
- Films and Wraps
- Labels and Sleeves
- Rigid Packaging
- Tableware
- Trays and Bowls
- Food Containers
- Coffee Cups and Pods
- Other Rigid Packaging
- Flexible Packaging
- By End-use Industry
- Food
- Beverage
- Foodservice
- Personal Care and Home Care
- Pharmaceutical
- Other End - Use Industry
- By Compostability
- Home-Compostable
- Industrial-Compostable
- By Geography
- North America
- United States
- Canada
- Mexico
- Europe
- Germany
- United Kingdom
- France
- Italy
- Spain
- Russia
- Rest of Europe
- Asia-Pacific
- China
- India
- Japan
- South Korea
- Australia and New Zealand
- Rest of Asia-Pacific
- Middle East
- Middle East
- United Arab Emirates
- Saudi Arabia
- Turkey
- Rest of Middle East
- Africa
- South Africa
- Nigeria
- Egypt
- Rest of Africa
- South America
- Brazil
- Argentina
- Rest of South America
- North America
Data Sources, Market Sizing, and Validation
Desk Research
Desk work starts with public packaging, plastics, and environment data so the model is anchored to real-world activity. We refer to sources such as the US Environmental Protection Agency for waste and material context, Eurostat for packaging and trade indicators, and UN Comtrade for import-export direction checks for packaging-related materials and articles.
To keep the market scope practical, we also review sources such as the European Commission and other national environment agencies for policy signals tied to compostable and biodegradable claims, along with peer-reviewed journal articles that discuss biodegradation standards and material performance. Company annual reports, investor presentations, and press releases are used to understand product mix and pricing direction, and a paid subscription for company financials and patent analytics is used selectively to confirm capacity additions and technology focus. These desk sources are not exhaustive, and additional public references are also used to cross-check, validate, and clarify data during the study.
Primary Interviews and Surveys
Primary work is used to pressure-test pricing and adoption assumptions, especially where public statistics do not isolate biodegradable plastics cleanly from other packaging materials. We speak with stakeholders across the value chain, including material suppliers, packaging converters, brand procurement teams, and compostability and compliance specialists across APAC, EMEA, and the Americas, then map the insights back to the market model parameters.
Distribution of primary research fieldwork respondents
| Company type | Respondent position | Region |
|---|---|---|
| Top tier: 33% | CXOs: 16% | APAC: 44% |
| Mid tier: 49% | Functional/Unit leaders: 39% | EMEA: 37% |
| Smaller Players: 18% | Managers: 45% | Americas: 19% |
Market-Sizing & Forecasting
Our core sizing uses a top-down build where packaging demand is reconstructed from end-use packaging consumption signals and the expected penetration of biodegradable formats, which is then translated into value using verified price bands. To keep the result grounded, selective bottom-up approximations are also run, including sampled converter revenues, channel checks on finished pack pricing, and volume-to-value conversions using representative average selling prices.
Key model inputs include packaged food and beverage output trends, retail and e-commerce shipment intensity (as a proxy for protective packaging usage), reported compostable and biodegradable packaging adoption commitments, resin and film price direction, and regional policy timelines that influence substitution from conventional plastics. Where a bottom-up check cannot cover smaller local players, gaps are handled through conservative scaling based on observed share patterns in comparable countries and packaging categories.
Forecasting is driven using scenario analysis supported by simple multivariate relationships between packaged goods output, policy adoption timing, and pricing progression, with expert feedback used to keep the adoption curve realistic. Assumptions are documented so the same steps can be repeated when fresh trade, pricing, or policy information becomes available.
Data Validation & Update Cycle
Validation is done through several passes so the final numbers do not rely on a single data trail. Model outputs are checked against independent indicators such as packaging demand direction, regional policy milestones, and observed price movements for compostable and biodegradable packaging materials, and any sharp jumps are investigated before sign-off.
Peer review is applied at key steps, including scope alignment, input sanity checks, and forecast reasonableness, and then a final analyst review is completed before delivery. Reports are refreshed annually, and interim updates are triggered when material events occur, such as major regulatory changes, large capacity additions, or notable price shocks that can shift near-term market value.
Mordor Intelligence's Biodegradable Plastic Packaging Solutions Market Market Estimate Compared With Other Published Estimates
Published market values for biodegradable plastic packaging solutions often do not match because the boundary is not consistent and the evidence used to anchor demand can vary. Differences typically come from what is counted as biodegradable packaging, the year used for pricing, and whether the estimate is validated against real packaging consumption signals.
Import-export direction checks for packaging-related plastics and the observed spread between resin pricing and finished packaging prices are the kinds of evidence used to keep assumptions tied to how the market is actually transacting, and this is also what links Mordor Intelligence to the 2026 value point used in the table. Other published figures can also shift if they mix broader biodegradable packaging that includes paper-based formats, or if they rely on a single base year and then project forward without rechecking adoption and pricing changes.
Benchmark comparison
| Source | Market Size | Gaps in Research Methodology |
|---|---|---|
| Mordor Intelligence | USD 3.62 B (2026) | |
| Global Research Desk A | USD 10.30 B (2024) | Uses a biodegradable segment within a broader bioplastic packaging scope, and the cut year and price base differ, which can lift the value if higher-priced formats or a wider bioplastic set are implicitly included. |
| Industry Publisher B | USD 16.01 B (2025) | Combines biodegradable paper and plastic packaging in one total, which expands the product boundary beyond biodegradable plastics and can materially increase the reported market size. |
The spread across the three numbers is largely explained by boundary control and the year-specific pricing used to convert demand into revenue. By keeping the count focused on biodegradable plastics in packaging and cross-checking adoption and pricing with external signals, the estimate stays transparent and easier to reconcile to repeatable inputs.


Key Questions Answered in the Report
What is the projected value of the biodegradable plastic packaging market by 2031?
The market is forecast to reach USD 9.04 billion by 2031 on the back of a 20.11% CAGR from 2026-2031.
Which material leads current revenue?
Polylactic acid contributed 33.34% of revenue in 2025, supported by large-scale plants in the United States and Thailand.
Which region is expected to grow the fastest?
Asia-Pacific is projected to record a 21.18% CAGR through 2031 as China and India scale bio-resin output.
Why are home-compostable formats gaining popularity?
Limited industrial composting capacity outside Western Europe pushes brands to adopt backyard-degradable packaging certified to TÜV Austria or ASTM D6400.
How are mergers changing the competitive landscape?
Acquisitions by Amcor, Novolex, and CD&R between 2024 and 2025 consolidated flexible and rigid capabilities, steering investment toward fiber and recyclable alternatives.
What hampers wider adoption of PLA?
Feedstock price swings for corn and sugarcane compress margins, making price stability a persistent challenge for polylactic acid producers.
Page last updated on:






