Radiotherapy Market Size and Share
Market Overview
| Study Period | 2020 - 2031 |
|---|---|
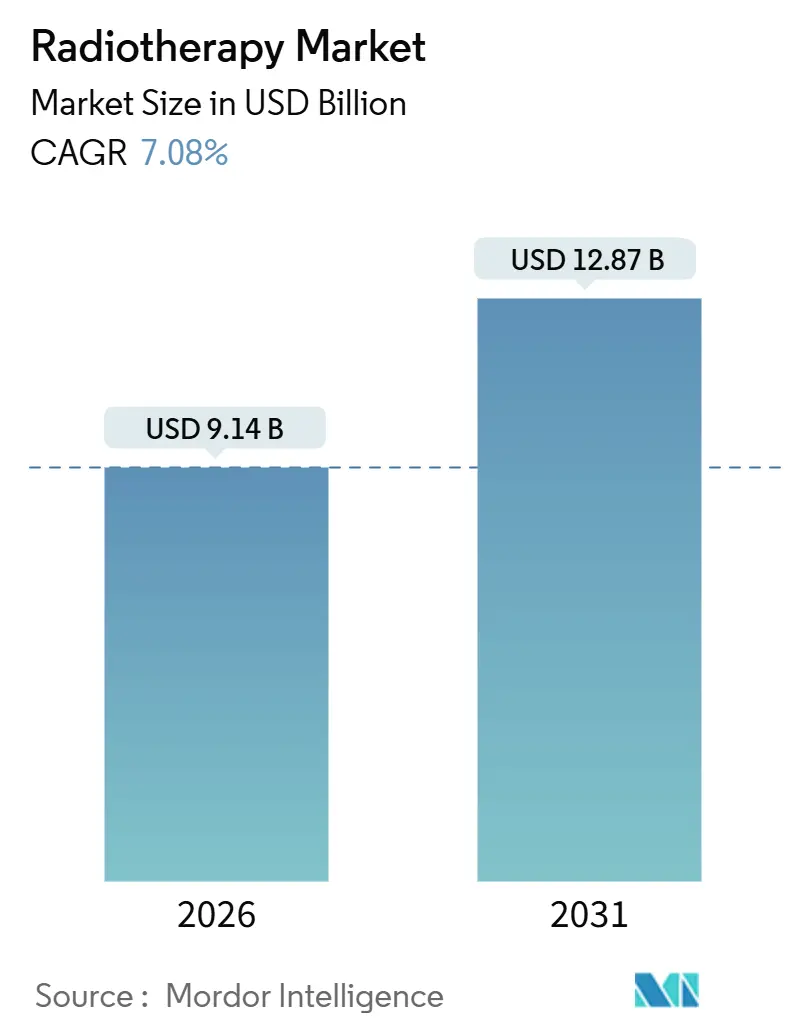
| Market Size (2026) | USD 9.14 Billion |
| Market Size (2031) | USD 12.87 Billion |
| Growth Rate (2026 - 2031) | 7.08% CAGR |
| Fastest Growing Market | Asia Pacific |
| Largest Market | North America |
| Market Concentration | Medium |
Major Players *Disclaimer: Major Players sorted in no particular order Image © Mordor Intelligence. Reuse requires attribution under CC BY 4.0. | |
Radiotherapy Market Analysis by Mordor Intelligence
The Radiotherapy Market size is estimated at USD 9.14 billion in 2026, and is expected to reach USD 12.87 billion by 2031, at a CAGR of 7.08% during the forecast period (2026-2031).
Current growth is anchored in rising precision-medicine protocols, wider outpatient reimbursement, and deployment of artificial-intelligence (AI) tools that compress planning timelines. External beam modalities currently dominate revenue, yet targeted radiopharmaceuticals are gaining momentum as late-stage options receive approval and coverage. Demand for image guidance and adaptive planning is stimulating software upgrades that defer capital spending on additional treatment rooms. In parallel, middle-income national cancer plans are underwriting new installations across the Asia-Pacific region, offsetting capital-expenditure headwinds in Europe, where higher borrowing costs are delaying proton therapy room projects. Supply fragility for key radioisotopes and an acute shortage of certified medical physicists remain the chief operational risks.
Key Report Takeaways
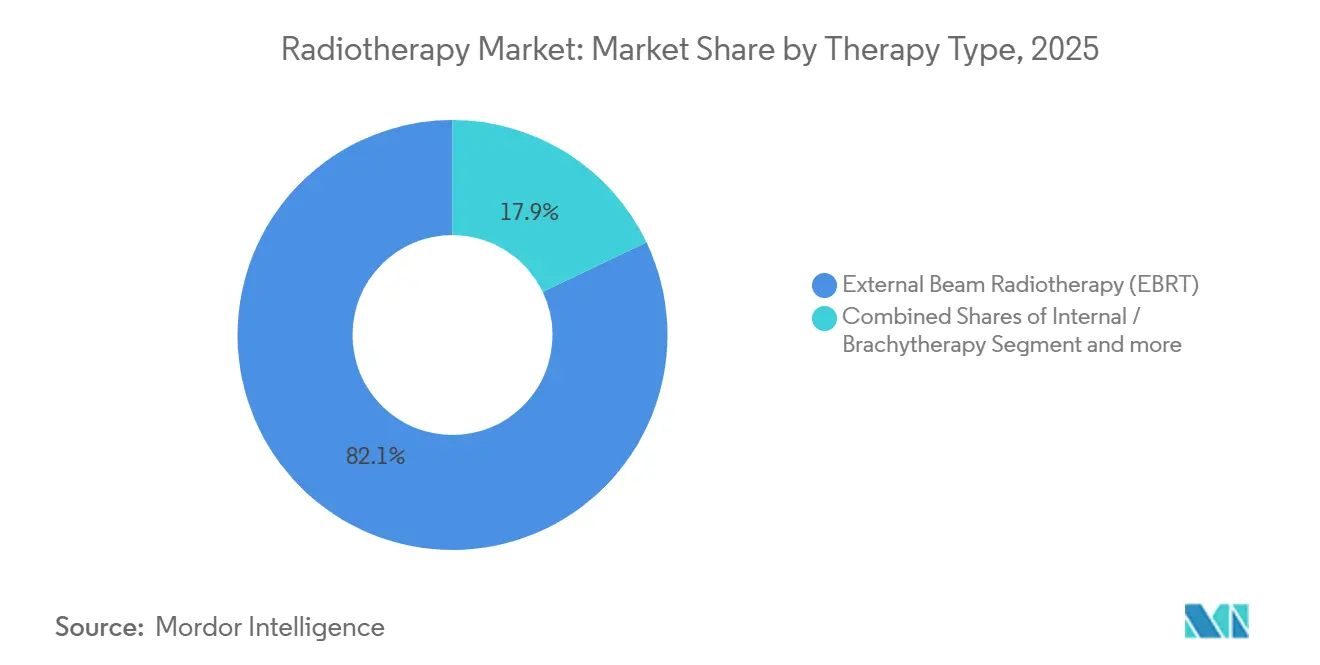
- By therapy type, external beam radiotherapy led with 82.11% revenue share in 2025; systemic radiotherapy is forecast to expand at a 7.86% CAGR through 2031.
- By technology, intensity-modulated radiotherapy (IMRT) accounted for 31.73% of the radiotherapy market share in 2025, while proton beam therapy is expected to advance at an 8.38% CAGR through 2031.
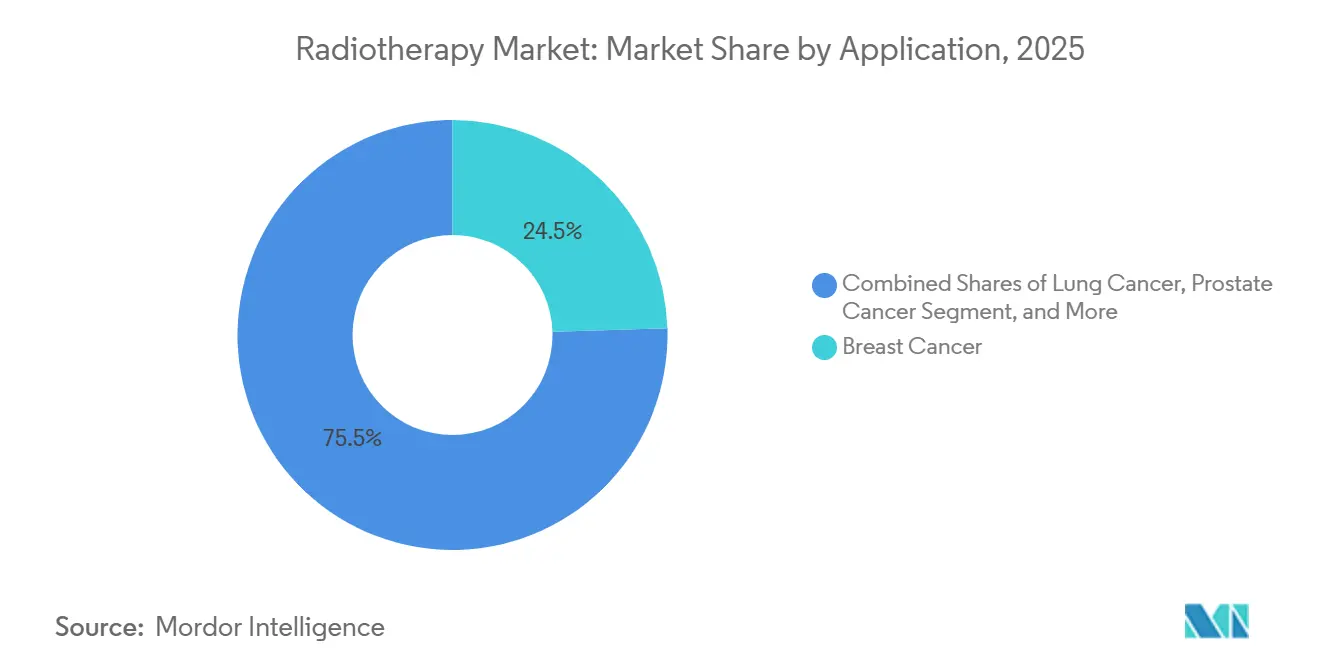
- By application, breast cancer accounted for 24.48% of the radiotherapy market size in 2025, and lung cancer indications are growing at a 6.87% CAGR to 2031.
- By end user, hospitals and clinics held 61.26% revenue share in 2025; ambulatory surgery centers show the fastest trajectory at a 10.15% CAGR through 2031.
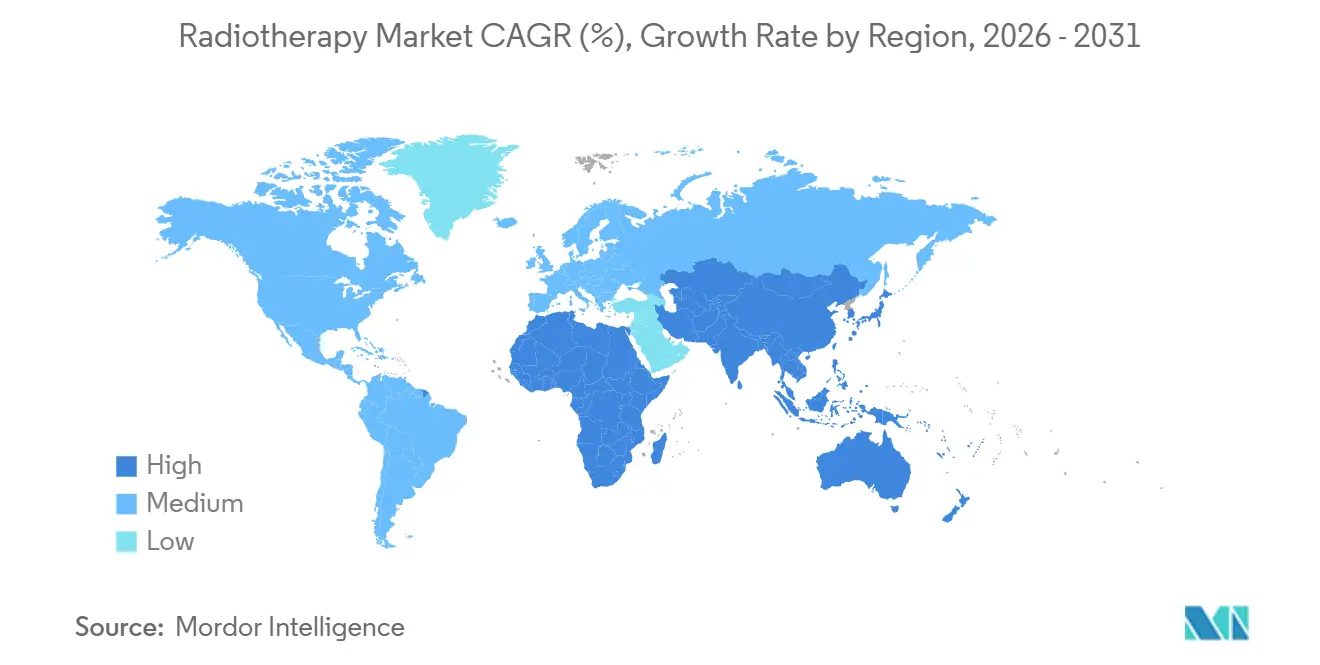
- By geography, North America captured 41.52% of the revenue in 2025, whereas the Asia-Pacific region is set to grow at a 9.01% CAGR through 2031.
Note: Market size and forecast figures in this report are generated using Mordor Intelligence’s proprietary estimation framework, updated with the latest available data and insights as of January 2026.
Global Radiotherapy Market Trends and Insights
Drivers Impact Analysis*
| Driver | (~) % Impact on CAGR Forecast | Geographic Relevance | Impact Timeline |
|---|---|---|---|
| Precision-Medicine Push for Sub-Millimeter Dose Delivery | +1.2 | Global, early uptake in North America and Western Europe | Medium term (2-4 years) |
| Reimbursement Expansion for Outpatient RT Procedures | +1.5 | North America, selected European markets | Short term (≤ 2 years) |
| AI-Driven Adaptive Planning Slashing Workflow Time | +1.3 | Global, concentrated in high-volume academic centers | Short term (≤ 2 years) |
| FLASH & Ultra-High-Dose-Rate Proof-of-Concept Successes | +0.8 | North America and Europe | Long term (≥ 4 years) |
| Middle-Income National Cancer Plans Funding RT Build-Outs | +1.4 | Asia-Pacific core, spill-over to MEA and South America | Medium term (2-4 years) |
| Radiopharmaceutical Approvals for Metastatic Disease Control | +1.0 | Global, faster uptake in North America and Europe | Medium term (2-4 years) |
| Source: Mordor Intelligence | |||
Precision-Medicine Push for Sub-Millimeter Dose Delivery
Image-guided platforms that integrate cone-beam CT and real-time tumor tracking now support daily adaptive replanning, reducing healthy-tissue margins by half and allowing safe dose escalation.[1]U.S. Food and Drug Administration, “510(k) Database,” fda.gov Early clinical data from MR-linac installations have reported 92% local control rates in oligometastatic liver lesions, representing a double-digit improvement over historical CT-guided protocols. International standards are also stricter: IEC 60601-2-64 requires an isocenter accuracy of less than 2 mm for stereotactic systems, prompting upgrades across 40% of the installed base by 2027. Proton systems now ship with pencil-beam scanning at 2 mm spot sizes, helping pediatric centers spare cognitive structures during cranial treatments. Commissioning these high-precision units, however, is lengthened when physicist vacancies persist, thereby prolonging go-live timelines.
Reimbursement Expansion for Outpatient RT Procedures
In January 2025, the Centers for Medicare & Medicaid Services equalized payment for outpatient stereotactic body radiotherapy with hospital-based delivery, releasing an estimated USD 420 million in annual facility fees to freestanding centers.[2]Centers for Medicare & Medicaid Services, “Hospital Outpatient Prospective Payment System Final Rule 2025,” cms.gov Private insurers quickly matched policy; Anthem added lung SBRT coverage for ambulatory surgery centers two months later, influencing 14 million covered lives.[3]Anthem Blue Cross, “Medical Policy – Radiation Therapy,” anthem.com Germany followed by adding intensity-modulated radiotherapy for head-and-neck cancer to its outpatient catalog, shifting almost one-fifth of cases to day-clinic settings within half a year. These moves are not uniform, as the United Kingdom retained older tariffs that reimburse proton therapy at just 60% of cost, damping investment. Japan’s 12% boost in carbon-ion therapy payments likewise highlights reimbursement as a decisive lever for technology adoption.
AI-Driven Adaptive Planning Slashing Workflow Time
Deep-learning contouring and beam-angle optimization tools have compressed radiotherapy planning from hours to under one hour in many high-volume sites, enabling 30% more patient starts with the exact headcount. A multi-site study demonstrated that AI-generated contours for head-and-neck cases required no manual edits in 78% of instances, resulting in European regulatory clearance for fully automated adaptive workflows. Professional guidelines now demand Dice similarity coefficients above 0.85, narrowing the vendor field to algorithms supported by large multicenter datasets. Vendors are embedding reinforcement learning to shorten optimization iterations, cutting physicist review time by 40% for complex spine cases. These gains permit stretched workforces to meet rising demand without immediate hardware expansion.
FLASH & Ultra-High-Dose-Rate Proof-Of-Concept Successes
First-in-human FLASH trials delivered therapeutic doses in under one second and reported zero grade-3 toxicities at six-month follow-up, suggesting a wider therapeutic window. A 40-patient abdominal FLASH proton study is underway and is expected to inform potential breakthrough designations in 2026. Major vendors have attracted USD 180 million in funding to commercialize FLASH-ready accelerators, although technical barriers include redesigns of magnetrons and the implementation of real-time dosimetry. The International Atomic Energy Agency formed a standards group to tackle measurement gaps, underscoring the long-term horizon for broad deployment. While enthusiasm is high, randomized phase-III data needed for routine reimbursement are unlikely to be available before 2029.
Restraints Impact Analysis*
| Restraint | (~) % Impact on CAGR Forecast | Geographic Relevance | Impact Timeline |
|---|---|---|---|
| Linac & Proton-Room CAPEX Squeeze Amid Higher WACC | -1.8 | Global, acute in Europe and Latin America | Short term (≤ 2 years) |
| Skilled Dosimetrist/Medical-Physicist Shortages | -1.3 | North America, Western Europe, emerging Asia-Pacific | Medium term (2-4 years) |
| Insurer Scrutiny of Comparative-Effectiveness Evidence | -0.7 | North America, selected European markets | Medium term (2-4 years) |
| Radio-Supply Chain Fragility for Isotopes & Consumables | -0.5 | Global, episodic regional disruptions | Short term (≤ 2 years) |
| Source: Mordor Intelligence | |||
Linac & Proton-Room CAPEX Squeeze Amid Higher WACC
Weighted-average cost of capital rose from 5.2% in 2023 to 7.8% in 2025, stretching proton-suite payback periods to 12 years and prompting deferrals across Europe and Latin America. One leading Spanish hospital chain canceled a Madrid installation as financing costs made debt service exceed 40% of projected revenue. A U.S. survey found that 38% of community sites are delaying linac replacements, pushing the average equipment age to 11 years and increasing downtime. Vendors now offer decade-long leases that convert capital costs to operating expenses, but uptake remains modest.
Skilled Dosimetrist/Medical-Physicist Shortages
Vacancies for board-certified medical physicists reached 23% in 2025, resulting in nine-month delays for new machine commissioning and forcing existing staff to work 54-hour weeks. The United Kingdom reported 40% of departments below minimum staffing, which limited daily slots to 85% of installed capacity. India exhibits a 50% physicist gap relative to regulatory norms, necessitating cross-site sharing that compresses quality assurance cycles. Training pipelines are flat, so several countries are fast-tracking international recruitment, although relocation costs add budget pressure.
*Our forecasts treat driver/restraint impacts as directional, not additive. The impact forecasts reflect baseline growth, mix effects, and variable interactions.
Segment Analysis
By Therapy Type: External Beam Dominance Meets Systemic Surge
External beam radiotherapy led the radiotherapy market, accounting for 82.11% of the revenue share in 2025. Its broad tumor applicability and established infrastructure keep utilization high, yet treatment compression through hypofractionation moderates revenue growth. Systemic radiotherapy is projected to post a 7.86% CAGR to 2031, buoyed by the commercial success of Lutetium-177 agents such as Pluvicto, which secured expanded Medicare coverage at USD 42,500 per treatment. External-beam platforms are answering through AI-enabled adaptive workflows that reduce planning time to 52 minutes, allowing sites to accommodate higher patient volumes without adding rooms.
Systemic agents broaden access where machine capacity is saturated, especially for metastatic disease. Lutathera sales climbed 28% in 2025 as label extensions in Japan and Australia came online. Internal brachytherapy stabilizes nearly 8% of therapy revenue, as isotope logistics and SBRT competition cap further growth. Over the forecast window, external-beam volumes stay high but see share erosion as radiopharmaceuticals secure a larger metastatic niche.


By Technology: Proton Momentum Versus IMRT Ubiquity
Intensity-modulated radiotherapy captured 31.73% of the technology revenue in 2025, reflecting its status as a standard of care for prostate and head-and-neck cancers. Proton beam therapy, while smaller, is expanding at an 8.38% CAGR, assisted by Chinese provincial funding for eight new centers in 2025. Cost declines from single-room designs, now priced near USD 25 million, are drawing community hospitals into the modality.
Volumetric-modulated arc therapy reduces session times to two minutes, enabling high-throughput centers to manage rising caseloads more efficiently. Image-guided platforms hold 28% of revenue, bolstered by American College of Radiology rules that require daily imaging for stereotactic treatments. Carbon-ion therapy remains confined to a handful of Japanese and German sites due to the high capital costs of approximately USD 80 million. Overall, software-centric upgrades dominate budgets as facilities extract more productivity from legacy hardware.
By Application: Lung Gains Ground as Breast Matures
Breast cancer remained the top application, accounting for 24.48% of the revenue in 2025; however, ultra-hypofractionation reduced the number of per-patient fractions and slowed dollar growth. Lung cancer shows a 6.87% CAGR to 2031, driven by 4-fraction SBRT protocols that achieve 90% local control in surgically ineligible patients. Prostate cancer retains the second-largest share but faces payer scrutiny around proton therapy, diverting some cases back to IMRT. Head-and-neck indications benefit from daily adaptive replanning, reporting nine-point gains in two-year local control.
CNS and brain metastases rise on the back of single-fraction stereotactic radiosurgery, which compresses two-week schedules to one day and aligns with immunotherapy treatment windows. Gastrointestinal cases, notably those involving the pancreas and rectum, are increasingly migrating to MR-guided treatment for tighter margins. Across applications, oligometastatic disease management fuels extra-cranial SBRT demand as a means to delay systemic escalation.
By End User: Ambulatory Centers Capture Outpatient Shift
Hospitals and clinics delivered 61.26% of 2025 spending, leveraging integrated oncology services for complex cases. Ambulatory surgery centers are growing at a 10.15% CAGR, as reimbursement parity and five-fraction regimens make outpatient care increasingly viable. Specialty clinics, at 18% share, act as referral hubs for advanced techniques such as MR-guided or proton therapy.
Twenty-two U.S. ASCs added linacs in 2025, targeting patients with breast and prostate conditions who prefer shorter visits and free parking. Hospitals are countering this by bundling radiotherapy into six-month episode-based payments, which rewards efficiency. Certificate-of-need relaxations in eight U.S. states further lower barriers for ASC installations.
Geography Analysis
North America held 41.52% of the radiotherapy market revenue in 2025. CMS outpatient parity led to a 22% increase in equipment orders during the first half of the year, primarily at urban freestanding sites. Canada added eight linacs under rural-access grants, while Mexico’s private sector expanded volume as insurance enrollment climbed. Utilization now reaches 68% of eligible U.S. patients, approaching the plateau of mature systems.
The Asia-Pacific region is the fastest-growing, with a 9.01% CAGR. India’s USD 1.2 billion scheme to install 150 linacs aims to halve the nine-week waiting lists. Japan, South Korea, and Australia are bolstering reimbursement and workforce pipelines to support carbon-ion and proton services.
Europe accounts for 28% of revenue but faces budget constraints. Germany upgraded outpatient tariffs, shifting 18% of head-and-neck cases to day-clinic settings. The United Kingdom’s static tariff keeps proton reimbursements at 60% of cost, restraining private investment. France invested EUR 180 million to swap cobalt units for linacs, raising average dose conformality.
The Middle East and Africa together hold 6% share, dominated by Gulf Cooperation Council procurement. Saudi Arabia plans to finance eight linacs in 2025, aiming to reach four machines per million inhabitants by 2030. South America sits at a 4.5% share, with Brazil installing 12 linacs despite macroeconomic volatility.

Regulatory Landscape
Radiotherapy systems and software are regulated primarily as medical devices, while systemic radiotherapy (therapeutic radiopharmaceuticals) follows medicines pathways, creating dual-track compliance for drug-device combinations. In the United States, the FDA Office of Combination Products determines the lead center based on the principal mode of action, and in June 2025 the FDA published draft guidance to clarify Unique Device Identifier (UDI) requirements for device constituent parts used within combination products, tightening labeling and traceability expectations for manufacturers supplying oncology care pathways.
In Europe, the EU Medical Device Regulation (MDR) raises evidence and conformity-assessment demands for device components used with medicinal products, including Article 117 requirements for notified-body assessment against General Safety and Performance Requirements (GSPRs). The EMA issued an October 2024 concept paper to strengthen clinical evaluation expectations for therapeutic radiopharmaceuticals in oncology, and the European Commission issued COM(2025) 1023 in December 2025 proposing targeted MDR/IVDR updates aimed at streamlining assessments and addressing implementation bottlenecks that have affected approval timing for high-complexity radiotherapy ecosystems.
Value Chain Analysis
The radiotherapy value chain spans (1) core equipment and subassembly suppliers (linear accelerators, magnetrons, multi-leaf collimators, imaging subsystems, and treatment-planning/adaptive software), (2) OEM manufacturing, system integration, and quality testing, (3) distribution and installation, (4) site commissioning (physics acceptance testing, beam modeling, and workflow validation), and (5) lifecycle services such as software upgrades, preventive maintenance, and parts replacement. For systemic radiotherapy workflows that interface with radiotherapy departments, upstream dependencies extend to radioisotope production (reactor or accelerator-based), radiolabeling and final dose formulation, then time-critical distribution driven by short half-lives.
Operational risk concentrates at two choke points, specialist labor (medical physicists and dosimetrists) that governs commissioning speed and ongoing QA capacity, and constrained radioisotope availability for therapeutic pathways that cannot be stockpiled. The OECD Nuclear Energy Agency has highlighted structural reliance on limited reactor infrastructure and sensitive inputs such as HALEU, while the EMA Executive Steering Group on Shortages and Safety of Medicinal Products (MSSG) issued strategic recommendations in April 2025 to mitigate radiopharmaceutical supply vulnerabilities. These constraints have pushed providers and suppliers toward tighter coordination across planning software, imaging, and delivery platforms, along with deeper partnerships linking isotope producers, radiolabeling CDMOs, and treatment sites to reduce end-to-end cycle time.
Competitive Landscape
Varian (Siemens Healthineers), Elekta, and Accuray collectively controlled significant market share in 2025, resulting in moderate concentration within the segment. Competition now revolves around software: Varian’s Ethos cut prostate plan time to 52 minutes and secured 78% of service contract renewals. Proton suppliers are bifurcated; IBA and Hitachi target multi-room academic builds, while Mevion’s single-room units lower entry costs by 40%.
Radiopharmaceutical developers, such as Novartis, are reshaping the economics of therapy types, as Pluvicto alone generated USD 520 million in U.S. sales during the first three quarters of 2025. Smaller entrants, such as ViewRay, secured 18 MRIdian orders in 2025, leveraging real-time imaging to carve out niches in oligometastatic treatments. Patent filings climbed in 2025, led by motion-management and dose-optimization claims, signaling a software arms race. Draft FDA guidance on algorithm transparency may raise the compliance bar for start-ups.
Radiotherapy Industry Leaders
GE Healthcare
Accuray Incorporated
Siemens Healthineers AG
Isoray Inc.
Elekta AB
- *Disclaimer: Major Players sorted in no particular order

Market Opportunities and Future Outlook
Workflow automation remains a clear whitespace where software can unlock additional throughput from existing hardware fleets, particularly in settings constrained by physicist availability and deferred linac replacement cycles. Multinational evidence presented around ESTRO 2026 showed an AI-based tool generating high-quality radiotherapy plans for cervical cancer in more than 95% of cases and prostate cancer in 85% of cases, with planning time reduced to around one hour. This evidence supports adoption in high-volume centers and in regions scaling access under national cancer plans.
Clinical development is also broadening the scope of radiotherapy beyond local control into more integrated, biology-informed care pathways, which increases demand for adaptive delivery, image guidance, and data integration. In 2026, peer-reviewed results in lung cancer and breast cancer highlighted strategies combining stereotactic body radiation with immunotherapy to modulate tumor biology and outcomes, reinforcing investment interest in platforms that can deliver precise hypofractionated regimens with consistent contouring, motion management, and rapid replanning. Proton therapy access initiatives in the United States (including programs discussed by the National Association for Proton Therapy in 2026) and ongoing provider system investments in adaptive radiotherapy also create tangible routes for vendors to sell upgrades, service contracts, and software add-ons that defer new-room CAPEX while expanding clinical capabilities.
Recent Industry Developments
- June 2026: GE HealthCare received FDA 510(k) clearance for MIM Contour ProtégéAI+ 2.0, an AI-enabled auto-contouring solution for radiation therapy planning that includes a Predetermined Change Control Plan. The clearance strengthens regulated pathways for iterative AI updates in planning workflows, supporting broader deployment of automation that reduces manual contouring burden and planning variability across sites.
- July 2025: Siemens Healthineers expanded a 10-year Value Partnership with Prisma Health, including a USD 50 million investment in cancer care and acquisition of the Varian Ethos adaptive radiotherapy system. The deal underscores provider demand for adaptive platforms and long-term service models that bundle technology refresh, training, and performance commitments into multi-year contracts.
- August 2024: Accuray received CE Mark for Accuray Helix, a CT-guided helical radiotherapy system designed to improve affordability and usability for emerging markets. This broadened Accuray's addressable footprint in regions focused on access expansion, where automation and streamlined operation can help counter staffing and commissioning constraints.


Research Methodology Framework and Report Scope
Market Definition and Coverage
For this report, the radiotherapy market includes revenue generated from equipment, software, and related services used to plan, deliver, and verify therapeutic radiation for cancer care across hospitals and dedicated treatment centers worldwide.
Scope exclusions: Diagnostic imaging equipment, general oncology drugs, and radiopharmaceutical consumables are not counted in this market sizing.
Segmentation Overview
- By Therapy Type
- External Beam Radiotherapy (EBRT)
- Internal / Brachytherapy
- Systemic Radiotherapy
- By Technology
- Image-Guided Radiotherapy
- Intensity-Modulated Radiotherapy
- Stereotactic Radiosurgery
- Proton Beam Therapy
- 3D-Conformal Radiotherapy
- Volumetric Modulated Arc Therapy
- Other Technology
- By Application
- Breast Cancer
- Prostate Cancer
- Lung Cancer
- Head & Neck Cancer
- Central Nervous System / Brain
- Gastro-intestinal
- Other Applications
- By End User
- Hospitals & Clinics
- Speciality Clinics
- Ambulatory Surgery Centers
- Other End Users
- By Geography
- North America
- United States
- Canada
- Mexico
- Europe
- Germany
- United Kingdom
- France
- Italy
- Spain
- Rest of Europe
- Asia-Pacific
- China
- Japan
- India
- Australia
- South Korea
- Rest of Asia-Pacific
- Middle East & Africa
- GCC
- South Africa
- Rest of Middle East & Africa
- South America
- Brazil
- Argentina
- Rest of South America
- North America
Data Sources, Market Sizing, and Validation
Desk Research
Desk research was used to build the starting fact base around cancer burden, radiotherapy access, and system installation momentum, which then guided the assumptions we tested in the model. We typically refer to public health statistics and epidemiology releases such as the World Health Organization and the International Agency for Research on Cancer, and we also use sources such as the International Atomic Energy Agency for radiotherapy resource and access indicators.
To translate demand signals into market value, we review evidence such as peer reviewed clinical and health economics publications on fractionation patterns, technology use, and site level throughput, followed by procurement and policy signals from health ministries and reimbursement documents in key countries. Company filings, investor presentations, reputed press, and association websites help validate product mix shifts and service intensity trends. In parallel, paid subscriptions are used in a limited way for company financials and intelligence, patent databases, and occasionally global contracts and tenders to cross-check deal activity. These desk sources are illustrative, and we relied on additional public references for data collection, validation, and clarification throughout the work.
Primary Interviews and Surveys
Primary work was done through expert interviews and structured surveys with a mix of equipment suppliers, oncology clinicians, hospital administrators, and service providers, so that assumptions did not stay purely literature driven. Coverage was balanced across APAC, EMEA, and the Americas to capture differences in installed base age, upgrade cycles, and treatment capacity constraints, and then to adjust adoption and pricing ranges where local context mattered.
Distribution of primary research fieldwork respondents
| Company type | Respondent position | Region |
|---|---|---|
| Top tier: 25% | CXOs: 15% | APAC: 42% |
| Mid tier: 56% | Functional/Unit leaders: 36% | EMEA: 35% |
| Smaller Players: 19% | Managers: 49% | Americas: 23% |
Market-Sizing & Forecasting
The market was first reconstructed using a top-down pathway where cancer incidence, treatment eligibility, radiotherapy utilization, and average fractions per course are translated into annual procedure volumes, which are then linked to equipment intensity and service needs. Once the demand pool was formed, value was derived using market typical pricing bands for capital systems, planning and verification software, and recurring service contracts, with adjustments for technology mix.
To keep the totals realistic, we corroborated outputs with selective bottom-up approximations such as sampled ASP times shipment volumes for key system types, channel checks on annual installations, and supplier-side views on service attach rates. Inputs that mattered most in practice included installed base replacement cycles, adoption of advanced techniques that lift software and service revenue, regional treatment capacity additions, reimbursement stability in major markets, and currency timing for international deals. Forecasts were built using scenario analysis supported by expert consensus on capacity build-out and upgrade pace, and gaps in the bottom-up checks were handled by using conservative ranges, then rebalancing to the demand-led ceiling.
Data Validation & Update Cycle
Outputs are validated through multiple checks, starting with internal consistency tests across patient pool, fractions, and implied machine throughput, and then moving to variance checks versus observed installation and upgrade signals. Where large swings appear, assumptions are revisited, and follow-up calls are triggered with the most relevant respondent types before numbers are finalized.
Before sign-off, the model and narratives go through a multi-step analyst review so definitions, inclusions, and arithmetic align across sections. The report is refreshed annually, and interim updates are made when material events occur, such as major policy changes or step shifts in technology adoption. Right before delivery, a fresh pass is completed so clients receive the latest updated view.
Mordor Intelligence's Global Radiotherapy Market Market Estimate Compared With Other Published Estimates
Published market sizes for radiotherapy rarely match exactly, even when the topic label looks the same, because the boundary of what is counted changes from one study to another. Differences also come from the year used as the base, the way recurring service revenue is treated, and how exchange rates and inflation are applied in multi-country totals.
By tracking installed base replacement timing, service attach rates, and currency conversion windows, Mordor Intelligence keeps the radiotherapy total tied to equipment, software, and related services only, while some sources widen scope into adjacent therapy inputs or apply a different base-year anchor that shifts the starting value.
Benchmark comparison
| Source | Market Size | Gaps in Research Methodology |
|---|---|---|
| Mordor Intelligence | USD 9.14 B (2026) | |
| Industry Research Publisher A | USD 8.07 B (2025) | Uses an earlier base year and a lower starting demand pool in regions where radiotherapy access is still expanding, which can understate near-term upgrade and installation driven revenue. |
| Healthcare Insights Platform B | USD 7.86 B (2025) | Often groups radiation therapy more broadly and may rely on generalized growth rates with limited checks on installed base renewal and service contract intensity, which shifts the value versus an equipment-plus-service accounting. |
The spread is mainly explained by base-year choice and what gets counted around the core radiotherapy stack, especially recurring services and how quickly new capacity is assumed to come online. When the sizing steps stay anchored to clear demand indicators, and the value build is cross-checked with installation and pricing signals, the final number becomes easier to reproduce and to use for planning.


Key Questions Answered in the Report
What is the forecast revenue size for radiotherapy in 2031?
The value is projected to reach USD 12.87 billion by 2031, growing at a 7.08% CAGR.
How fast is proton beam therapy expected to grow compared with other technologies?
Proton beam therapy shows an 8.38% CAGR to 2031, outpacing the overall radiotherapy growth rate.
Why are ambulatory surgery centers gaining share in radiotherapy delivery?
Reimbursement parity for five-fraction stereotactic body treatments and patient preference for convenient locations are driving a 10.15% CAGR for ASC spending.
Which geographic region is anticipated to record the quickest radiotherapy growth through 2031?
Asia-Pacific, propelled by multi-billion-dollar national cancer plans that add linear accelerators and proton centers.
What main factor is shortening radiotherapy planning times in 2026?
AI-enabled adaptive software now automates contouring and optimization, cutting planning cycles to under one hour in many clinics.
Page last updated on:


