
Professional Audio Market Size and Share
Market Overview
| Study Period | 2020 - 2031 |
|---|---|
| Market Size (2026) | USD 13.26 Billion |
| Market Size (2031) | USD 17.82 Billion |
| Growth Rate (2026 - 2031) | 6.10% CAGR |
| Fastest Growing Market | Asia-Pacific |
| Largest Market | North America |
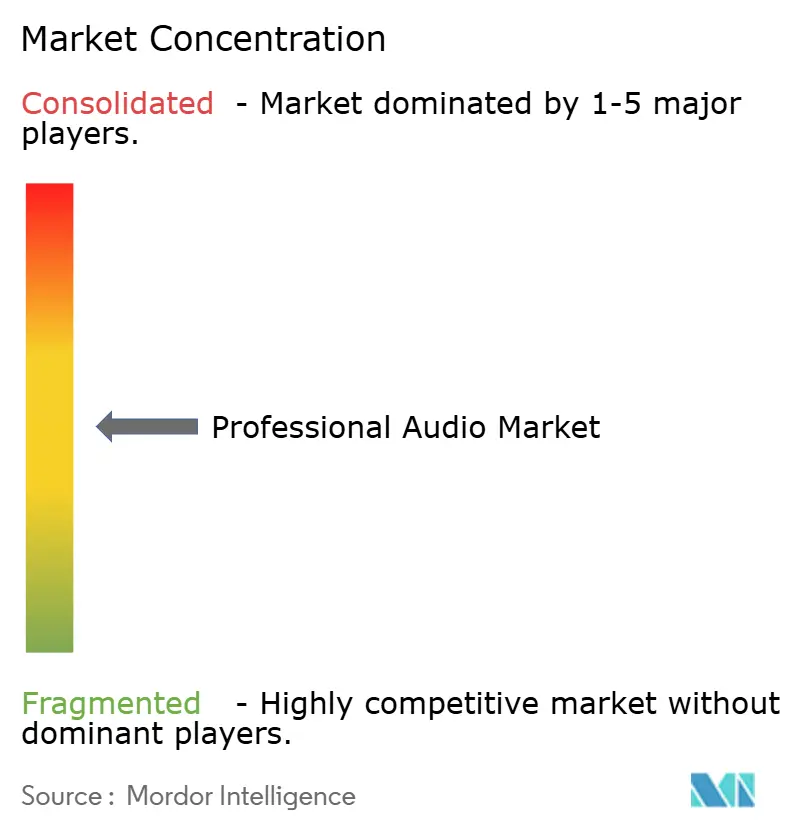
| Market Concentration | Medium |
Major Players *Disclaimer: Major Players sorted in no particular order Image © Mordor Intelligence. Reuse requires attribution under CC BY 4.0. | |
Professional Audio Market Analysis by Mordor Intelligence
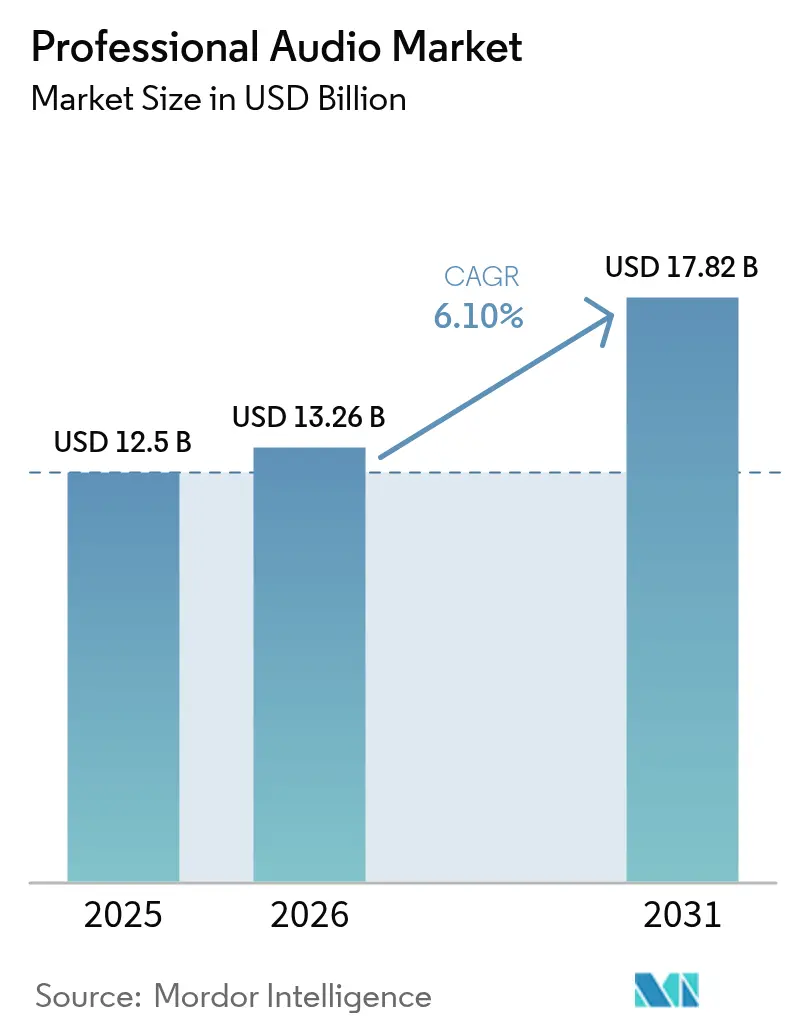
The professional audio market size was valued at USD 12.50 billion in 2025 and estimated to grow from USD 13.26 billion in 2026 to reach USD 17.82 billion by 2031, at a CAGR of 6.1% during the forecast period (2026-2031). Demand shifts from equipment ownership to experience-driven solutions, live-event resurgence, and enterprise hybrid-work upgrades form the core growth pillars. Networked protocols such as AES67 and Dante reduce interoperability barriers, encouraging facilities to refresh legacy infrastructure.[1]Source: QSC, “AES-67 and the Future of Interoperability,” qscaudio.com
Supply chain redesigns that minimize semiconductor exposure and a pivot toward software-defined features strengthen recurring revenue streams. Meanwhile, convergence of building systems with audio, evidenced by Acuity Brands’ acquisition of QSC, signals new competitive dynamics where lighting, HVAC, and sound platforms interconnect.
Key Report Takeaways
- By product category, loudspeakers led with 38.02% revenue share in 2025, while wireless microphones posted the highest growth at an 7.45% CAGR through 2031.
- By connectivity, wired systems accounted for 56.85% share in 2025, whereas wireless solutions are forecast to expand at a 7.22% CAGR to 2031.
- By end-user, media and entertainment captured 34.23% share in 2025; venues and events record the fastest trajectory at a 6.9% CAGR through 2031.
- By application, live Sound reinforcement captured 32.25% share in 2025; broadcast and streaming record the fastest trajectory at a 7.35% CAGR through 2031.
- By geography, North America held 33.12% of the professional audio market share in 2025, and Asia-Pacific is set to grow at a 7.22% CAGR between 2026-2031.
Note: Market size and forecast figures in this report are generated using Mordor Intelligence’s proprietary estimation framework, updated with the latest available data and insights as of 2026.
Global Professional Audio Market Trends and Insights
Drivers Impact Analysis*
| Driver | (~) % Impact on CAGR Forecast | Geographic Relevance | Impact Timeline |
|---|---|---|---|
| Rapid live-events and experiential marketing rebound | +1.8% | North America and Europe | Medium term (2–4 years) |
| Creator-economy demand for studio gear | +1.2% | Asia-Pacific and North America | Short term (≤2 years) |
| Expansion of networked-AV interoperability | +1.0% | North America and Europe | Long term (≥4 years) |
| Rise of immersive and spatial formats | +0.9% | Premium global markets | Medium term (2–4 years) |
| Hybrid-work spending on high-fidelity conferencing | +0.8% | North America and Europe | Short term (≤2 years) |
| Smart-city public-address funding | +0.5% | Asia-Pacific and Middle East and Africa | Long term (≥4 years) |
| Source: Mordor Intelligence | |||
Rapid Expansion of Live-Events and Experiential Marketing
Ticket volumes at major concerts increased 26% year over year in 2024, spurring rental firms and venues to replace aging arrays with cardioid sub-array systems that meet stricter noise ordinances while preserving punch[2]Source: Live Nation Entertainment, “2024 Form 10-K,” livenationentertainment.com. Festival operators monetize premium sound zones that tie experiential marketing to sponsorship revenue, as seen at Ultra Music Festival 2025[3]Source: BizBash, “5 Music Event Trends Making Noise in 2025,” bizbash.com. Hybrid corporate shows need low-latency bridging between onsite and virtual audiences, driving sales of scalable digital consoles. Sphere Entertainment’s 167,000-speaker install illustrates how immersive architecture elevates brand engagement[4]Source: InAVate, “Immersive Tech to Bring Out Unheard Audio From The Wizard Of Oz at Sphere,” inavateonthenet.net. The professional audio market therefore sees elevated demand for flexible loudspeaker configurations and high-density wireless channels that streamline quick show turnovers.
Surging Creator-Economy Demand for Studio-Grade Gear
China logged 747 million online audio users in 2024, generating a sector worth USD 68.86 billion, underlining how individual content creators influence professional purchasing decisions. Global podcast revenue surpassed USD 30 billion the same year, pushing microphone makers to launch USB-XLR hybrids that combine convenience with expandability. Visual brand aesthetics matter; larger broadcast-style microphones improve on-camera credibility, boosting uptake of units such as Shure’s MV7i that integrate real-time voice processing. Mid-tier manufacturers capitalize by bundling software plug-ins alongside hardware, converting first-time buyers into subscription clients. This driver enlarges the addressable professional audio market by expanding the end-user base beyond traditional studios.
Growth of Networked-AV and AES67/Dante Interoperability
AES67 allows Dante, RAVENNA, and Livewire+ devices to coexist, easing historical vendor lock-in issues. More than 3,000 certified Dante products create a network effect that accelerates adoption of unified control software, even while QoS settings must be meticulously planned to avoid packet-loss dropouts in mixed-protocol environments. Collaboration between L-Acoustics and d&b audiotechnik on Milan Manager demonstrates how fierce competitors collaborate on transport layers to satisfy integrators’ demand for open ecosystems. As facilities migrate to IP, integrators with network optimization expertise gain strategic importance. These developments guide the professional audio market toward platform-based competition rather than discrete hardware rivalry.
Shift to Immersive and Spatial-Audio Formats
In 2024, 93% of Billboard Top 100 tracks released Dolby Atmos masters, turning immersive rendering into a mainstream requirement. Automotive rollouts by Cadillac and Audi confirm cross-industry momentum as vehicles integrate 3D sound domains starting 2025. Theater producers adopt spatial canvases that blend infrasound and haptics, evidenced by King Lear’s run at The Shed in New York City. Equipment chains now need dedicated render engines, multichannel monitoring, and object-based routing; Audient’s ORIA interface typifies how vendors align new SKUs with format adoption. The professional audio market benefits as broadcasters and studios retool control rooms, driving upgrades across consoles, monitors, and metering software.
Restraints Impact Analysis*
| Restraint | (~) % Impact on CAGR Forecast | Geographic Relevance | Impact Timeline |
|---|---|---|---|
| Semiconductor supply-chain volatility | -1.5% | Global, high Asia exposure | Medium term (2–4 years) |
| High total cost of ownership for tour systems | -0.8% | Global, mid-tier venues hit hardest | Short term (≤2 years) |
| Counterfeit and grey-market components | -0.6% | Price-sensitive regions | Long term (≥4 years) |
| Rising e-waste compliance costs | -0.4% | Europe and North America | |
| Source: Mordor Intelligence | |||
Persistent Semiconductor Supply-Chain Volatility
Lead times for DSP cores and RF transceivers extend past 60 weeks, forcing design teams to qualify substitute parts or strip advanced features. U.S. semiconductor imports reached USD 139 billion in 2024 amid tariff hikes that raised landed costs. Smaller audio brands compete against large tech firms for wafer allocation, often paying premiums or shrinking production runs. Component obsolescence accelerates, leading some vendors to sunset digital SKUs in favor of analog lines requiring fewer chips. The professional audio market thus faces margin compression until fab capacity aligns with demand.
High Total Cost of Ownership for Tour-Grade Systems
A complete modern line array can exceed USD 500,000, limiting adoption to major arenas and top-tier rental companies. Raw material inflation, particularly neodymium for drivers, inflates bill-of-materials costs despite weight reductions delivered by next-generation magnets. Insurance premiums climb as replacement values rise, while skilled-technician shortages increase labor cost for rigging and tuning. Venues with constrained budgets phase projects, extending equipment life cycles and slowing the professional audio market upgrade pace. Mid-range manufacturers respond with modular products that allow incremental expansion rather than full system overhauls.
*Our forecasts treat driver/restraint impacts as directional, not additive. The impact forecasts reflect baseline growth, mix effects, and variable interactions.
Segment Analysis
By Product: Loudspeakers Anchor Revenue Streams
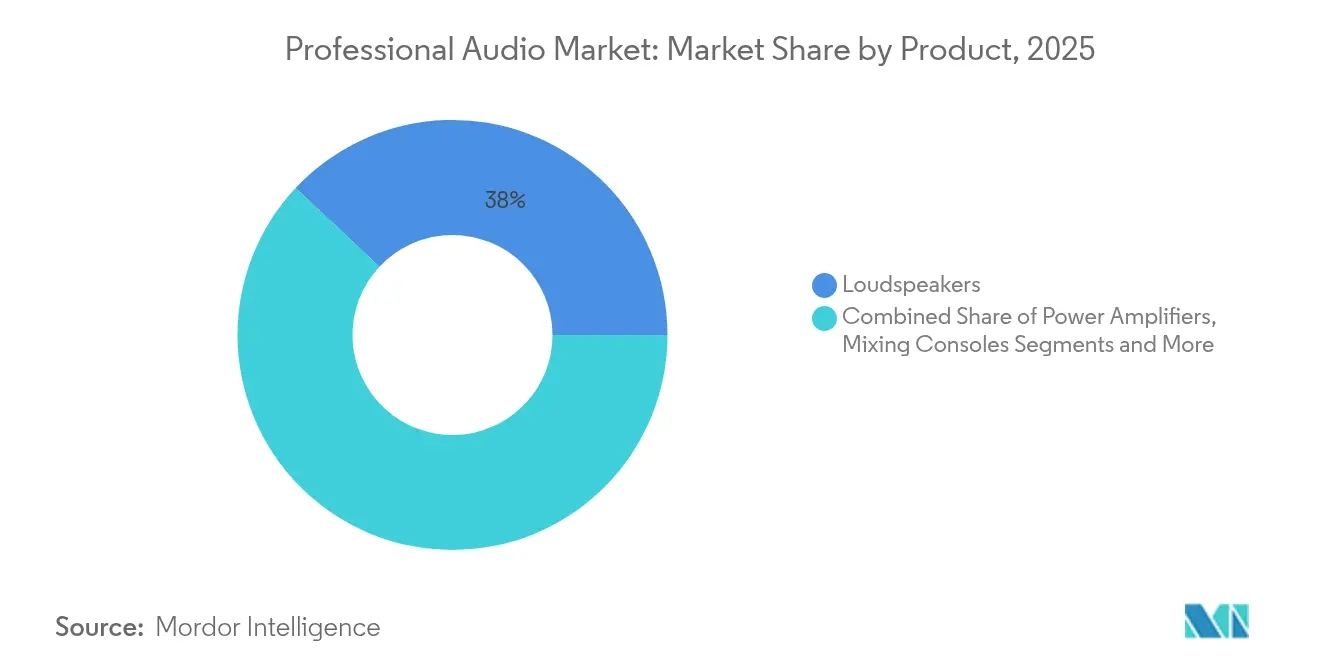
Loudspeakers contributed 38.02% of the professional audio market size in 2025, confirming their centrality across touring, fixed install, and hybrid venues. Replacement cycles accelerated after pandemic-era downtime, with many arenas adopting cardioid sub-arrays that improve low-frequency directionality while complying with municipal noise codes. Meanwhile, wireless microphones advance at an 7.45% CAGR on the back of regulatory spectrum reallocations that compel users to retire analog UHF units. Manufacturers answer with encrypted digital platforms that fit within shrinking frequency bands, safeguarding performance in congested RF environments.
The loudspeaker segment drives value-added demand for amplification, rigging, and control software that elevate system performance through FIR-based beam steering. Vendors unlock software subscriptions that activate prediction modules, converting one-time hardware sales into recurring revenue. Microphone makers explore WMAS-based ecosystems, such as Sennheiser’s Spectera, which delivers 64 channels inside a single 6 MHz block and illustrates how advanced modulation counters spectrum scarcity. Accessories like Dante breakout boxes and PoE-powered stage boxes fill integration gaps, rounding out wallet share captured by vendors inside the professional audio market.



By Connectivity: Wireless Momentum Gathers Pace
Wired solutions retained 56.85% share of the professional audio market size in 2025 thanks to mission-critical applications that resist RF risk, including government chambers and broadcast studios. Cat6a cable and redundant ring topologies guarantee near-zero latency and facilitate power distribution through PoE++. Yet wireless units are forecast to post a 7.22% CAGR to 2031 as Wi-Fi 7 unlocks 6 GHz channels and improves deterministic scheduling. Early Dante-over-Wi-Fi prototypes demonstrate sub-5 ms latency, narrowing the performance gap against Ethernet.
Battery innovation extends runtime to 40 hours at moderate SPL for portable PA boxes, widening addressable outdoor use cases. Managed-frequency coordination apps powered by cloud databases simplify deployment, lowering expertise barriers for volunteer operators. Despite counterfeit RF modules adding complexity, educational initiatives by industry bodies help mitigate interference through standardized scanning protocols. Wired and wireless ecosystems coexist as integrators design fail-over architectures that blend both, ensuring the professional audio market satisfies reliability and flexibility expectations simultaneously.
By End-User: Media and Entertainment Sustains Leadership
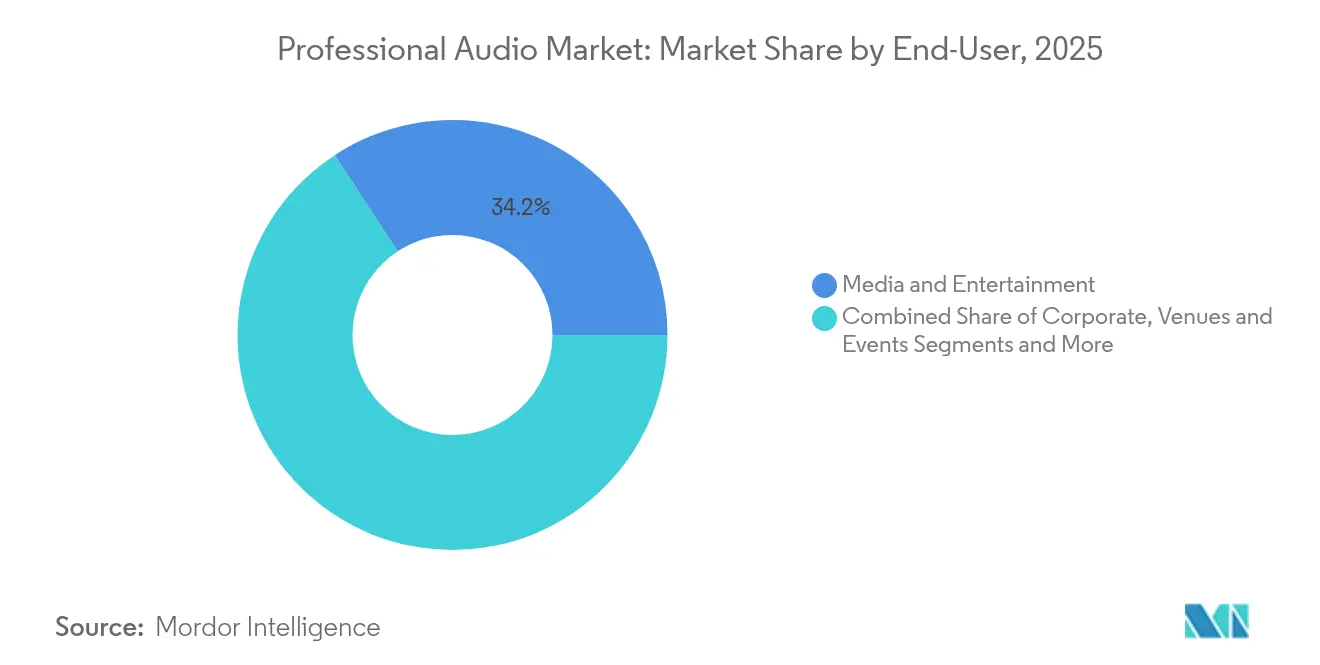
Media and entertainment delivered 34.23% revenue in 2025, buoyed by immersive mastering suites and premium broadcast trucks that adopt IP audio to handle rising channel counts. Sports rights competition accelerates upgrades as networks seek immersive fan experiences. Venues and events, growing at a 6.9% CAGR, benefit from corporate activations where audio quality now doubles as a branding tool. Hybrid ticketing models expand rental inventories of scalable line arrays that transition from stadiums to convention centers overnight.
Corporate adopters outfit meeting rooms with ceiling arrays and AI-driven echo cancellation to harmonize in-person and remote voices. Education and houses of worship pursue compliance with accessibility standards while combining traditional sermons with multimedia experiences. Retail and hospitality chains install branded soundscapes that increase dwell time, demonstrated by boutique hotels embracing object-based playback to differentiate guest experiences. Such cross-vertical deployments enlarge the professional audio market beyond its historic entertainment core.
By Application: Live Sound Reinforcement Remains Dominant
Live sound reinforcement controlled 32.25% share of the professional audio market size in 2025 as touring activity rebounded with 26% higher ticket sales. New portable line arrays balance fast deployment with pattern control, serving both festivals and corporate gigs. Broadcast and streaming applications accelerate at a 7.35% CAGR to 2031, driven by 4K and 8K video mandates that necessitate object-based audio to match ultra-high-definition visuals.
Studio renovations emphasize Dolby Atmos rooms that command premium booking rates from label and independent clients, spurring sales of multichannel monitors and bass management processors. Installed sound in public-address grows steadily due to smart-city upgrades; Princeton University Chapel illustrates how historic structures integrate digitally steerable arrays connected over Dante for discreet yet intelligible coverage. Remote monitoring dashboards that predict component failure reduce downtime and spread subscription revenues across the professional audio market.
Geography Analysis
North America accounted for 33.12% of the professional audio market in 2025, backed by the world’s densest concentration of arenas, megachurches, and broadcast facilities requiring rolling technology refreshes. FCC spectrum reallocation compels wireless replacements, while accessibility laws push venues to adopt assistive-listening transmitters. Corporate real-estate teams prioritize conference-room modernization that unifies in-room and remote voices via AES67 networks. Regional resilience is reinforced by local manufacturing clusters in California and Illinois that shorten lead times during global supply disruptions.
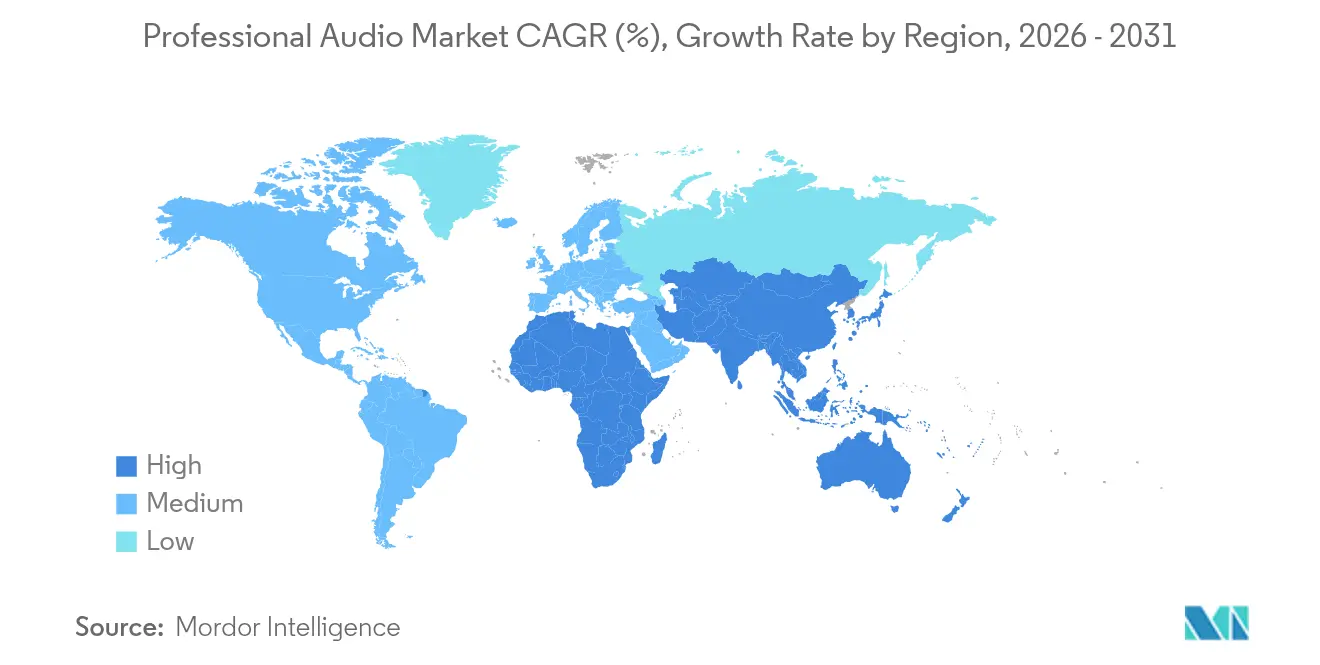
Asia-Pacific records the fastest pace, advancing at a 7.22% CAGR through 2031 as national stadium programs in China and India embed Dante-native public-address systems from blueprint stages. China’s “ear economy” shapes procurement by requiring consumer-facing venues to adopt premium audio as a competitive differentiator. Indian integrators benefit from government incentives that localize assembly, lowering tariffs on imported components. The region’s creative-class boom fuels demand for affordable studio interfaces, expanding the professional audio market base among gig-economy musicians and podcasters. Currency fluctuations remain a planning risk, yet manufacturers hedge by denominating contracts in USD where possible.
Europe demonstrates stable demand across cultural institutions and corporate campuses. Renovation of heritage theaters prioritizes recyclable loudspeaker cabinets and low-power amplifiers to align with EU sustainability targets. Brexit spurs dual-certification costs but also motivates continental distributors to hold buffer stock, maintaining supply continuity. German trade fairs like Prolight + Sound drive product visibility, while the United Kingdom broadcast sector accelerates adoption of ST 2110-compatible consoles. The professional audio market in Europe thus evolves through regulatory compliance and green design, rather than large-scale capacity increases.

Regulatory Landscape
Wireless professional audio is influenced by radio equipment and spectrum rules, especially for microphones and in-ear monitoring. In the United States, the FCC updated Part 74 rules via FCC-24-22A1 to authorize Wireless Multi-Channel Audio System (WMAS) operations with bandwidths up to 20 MHz. This update aligns with ETSI-oriented frameworks and has pushed manufacturers to refresh RF platforms and their compliance test plans.
Globally, multimedia equipment compliance continues to center on IEC 62368-1 for safety, with CISPR 32 for emissions and CISPR 35 for immunity supporting EMC requirements. These standards shape product design, labeling, and test-cost structures across touring, installed, and broadcast equipment. In the European Union, the Radio Equipment Directive (RED) remains central for wireless professional audio placed on the EU market. February 2026 brought a change when Commission Delegated Regulation (EU) 2026/339 entered into force on 16 February 2026, repealing Delegated Regulation (EU) 2022/30 and adjusting how software and radio functions are handled under RED-related requirements. Separately, common charging-interface obligations under Directive (EU) 2024/2749 applied to additional categories, including laptops in April 2026, increasing pressure to standardize USB-C interfaces and documentation across portable pro-audio peripherals and hybrid creator/pro devices sold in Europe.
Value Chain Analysis
The professional audio value chain runs from component suppliers, including DSP cores, RF transceivers, converters, and magnet materials, to OEM/ODM manufacturing, system integration, and distribution through pro-AV integrators, rental companies, and specialist dealers. End customers include live-event operators, broadcasters, enterprises, education providers, and installed-sound stakeholders. Upstream, supply volatility remains a key constraint. A November 2024 survey by the Professional Audio Manufacturers Alliance (PAMA) reported 86% of member manufacturers were moderately to majorly affected by pandemic-era disruptions and semiconductor fabrication shortages, which reinforces multi-sourcing, buffer-stock strategies, and design-for-replaceability in BOM planning.
Midstream, manufacturers are also rebalancing footprints and supplier relationships toward greater factory visibility and more regionalized production to reduce logistics and geopolitical risk exposure. Sustainability-linked inputs are increasingly material for loudspeaker and amplifier makers; in July 2025, L-Acoustics announced a strategic investment in MagREEsource and an exclusive partnership targeting European-based rare earth magnet recycling. This connects raw-material security and compliance-driven procurement to product design and lifecycle messaging. Downstream, interoperability-driven deployments built around AES67, Dante, and broader IP workflows raise the role of integrators and software platforms, shifting margin capture toward configuration, monitoring, and subscription features alongside hardware installation.
Competitive Landscape
The professional audio market shows moderate fragmentation with mounting consolidation. Acuity Brands’ USD 1.215 billion take-over of QSC integrates audio control into building management portfolios, illustrating how buyers value converged platforms. Legacy leaders such as Shure, Sennheiser, and Harman leverage deep patent libraries to protect RF and DSP technologies, while emerging entrants introduce cloud-native management that decouples hardware cycles from software upgrades.
Interoperability remains a technical battleground. Vendors race to certify AES67 endpoints and publish REST APIs that facilitate third-party control, satisfying integrators who demand vendor neutrality. AI enhancement now differentiates microphones by offering automatic gain optimization and context-aware noise suppression. Apple’s patent on ambience-compressed encoding underscores broader tech-sector interest in immersive sound.
Supply chain resilience is turning into a competitive metric. Companies diversify semiconductor sourcing and establish regional assembly plants to mitigate geopolitical risk. Those able to guarantee sub-12-week deliveries win contracts even at modest price premiums. As software subscriptions widen, recurring revenue smooths cash flow volatility, rewarding firms that pivot from one-time sales to lifetime engagement models within the professional audio market.
Professional Audio Industry Leaders
Harman International Industries Inc.
Yamaha Corporation
Shure Incorporated
Sennheiser electronic GmbH & Co. KG
Bose Corporation
- *Disclaimer: Major Players sorted in no particular order

Market Opportunities and Future Outlook
Open, certifiable AV-over-IP standards create whitespace for multi-vendor audio systems that can integrate more tightly with video, control, and IT operations. In January 2026, AIMS marked a milestone by launching IPMX as a fully developed, certifiable standard. In February 2026, it held the first IPMX Product Testing and Certification Event in Geneva, widening the addressable ecosystem for broadcast, corporate, and venue deployments that need deterministic, low-latency IP transport. Standardization of this kind maps to professional audio requirements for networked routing, centralized monitoring, and easier expansion across campuses and multi-room venues.
At the same time, consolidation across hardware and software portfolios is reshaping routes to market and creating bundling opportunities for end-to-end workflows. In May 2026, inMusic completed the acquisition of Native Instruments, including iZotope, Plugin Alliance, and Brainworx. In July 2026, iZotope moved again via a completed acquisition by Boris FX, pointing to continued focus on tightly integrated toolchains for music production, post-production, and content creation. On the hardware side, Barco announced a definitive agreement in June 2026 to acquire VerVent Audio Holding (Focal and Naim) for an enterprise value of about EUR 135 million. That deal supports a direction in which AV solution providers combine display, processing, and premium audio brands to compete for integrated installation and enterprise procurement cycles.
Recent Industry Developments
- June 2026: Barco announced a definitive agreement to acquire VerVent Audio Holding, the owner of Focal and Naim, for an enterprise value of about EUR 135 million. The deal strengthens Barco’s position as an integrated AV provider by adding recognized professional and premium audio brands to its portfolio. It also raises competitive pressure on incumbent pro-AV ecosystem vendors to broaden bundled offerings for enterprise and venue installations.
- May 2026: Samsung Electronics said its subsidiary HARMAN would acquire Masimo’s consumer audio business for USD 350 million. The transaction expands HARMAN’s audio brand portfolio and distribution reach, with potential spillover into professional audio through shared engineering, sourcing, and channel leverage. It underscores continued consolidation around scaled platforms that can fund RF, DSP, and software roadmaps.
- January 2024: Shure launched the Axient Digital ADX3 plug-on transmitter with ShowLink technology at NAMM 2024. The product extended Shure’s digital wireless ecosystem for professional production workflows by bringing networked control and reliability features to plug-on use cases. It supported higher-density deployments in live and broadcast environments where spectrum constraints and RF coordination complexity keep rising.


Research Methodology Framework and Report Scope
Market Definition and Coverage
For this study, the professional audio market covers revenue earned from equipment and systems used to capture, process, mix, distribute, and reproduce sound in professional settings, including live events, broadcast, studios, and installed venues, across all major regions.
Scope exclusions: We exclude consumer-grade audio devices meant mainly for personal listening, along with DIY hobby kits and informal resale activity that does not reflect organized professional channels.
Segmentation Overview
- By Product
- Loudspeakers
- Power Amplifiers
- Mixing Consoles
- Microphones
- Headphones
- Accessories and Others
- By Connectivity
- Wired
- Wireless
- By End-User
- Corporate
- Venues and Events
- Retail and Hospitality
- Media and Entertainment
- Education and Houses-of-Worship
- By Application
- Live Sound Reinforcement
- Recording Studios
- Broadcast and Streaming
- Installed Sound / Public-Address
- By Geography
- North America
- United States
- Canada
- Mexico
- South America
- Brazil
- Chile
- Argentina
- Rest of South America
- Europe
- Germany
- United Kingdom
- France
- Italy
- Spain
- Rest of Europe
- Asia-Pacific
- China
- Japan
- India
- Singapore
- Australia
- Malaysia
- Rest of Asia-Pacific
- Middle East and Africa
- Middle East
- Saudi Arabia
- United Arab Emirates
- Turkey
- Rest of Middle East
- Africa
- South Africa
- Nigeria
- Egypt
- Rest of Africa
- Middle East
- North America
Data Sources, Market Sizing, and Validation
Desk Research
Desk research was used to anchor the model on repeatable demand signals and industry context before assumptions were built. We relied on public, non-paywalled references such as ITU indicators for telecom and connectivity adoption, UNESCO cultural and creative economy outputs, U.S. Census and Eurostat series for business activity tied to entertainment and media services, and customs trade statistics that help validate equipment flow trends. In parallel, we checked standards bodies and technical groups around audio networking (such as AES) to understand how fast interoperability advances, since that affects upgrade cycles.
On the commercial side, we reviewed company annual reports, earnings notes, and product announcements to map pricing direction, channel mix, and major replacement themes for mixers, microphones, speakers, and amplifiers. Where available, we also used paid subscriptions for company financials and intelligence, patent databases, and shipment-level import and export records to sanity-check revenue ranges and supplier footprints without overfitting the model. These sources are illustrative and not exhaustive, and many other references were used to collect data points, validate assumptions, and clarify open questions during analysis.
Primary Interviews and Surveys
Primary work was used to pressure-test desk assumptions and fill in gaps that public data cannot show clearly, such as typical discounting, mix shifts between installed and portable use, and the pace of upgrades to networked audio. We spoke with a balanced set of respondents across manufacturers, distributors, integrators, rental firms, venue operators, broadcasters, and studio professionals across APAC, EMEA, and the Americas, so the demand pool and ASP logic stayed realistic across regions.
Distribution of primary research fieldwork respondents
| Company type | Respondent position | Region |
|---|---|---|
| Top tier: 36% | CXOs: 16% | APAC: 45% |
| Mid tier: 44% | Functional/Unit leaders: 41% | EMEA: 32% |
| Smaller Players: 20% | Managers: 43% | Americas: 23% |
Market-Sizing & Forecasting
Sizing started from a top-down build where our team reconstructed the addressable professional demand pool by region using indicators linked to purchasing intensity, then converted this into spend using market-typical pricing and replacement behavior. Inputs that influenced the model included live event activity and venue reopen trends, installed base renewal cycles in corporate and education sites, broadcast and studio capex patterns, the adoption of networked audio standards (which affects interoperability and upgrade timing), typical channel margins, and regional import and export movement for key equipment classes.
Once the regional totals were formed, they were corroborated with selective bottom-up approximations, including sampled price x unit ranges by product group, channel checks with integrators and distributors, and revenue reality checks from disclosed company financials where product exposure was clear. If a bottom-up view looked incomplete for a niche, such as rental fleets or project-driven installs where revenue timing can be lumpy, the gap was handled by applying conservative penetration and utilization rates that were validated in interviews.
For forecasting, we used scenario analysis supported by short time series smoothing for stable categories, then adjusted the trajectory based on expert consensus on upgrade cycles, event calendar normalization, and ASP direction under inflation and feature upgrades. Assumptions were kept explicit so the model can be rerun with updated inputs as conditions change.
Data Validation & Update Cycle
Validation was done in layers so single-source bias was reduced before numbers were finalized. We compared model outputs against independent signals like trade movement, disclosed revenue direction, and known shifts in demand from live events, broadcast, and installed projects, then investigated variances that did not match those signals. Outliers were reviewed in analyst checks, and follow-up questions were triggered when interview feedback and desk indicators moved in opposite directions.
The report is refreshed annually, and interim updates are made when material events occur, such as large regulation changes, major channel disruptions, or step changes in component availability and pricing. Before delivery, an analyst completes a final pass to capture recent developments and ensure the latest market view is reflected in the numbers and commentary.
Mordor Intelligence's Global Professional Audio Market Size Compared With Other Published Estimates
Published market sizes for professional audio often vary because each publisher draws the market boundary differently and then applies its own price, currency, and timing assumptions. The spread is usually driven by what is counted as professional-grade versus prosumer, whether software and services are included, and how live-event recovery is timed in the forecast window.
The benchmark table shows a visible gap versus other public figures. In Mordor Intelligence's model, the total is limited to professional audio equipment demand tied to professional end users and applications, where connectivity and application splits are treated as attributes rather than expanding the scope into adjacent consumer categories. Differences also come from how ASPs are projected, since some estimates apply a broad inflation uplift while our approach relies more on product-mix change and upgrade-cycle timing validated in interviews, followed by consistent USD conversion for the stated year.
Benchmark comparison
| Source | Market Size | Gaps in Research Methodology |
|---|---|---|
| Mordor Intelligence | USD 13.26 B (2026) | |
| Industry Publisher A | USD 11.70 B (2024) | Uses an earlier base year and tends to blend professional and adjacent end-user spend, which can understate the later-cycle rebound in live events and installed upgrades when compared year-to-year. |
| Research Portal B | USD 19.10 B (2023) | Appears to define the market more broadly, likely folding in prosumer and wider audio categories and applying generalized growth rates, which inflates the starting value versus a tighter professional-only demand pool. |
Overall, the table differences mostly trace back to scope breadth, base-year choice, and how pricing and recovery timing are handled. By keeping assumptions tied to clear demand indicators and then cross-checking totals with interviews and external signals, the sizing stays easier to reproduce and more stable for planning decisions.


Key Questions Answered in the Report
How large is the professional audio market in 2026?
It stands at USD 13.26 billion and is forecast to grow to USD 17.82 billion by 2031, reflecting a 6.1% CAGR.
Which product category leads revenue?
Loudspeakers generated 38.02% of 2025 revenue, driven by venue refurbishments and touring upgrades.
What segment is expanding fastest?
Wireless microphones show an 7.45% CAGR through 2031 due to spectrum reallocations and creator-economy demand.
How is hybrid work influencing demand?
Enterprises retrofit meeting rooms with networked beam-forming arrays, boosting sales of high-fidelity conferencing gear.
Page last updated on:




