
Wireless Audio Device Market Size and Share
Market Overview
| Study Period | 2020 - 2031 |
|---|---|
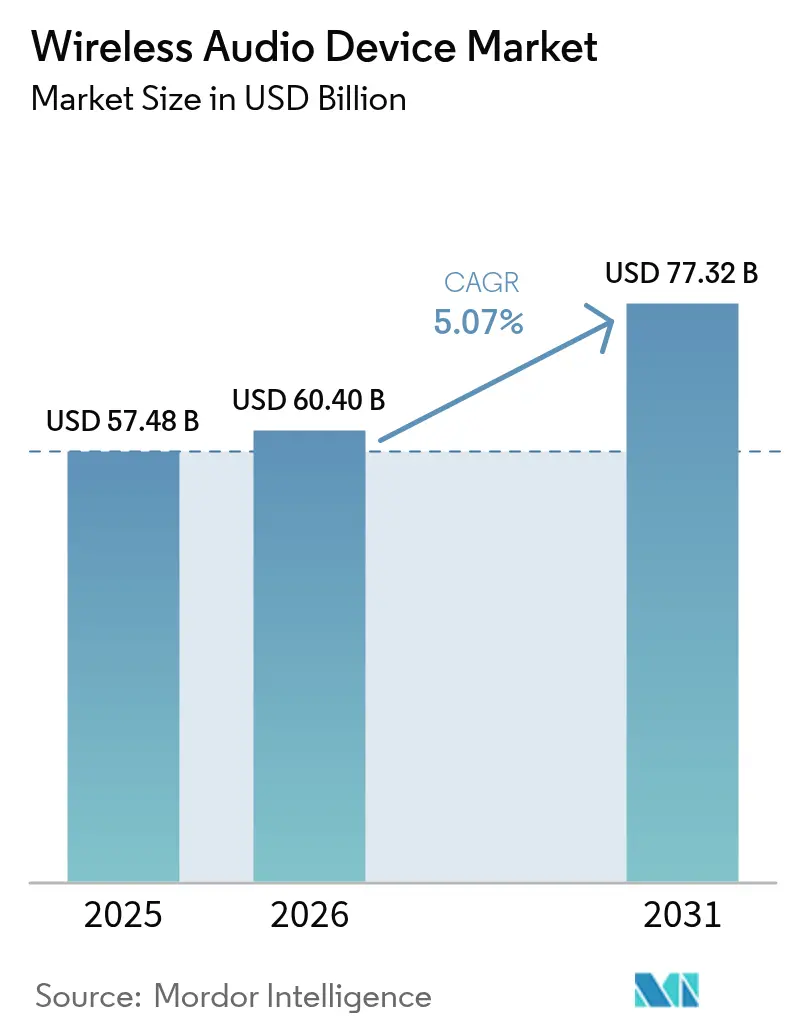
| Market Size (2026) | USD 60.4 Billion |
| Market Size (2031) | USD 77.32 Billion |
| Growth Rate (2026 - 2031) | 5.07 % |
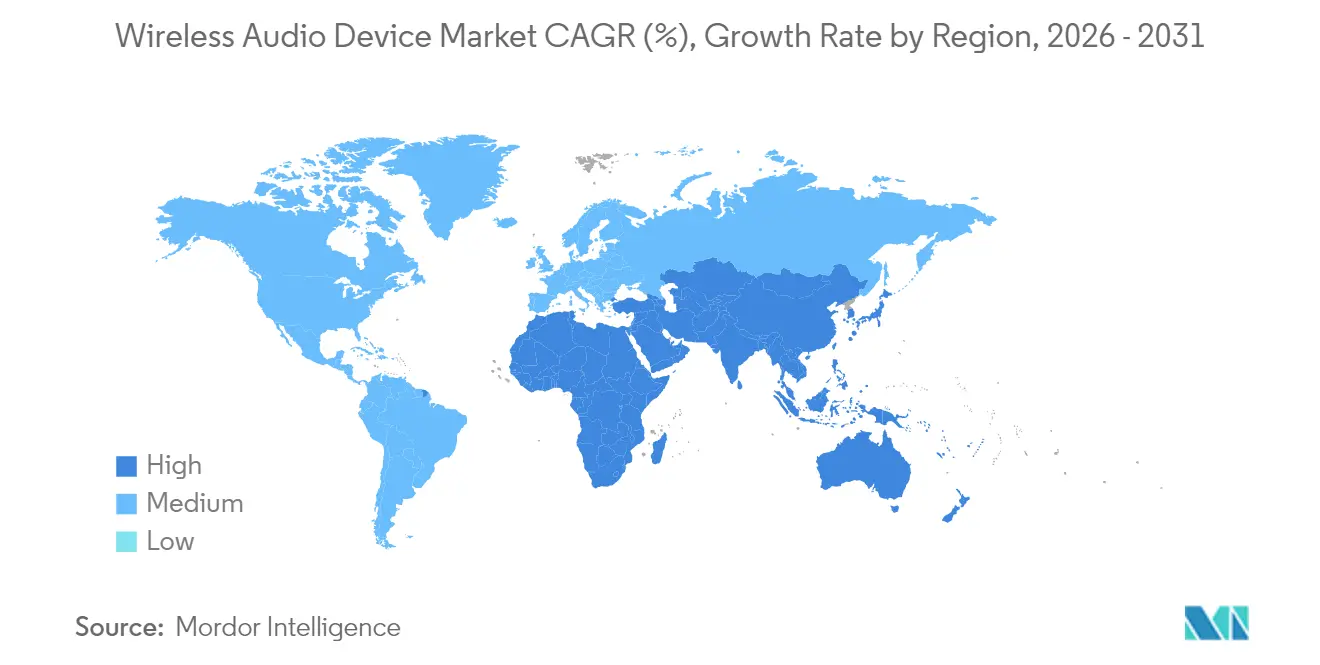
| Fastest Growing Market | Middle East |
| Largest Market | Asia |
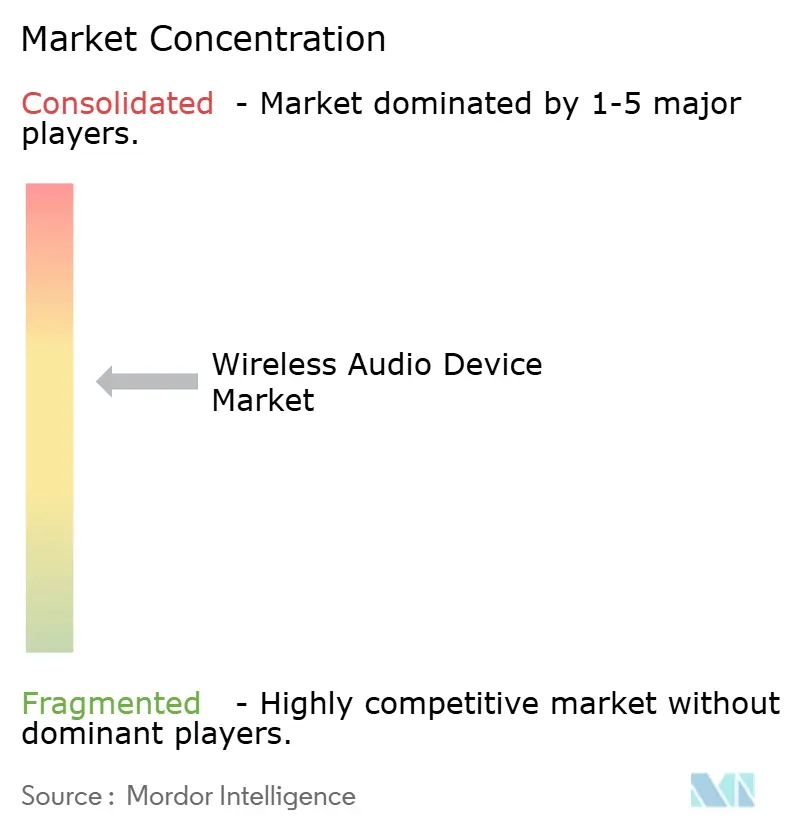
| Market Concentration | Medium |
Major Players *Disclaimer: Major Players sorted in no particular order Image © Mordor Intelligence. Reuse requires attribution under CC BY 4.0. | |
Wireless Audio Device Market Analysis by Mordor Intelligence
The wireless audio device market size in 2026 is estimated at USD 60.4 billion, growing from 2025 value of USD 57.48 billion with 2031 projections showing USD 77.32 billion, growing at 5.07% CAGR over 2026-2031. Rapid gains stem from rising demand for true wireless stereo (TWS) earbuds, premium in-vehicle infotainment upgrades, and sustained smart-speaker adoption. Vendors are reallocating R&D budgets toward artificial-intelligence (AI) features, energy-efficient connectivity, and seamless cross-device ecosystems to defend margins as basic wireless functionality becomes commoditized. Bluetooth Classic remains dominant, yet the expanding installed base of Bluetooth LE Audio‐enabled smartphones is accelerating migration to multi-stream, low-power architectures. Vertically integrated brands that control silicon, software, and services are consolidating share, often through targeted acquisitions that deepen platform capabilities and widen product portfolios.
Key Report Takeaways
- By product, True Wireless Stereo ear-buds led with 47.42% revenue share in 2025, while wearable-audio devices are projected to expand at a 6.82% CAGR to 2031.
- By technology, Bluetooth Classic accounted for 85.62% of the wireless audio device market share in 2025; Bluetooth LE Audio is forecast to grow 9.24% annually through 2031.
- By application, consumer devices held 74.02% of the wireless audio device market size in 2025, whereas automotive audio is advancing at an 7.92% CAGR over the same horizon.
- By price range, mid-range models captured 56.36% share of the wireless audio device market in 2025; the premium tier above USD 250 shows the fastest growth at 5.97% CAGR.
- By distribution channel, online sales contributed 71.55% of 2025 revenue and are growing 5.11% a year.
- Asia contributed 42.58% of global sales in 2025; the Middle East is the fastest-growing region at a 6.46% CAGR through 2031.
- HARMAN, Bose, and Syntiant collectively represented 21% of global revenue in 2024, illustrating a moderately concentrated supplier landscape.
Note: Market size and forecast figures in this report are generated using Mordor Intelligence’s proprietary estimation framework, updated with the latest available data and insights as of 2026.
Market Trends and Insights
Drivers Impact Analysis of Wireless Audio Device Market*
| Driver | (~) % Impact on CAGR Forecast | Geographic Relevance | Impact Timeline |
|---|---|---|---|
| TWS ear-bud bundling by Chinese and Indian smartphone OEMs | +0.80% | Asia, spill-over to Southeast Asia | Medium term (2-4 years) |
| Smart-speaker proliferation in North-American voice-assistant homes | +0.60% | North America, Western Europe | Short term (≤ 2 years) |
| Bluetooth LE Audio adoption by European automotive OEMs | +0.90% | Europe, North America | Long term (≥ 4 years) |
| BYOD-led demand for wireless conferencing headsets | +0.70% | North America, Western Europe | Medium term (2-4 years) |
| 5G and Wi-Fi 6E roll-outs enabling lossless streaming | +0.50% | South Korea, Nordics | Long term (≥ 4 years) |
| Sustainability trade-in programs shortening replacement cycles | +0.40% | Japan, Germany | Medium term (2-4 years) |
| Source: Mordor Intelligence | |||
Proliferation of TWS Ear-buds Through Smartphone Bundling
Chinese and Indian handset brands increasingly ship entry-level TWS units inside the box, catalyzing mass adoption beyond early urban adopters. The practice sacrifices near-term margins but enlarges the future upgrade pool for higher-priced models, embedding brand loyalty from a user’s first audio experience. Local chipset suppliers now deliver entry-level voice-recognition silicon that meets sub-USD 50 bill-of-materials targets, reinforcing the volume flywheel.
Smart-Speaker Surge in Voice-Assistant Households
North-American homes now average 3.2 connected audio devices, transforming single speaker purchases into multi-room ecosystems anchored by cloud-based assistants. The expanding device footprint fuels ancillary revenue from music subscriptions and home-automation services, raising consumer switching costs. Brands with robust back-end AI platforms command clear advantage over hardware-only rivals, reinforcing ecosystem stickiness.
Automotive OEM Adoption of Bluetooth LE Audio
Luxury-vehicle buyers increasingly cite in-cabin entertainment quality as a deciding factor. Bluetooth LE Audio’s multi-stream broadcast and hearing-aid compatibility enable per-seat personalisation while satisfying Europe’s evolving accessibility mandates. Recognition of HARMAN as General Motors’ 2024 global supplier of the year underscores how advanced audio has become a strategic lever in premium models. [1]HARMAN International, “HARMAN Recognized as 2024 Supplier of the Year by General Motors,” harman.com
BYOD-led demand for wireless conferencing headsets
Hybrid-work policies shift procurement from IT departments to employees who demand gear that bridges office calls and personal media. Corporate stipends cover premium noise-cancelling headsets, expanding the wireless audio device market beyond the consumer segment. Design emphasis now balances business-grade microphones with lifestyle aesthetics, benefiting vendors that tailor firmware for conferencing platforms.
Restraints Impact Analysis of Wireless Audio Device Market*
| Restraint | (~) % Impact on CAGR Forecast | Geographic Relevance | Impact Timeline |
|---|---|---|---|
| 2.4 GHz congestion causing multi-room latency | -0.40% | Dense Asian megacities | Short term (≤ 2 years) |
| EU WEEE/RoHS III battery-disposal compliance costs | -0.30% | Europe, global exporters | Medium term (2-4 years) |
| 6 GHz band exhaustion curbing Wi-Fi audio scalability | -0.20% | Urban North America & EU | Medium term (2-4 years) |
| High import duties and low-cost competition in Latin America | -0.10% | Brazil, Mexico | Short term (≤ 2 years) |
| Source: Mordor Intelligence | |||
2.4 GHz Congestion Undermining Multi-Room Audio
Apartments in Shanghai, Seoul, and Mumbai host a dozen connected devices competing on crowded 2.4 GHz channels. Packet collisions raise latency beyond the 40 ms threshold that disrupts synchronized playback, prompting vendors to embed proprietary mesh networking or mandate 5 GHz set-ups—both of which add bill-of-materials cost and reduce plug-and-play simplicity. [2]Wi-Fi Alliance, “Lack of Wi-Fi Spectrum Bandwidth Undermines China’s Investments in Fiber,” wi-fi.org
EU WEEE/RoHS III Compliance Burden
Regulation 2023/1542 obliges manufacturers to collect, recycle, and document every embedded battery, raising certification and logistics expenses, especially for medium-volume brands. Firms with vertically integrated supply chains amortise these costs more effectively, accelerating market consolidation as smaller players exit or pivot to ODM models. [3]European Parliament & Council, “Regulation 2023/1542,” eur-lex.europa.eu
*Our forecasts treat driver/restraint impacts as directional, not additive. The impact forecasts reflect baseline growth, mix effects, and variable interactions.
Wireless Audio Device Market Segment Analysis
By Technology:
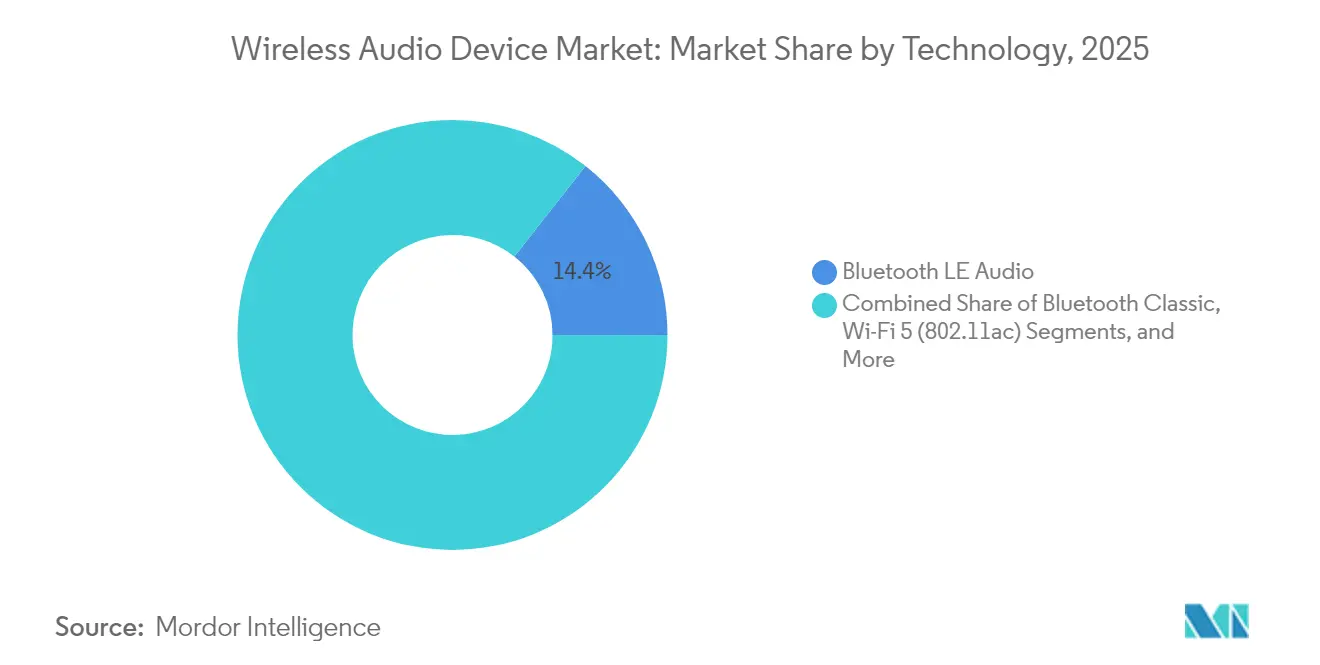
Bluetooth LE Audio Gains MomentumBluetooth Classic retained an 85.62% wireless audio device market share in 2025, supported by near-universal backward compatibility. Nonetheless, Bluetooth LE Audio is expanding at a 9.24% CAGR as Android and iOS platforms unlock Auracast broadcast and multi-stream capabilities. The wireless audio device market size tied to LE Audio-enabled products is projected to surpass USD 14.03 billion by 2031. Early adopters include hearing-aid firms and premium sound-bar brands seeking low-latency multi-listener streaming.
Premium Wi-Fi 6/6E speakers target audiophiles who value lossless playback; however, escalating 6 GHz congestion in metro areas tempers mainstream appeal. Ultra-wideband remains niche for automotive positional soundscapes. As interoperability matures, chipset vendors are bundling dual-mode Classic and LE Audio support, smoothing transition risk for OEMs.



By Product:
TWS Leadership Faces Wearable DisruptionTWS units accounted for 47.42% of 2025 revenue, buoyed by bundling and rapid design cycles that deliver yearly battery-life gains. Yet the wearable-audio category-smart glasses, hearables, and audio rings-posts the fastest 6.82% CAGR as users seek contextual cues, health metrics, and augmented-reality overlays. In value terms, the wireless audio device market size for wearables could exceed USD 9.68 billion by 2031.
Over-ear headphones stabilise as a premium refuge aided by adaptive ANC and personalised DSP. Smart speakers evolve into household hubs that orchestrate lighting, security, and HVAC, lifting average selling prices. Portable speakers hold steady within outdoor leisure niches, while soundbars profit from streaming-driven home-cinema upgrades.
By Application:
Automotive Accelerates Past ConsumerConsumer uses still generated 74.02% of 2025 revenue, covering music, gaming, and fitness. The automotive slice, however, advances 7.92% annually as OEMs embed multi-seat immersive sound, voice assistants, and over-the-air (OTA) up-sell features. Segment leaders highlight the wireless audio device market share premium tied to branded speaker packages, translating to higher vehicle ASPs. Commercial demand remains buoyant in conferencing and education as hybrid work normalises. Hospitality chains retrofit ballrooms with low-latency wireless arrays to enable reconfigurable layouts, while defence agencies specify encrypted links and extended-range headsets, sustaining high gross margins for niche suppliers.
By Price Range:
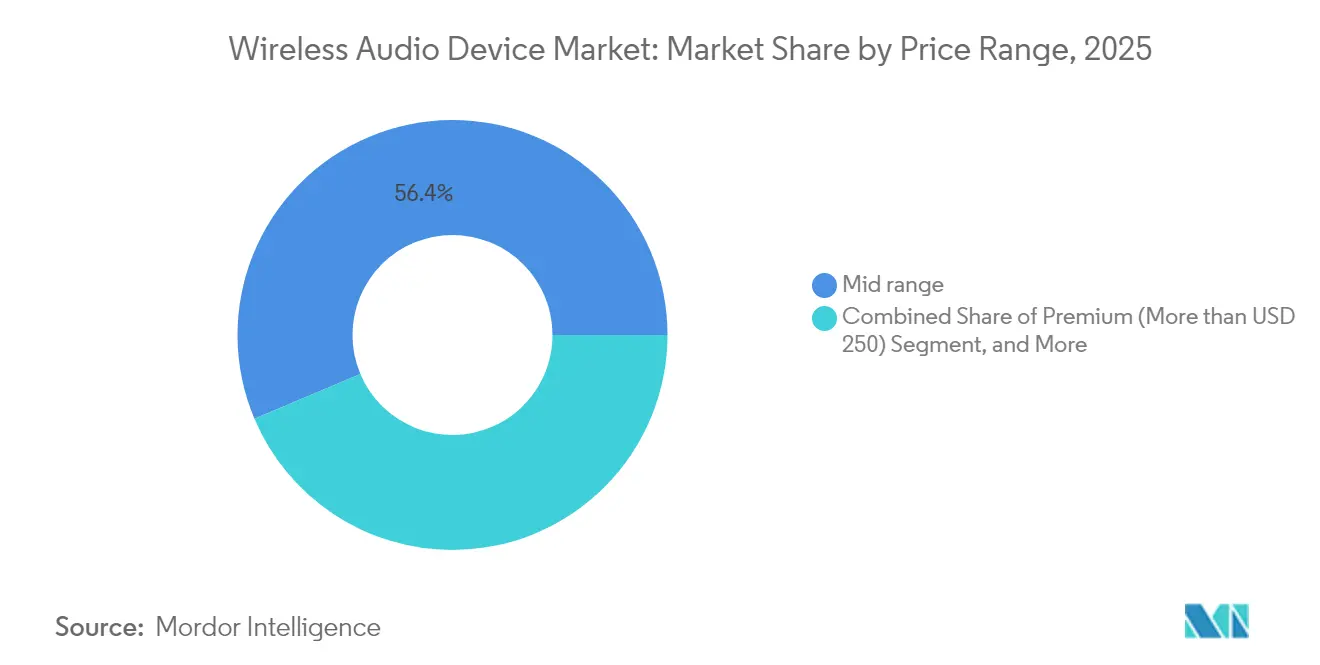
Premium Tier Drives Value MigrationMid-range SKUs between USD 100-249 held 56.36% in 2025, but premium models above USD 250 lead growth at 5.97% CAGR. Superior ANC, spatial-audio codecs, and AI-assisted tuning justify higher tickets. The budget segment remains vital for unit volume, yet margin squeeze forces vendors to automate assembly and scale component procurement. Premium gains underline a broader shift from hardware to experience-centric differentiation.
By Distribution Channel:
Online Gains Critical MassE-commerce delivered 71.55% of 2025 sales and compounds at 5.11% as comparison shopping, influencer reviews, and same-day fulfilment convince even premium buyers. Brand-owned web stores now bundle insurance, firmware updates, and subscription services to deepen direct relationships. Physical retail counters this trend through expert fitting sessions for high-end headphones and live demos that highlight audio quality-experiences difficult to replicate online.
Geography Analysis
APAC Wireless Audio Device Market
Asia accounted for 42.58% of 2025 revenue. China leverages vast scale in both manufacturing and consumption, while India’s ongoing smartphone wave broadens rural penetration. Japan’s circular-economy trade-ins shorten refresh cycles, and South Korea’s 5G backbone unlocks Wi-Fi 6E lossless streaming pilots.
North America Wireless Audio Device Market
North America’s installed base of smart speakers underpins multi-room audio adoption. Enterprise BYOD policies augment headset demand, with stipends converting cost centers into recurring premium sales. Canada mirrors US trajectories, whereas Mexico supplies volume growth at mid-range price points.
Europe, Middle East and LATAM Wireless Audio Device Market
Europe positions audio quality as a luxury differentiator, especially in automotive. Early integration of Bluetooth LE Audio aligns with accessibility directives and pushes export opportunities. The Middle East grows fastest as disposable income and entertainment venues rise. Latin American expansion is uneven; Brazil and Mexico capture most Pro-AV spend but face tariff and grey-market headwinds that squeeze high-end importers.

Regulatory Landscape
Wireless audio devices are subject to radio approvals, spectrum rules, and product compliance regimes that differ by region, while increasingly referencing overlapping technical standards. In the United States, the Federal Communications Commission (FCC) adopted rules in February 2024 permitting Wireless Multichannel Audio Systems (WMAS), which links wideband operation to ETSI-based requirements and affects how professional wireless audio and adjacent consumer designs manage bandwidth, coexistence, and certification pathways.
In Europe, Commission Implementing Decision (EU) 2025/105 updates harmonised spectrum conditions for short-range devices and addresses PMSE audio allocations, with changes taking effect from 1 July 2025 and affecting wireless microphones and event-audio use cases that overlap with the broader wireless audio ecosystem. Separately, the EU Radio Equipment Directive cybersecurity essential requirements (via Commission Delegated Regulation (EU) 2022/30 and amendments) introduce mandatory compliance for specified connected radio equipment categories from August 2025, which requires vendors of app-connected headphones, speakers, and hubs to build security-by-design, data protection, and privacy controls into firmware and software update architectures.
Value Chain Analysis
The value chain covers upstream connectivity silicon (connectivity SoCs), audio DSP/MCUs, and memory, along with electro-acoustic components such as speakers and MEMS microphones. Power subsystems include Li-ion cells and battery management ICs, while mechanicals cover enclosures, hinges, and wearables frames. The downstream layer is software stacks, including codecs, tuning, companion apps, and cloud assistant functionality.
Midstream integration is dominated by ODM/OEM manufacturing and final assembly, with production concentration notably in China and Vietnam, while premium brands differentiate downstream through proprietary DSP tuning, ANC algorithms, multi-device ecosystem features, and direct-to-consumer online sales that already account for 71.55% of 2025 revenue. Supply risk is becoming more cross-industry, as audio OEMs compete for the same passive components and memory used for AI-server buildouts, with 2025-2026 signals pointing to extended lead times for items such as RAM and key passives that affect launch schedules, inventory planning, and multi-sourcing strategies. Standards and interoperability also span the chain: Bluetooth LE Audio and Auracast-capable designs require updated chipsets, qualification, and software validation, while compliance obligations such as EU battery and radio requirements add documentation, testing, and reverse-logistics steps that tend to favor larger, vertically integrated vendors that can amortize certification and recycling overhead.
Competitive Landscape
The wireless audio device market is moderately consolidated. HARMAN’s USD 350 million purchase of Sound United and Bose’s acquisition of McIntosh Group illustrate a pivot toward vertically integrated ecosystems that blend hardware, software, and brand heritage. Component-level plays also heat up: Syntiant secured Knowles’ MEMS microphone unit to embed edge-AI capabilities and tighten ownership of the signal chain.
Differentiation leans on AI firmware that personalises sound profiles and predicts user intent rather than on transducer counts alone. Chinese low-power chipset vendors threaten incumbents with sub-USD 1 AI coprocessors, allowing white-label brands to imitate premium features at aggressive prices. Incumbents respond via subscription-based spatial-audio updates that expand revenue beyond the initial sale. Expect further M&A as mid-tier firms seek scale to absorb rising compliance and R&D outlays.
Wireless Audio Device Industry Leaders
Apple Inc.
Bose Corporation
DEI Holdings Inc.
Samsung Electronics Co. Ltd (Harman International, incl. JBL, AKG)
Sennheiser Electronic GmbH and Co. KG
- *Disclaimer: Major Players sorted in no particular order
Wireless Audio Device Market Companies Covered in this Report
- Apple Inc.
- Samsung Electronics Co. Ltd (Harman International, incl. JBL, AKG)
- Sony Group Corporation
- Bose Corporation
- Sennheiser Electronic GmbH and Co. KG
- Shure Incorporated
- Vizio Inc.
- Koninklijke Philips N.V.
- LG Electronics Inc.
- GN Audio A/S (Jabra)
- HP Inc. (Poly)
- Skullcandy Inc.
- Xiaomi Corporation
- Amazon .com Inc. (Echo Devices)
- Bang and Olufsen A/S
- Anker Innovations Ltd (Soundcore)
- Logitech International S.A.
- Pioneer Corporation
- Sonos Inc.
- Edifier International Ltd
- Sound United LLC (Denon, Marantz, Polk Audio, Bowers and Wilkins, Definitive Technology)
- Yamaha Corporation
- DEI Holdings Inc.

Market Opportunities and Future Outlook
A whitespace is emerging around broadcast- and accessibility-ready wireless audio experiences enabled by Bluetooth LE Audio and Auracast, which supports one-to-many audio distribution. These capabilities are recognized as an Assistive Listening System (ALS) option under the Americans with Disabilities Act (ADA) in the United States, creating a hardware and infrastructure opportunity that runs from consumer earbuds and hearables to venue endpoints such as gyms, waiting rooms, sports bars, and hospitality locations, where purchasers want standardized broadcast audio without relying on proprietary receiver ecosystems.
Platform-level integration is also widening the install base for broadcast-capable sources. Android TV OS 14 adds integrated support for Auracast, providing TV OEMs such as Samsung, LG, Hisense, and TCL with a pathway to embed broadcast audio at the television level instead of relying only on external accessories. At the product level, roadmaps are pushing premium features into lower price tiers and alternative connectivity approaches, including 2026 launches such as Samsung Galaxy Buds4 series positioning higher-fidelity audio, Nothing Ear (3a) promoting LDAC support at a USD 99 price point, and Vivo TWS 5 Pro using Wi-Fi Direct for lossless transmission. Together, these examples show active experimentation with codecs, bandwidth, and ecosystem hooks that can expand differentiated mid-range and premium lineups beyond Bluetooth Classic parity.
Recent Industry Developments in Wireless Audio Device Market
- May 2026: Bose announced broader availability of its Lifestyle Collection, spanning a modular speaker, Dolby Atmos soundbar, and wireless subwoofer, with interoperability features such as Google Cast and Apple AirPlay. The announcement supports a cross-platform home audio strategy as multi-room usage grows and consumers mix ecosystems across phones, TVs, and smart-home hubs.
- May 2025: Samsung Electronics said its subsidiary HARMAN agreed to acquire Masimo Corporation's consumer audio business for USD 350 million. The deal expands HARMAN's home audio brand portfolio and adds scale in distribution and platform integration, which can influence pricing power and product roadmaps across soundbars, speakers, and headphones.
- February 2024: The FCC adopted rules permitting Wireless Multichannel Audio Systems (WMAS) in the United States. By formalizing a framework for wider-bandwidth wireless audio operations aligned with ETSI-based technical requirements, the decision supports new professional and event-audio deployments and can spill over into adjacent wireless audio device designs and certifications.


Wireless Audio Device Market Report Scope and Research Methodology
Market Definition and Coverage
For this study, the wireless audio device market covers revenue from devices that deliver audio without wired connections, including wireless headsets, earbuds, speakers, soundbars, and related wireless microphones sold across major regions.
Scope exclusions: We exclude wired-only audio devices and installation or subscription revenue that is not directly tied to the sale of a wireless audio hardware unit.
Segments Covered in This Report
- By Technology
- Bluetooth Classic
- Bluetooth LE Audio
- Wi-Fi 5 (802.11ac)
- Wi-Fi 6/6E (802.11ax)
- AirPlay
- RF/ZigBee
- Ultra-Wideband (UWB)
- By Product
- True Wireless Stereo (TWS) Earbuds
- Wireless Headphones (Over-Ear/On-Ear)
- Wireless Speakers
- Smart Speakers
- Portable Speakers
- Sound Bars
- Wireless Microphones
- Wearable Audio (Smart Glasses, Hearables)
- Others
- By Application
- Consumer
- Home Entertainment
- Gaming
- Fitness and Sports
- Commercial
- Corporate and Education
- Hospitality
- Events and Venues
- Automotive
- Passenger Vehicles
- Commercial Vehicles
- Public Safety and Defence
- Others
- Consumer
- By Price Range
- Premium (More than USD 250)
- Mid-range (USD 100-249)
- Budget (Less than USD 100)
- By Distribution Channel
- Online
- Direct Brand E-Stores
- E-commerce Marketplaces
- Offline
- Consumer-Electronics Retail
- Hypermarkets and Mass Merchandisers
- Specialty Audio Stores
- Automotive Aftermarket
- Online
- By Geography
- North America
- United States
- Canada
- Mexico
- Europe
- Germany
- United Kingdom
- France
- Nordics
- Rest of Europe
- South America
- Brazil
- Rest of South America
- Asia-Pacific
- China
- Japan
- India
- South-East Asia
- Rest of Asia-Pacific
- Middle East and Africa
- Middle East
- Gulf Cooperation Council Countries
- Turkey
- Rest of Middle East
- Africa
- South Africa
- Rest of Africa
- Middle East
- North America
Data Sources, Market Sizing, and Validation
Desk Research
Desk research was used to set the fact base for demand and supply signals, and then to shape realistic assumptions that can be tested in interviews. We referenced public sources such as International Telecommunication Union indicators, World Bank macro data, OECD consumer and trade statistics, UN Comtrade trade flows, and US FCC or EU CE guidance for wireless and radio-enabled devices.
To keep the model grounded, we also reviewed company annual reports, investor presentations, and press releases for product launches, pricing direction, and shipment commentary, followed by trade association pages and reputable electronics press for mix shifts between earbuds, headphones, and speakers. In a few cases, paid subscriptions were used only for company financials and intelligence and for patent databases, mainly to confirm timeline and product feature adoption. These desk sources are illustrative, and many other public references were also checked for data collection, validation, and clarification.
Primary Interviews and Surveys
Primary work focused on interviews and surveys with device brands, component and platform ecosystem participants, distributors and retailers, and large buyers in consumer and commercial channels. Input was gathered across APAC, EMEA, and the Americas so that mix, pricing, and adoption differences by region could be reflected, and so gaps left by public data could be closed before finalizing assumptions.
Distribution of primary research fieldwork respondents
| Company type | Respondent position | Region |
|---|---|---|
| Top tier: 39% | CXOs: 13% | APAC: 41% |
| Mid tier: 42% | Functional/Unit leaders: 36% | EMEA: 37% |
| Smaller Players: 19% | Managers: 51% | Americas: 22% |
Market-Sizing & Forecasting
Sizing is built using a top-down approach where consumer electronics demand pools and device adoption signals are reconstructed by region, and then mapped to wireless audio device categories and their typical price bands. The totals are then cross-checked with selective bottom-up approximations, such as sampled average selling price (ASP) by product type multiplied by estimated shipment volumes from channel feedback, which is then used to tune outliers.
Key inputs used in the model include Bluetooth and wireless feature penetration in personal audio, the split between earbuds and over-ear devices, replacement cycles, promotional intensity in major retail seasons, and ASP movement by price range as active noise cancellation and multipoint connectivity become more common. For speakers and soundbars, household adoption patterns and smart home attachment were used as supporting signals, and for commercial use cases, demand was linked to workplace communication and event-related spending. Forecasting mainly uses scenario analysis, where base, conservative, and high cases are set from expert expectations on unit growth and ASP direction, followed by a smoothing step so year-to-year shifts stay consistent with observed demand behavior.
When bottom-up checks were incomplete (for example, limited visibility on smaller regional brands), gaps were handled using share-based allocations from better-covered markets, and then adjusted using distributor feedback on relative market presence and pricing.
Data Validation & Update Cycle
Model outputs are validated through triangulation across desk indicators and primary feedback, and then checked for variance against independent signals like trade movements, launch cadence, and pricing trends visible in public channels. When a mismatch shows up, the underlying assumptions are revisited, and targeted re-contacts are triggered to confirm whether the issue is mix, pricing, or timing.
Before sign-off, the work goes through multi-step analyst reviews, where calculations, unit logic, and year alignment are rechecked, and unusual jumps are documented with a clear reason. The report is refreshed on an annual cycle, and interim updates are made when material events affect demand or pricing, followed by a final pre-delivery pass so the view is current.
Mordor Intelligence's Global Wireless Audio Device Market Market Size Compared With Other Published Estimates
Different published numbers for wireless audio devices can look far apart because the scope is not always consistent, and even small choices can shift the final total. The biggest drivers usually come from which products are counted, how ASP is trended over time, and whether the study is mixing hardware revenue with adjacent services.
The main gap comes from product scope, where Mordor Intelligence counts only wireless audio hardware revenues across defined device categories and applies pricing based on observed price-range movement rather than an aggressive premium-mix uplift.
Benchmark comparison
| Source | Market Size | Gaps in Research Methodology |
|---|---|---|
| Mordor Intelligence | USD 60.4 B (2026) | |
| Global Research Publisher A | USD 143.7 B (2025) | Uses a much broader scope and faster growth curve, which can happen when multiple wireless audio device and hearables groupings are combined and when ASP expansion is assumed from premium feature adoption. |
| Industry Research Portal B | USD 78.43 B (2025) | Sits closer to hardware-only logic but can differ due to category mapping (for example, treatment of microphones and soundbars) and different base-year pricing timing and currency conversion choices. |
Overall, the spread in published values is best explained by how each source treats the product basket and the way pricing is carried forward year to year. By keeping the steps traceable to device categories, adoption indicators, and interview-checked price movement, the estimate stays repeatable and easier to reconcile to real-world demand signals.


Key Questions Answered in the Report
What is the current size of the wireless audio device market?
The market is valued at USD 60.4 billion in 2026 and is on track to reach USD 77.32 billion by 2031.
Which region holds the largest wireless audio device market share?
Asia accounts for 42.58% of global revenue, supported by Chinese manufacturing scale and India’s expanding smartphone base.
What technology segment is growing the fastest?
Bluetooth LE Audio leads growth with a 9.24% CAGR thanks to energy savings and Auracast multi-stream broadcasting.
Why is the automotive segment important for future growth?
Automotive applications are growing 7.92% annually as carmakers embed premium multi-seat audio and OTA up-sell features.
How are sustainability regulations affecting manufacturers?
EU WEEE/RoHS III rules increase battery-recycling costs, elevating fixed overhead and encouraging further industry consolidation.
Which sales channel is expanding quickest?
Online platforms represent 71.55% of revenue and continue to grow 5.11% a year as consumers embrace direct brand stores and rapid fulfilment.
Page last updated on:


 Your data is secure and never sold or shared.


