Professional Speaker Market Size and Share
Market Overview
| Study Period | 2020 - 2031 |
|---|---|
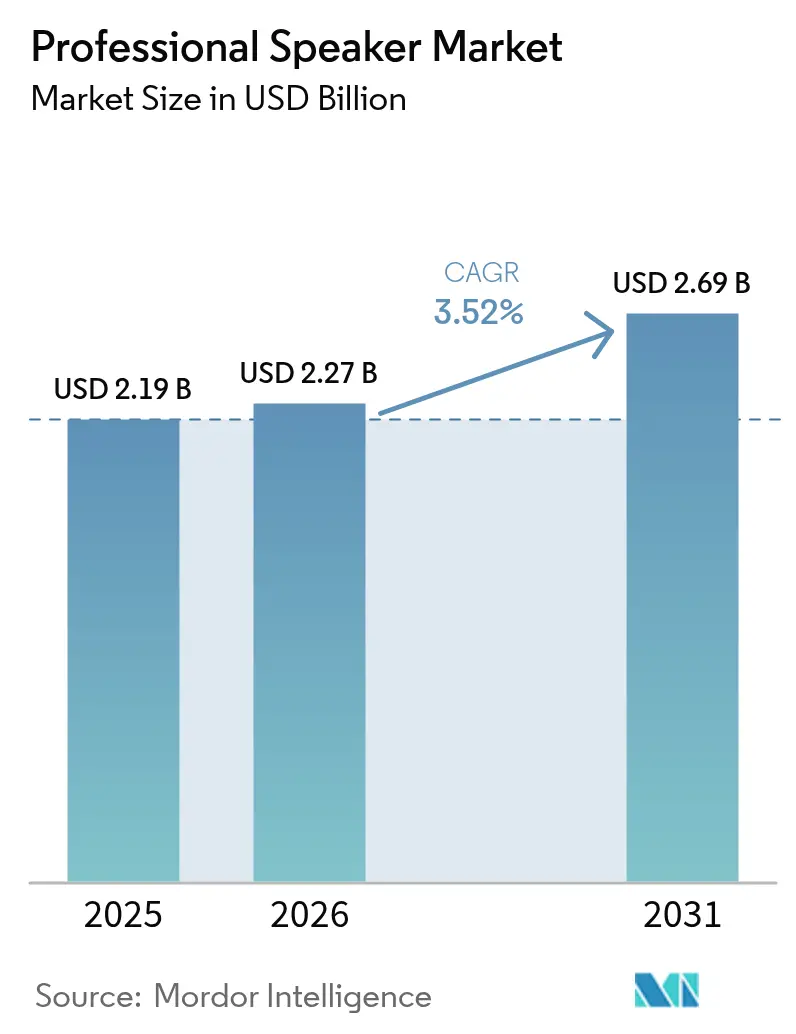
| Market Size (2026) | USD 2.27 Billion |
| Market Size (2031) | USD 2.69 Billion |
| Growth Rate (2026 - 2031) | 3.52% CAGR |
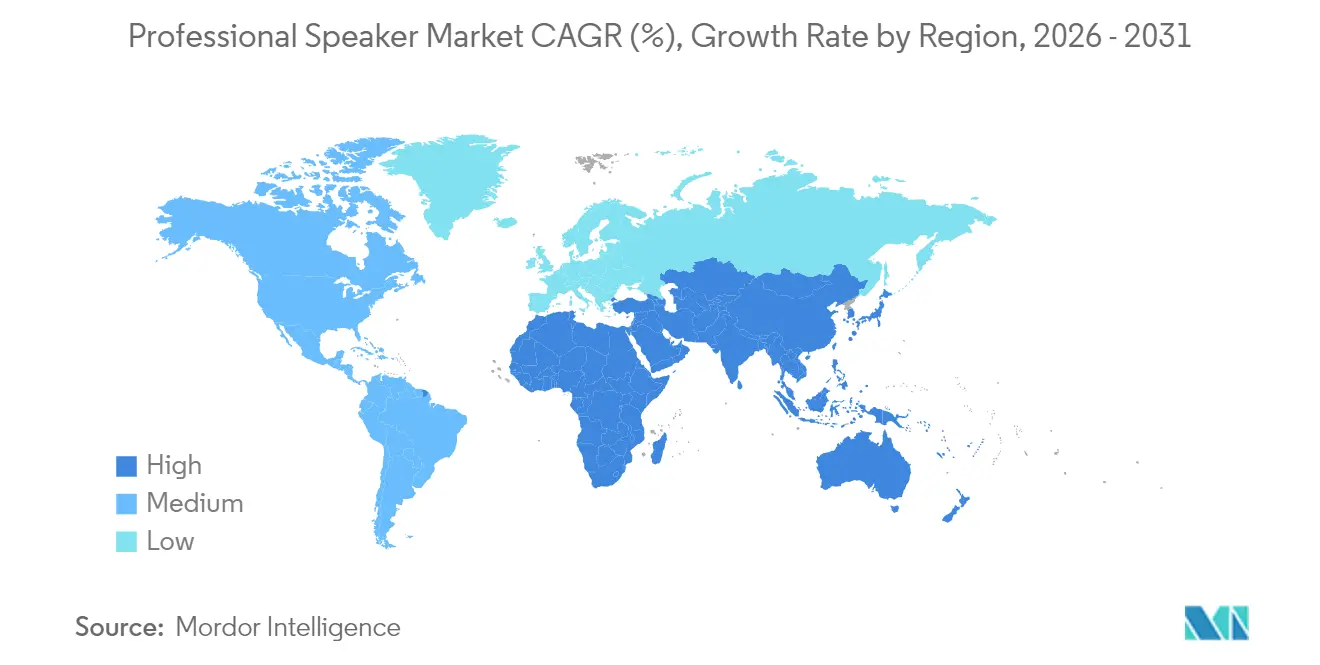
| Fastest Growing Market | Asia Pacific |
| Largest Market | North America |
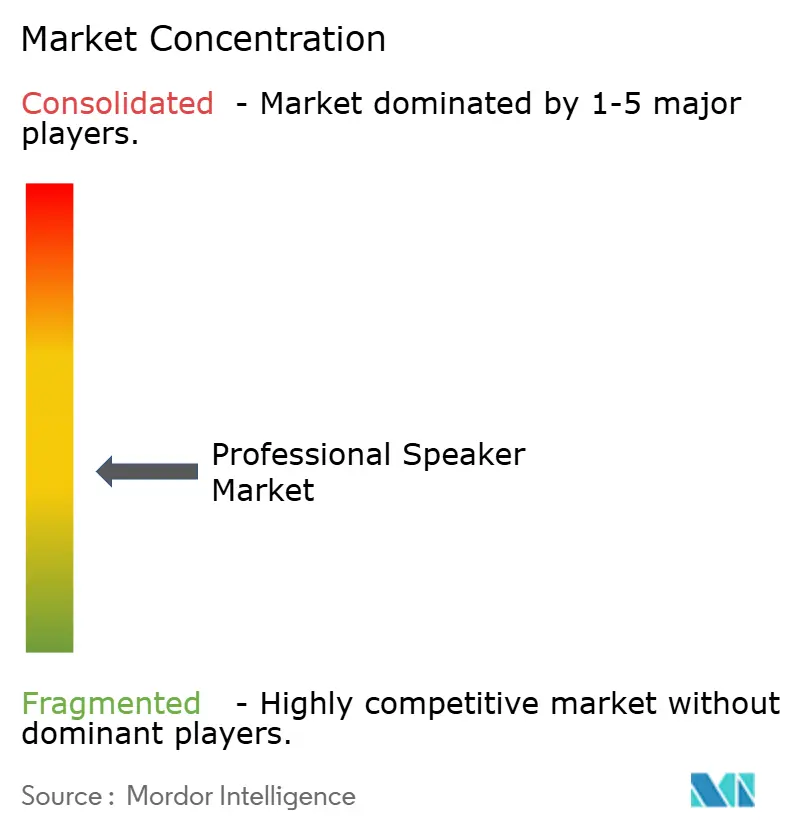
| Market Concentration | Medium |
Major Players *Disclaimer: Major Players sorted in no particular order Image © Mordor Intelligence. Reuse requires attribution under CC BY 4.0. | |
Professional Speaker Market Analysis by Mordor Intelligence
The professional speaker market size was valued at USD 2.19 billion in 2025 and estimated to grow from USD 2.27 billion in 2026 to reach USD 2.69 billion by 2031, at a CAGR of 3.52% during the forecast period (2026-2031). Growth remains moderate because mature corporate and touring segments in North America and Europe offset stronger momentum in Asia Pacific and the Middle East. Large enterprises continue to refresh hybrid-meeting rooms, driving demand for integrated networked loudspeakers that streamline installation and remote management. Venue operators are prioritizing precision-controlled dispersion to comply with tightening noise rules, creating opportunities for cardioid and beam-steering designs. Meanwhile, supply chain uncertainty for neodymium magnets is prompting vertically integrated sourcing strategies, while AI-enhanced processing is emerging as a premium differentiator in immersive and e-sports applications.
Key Report Takeaways
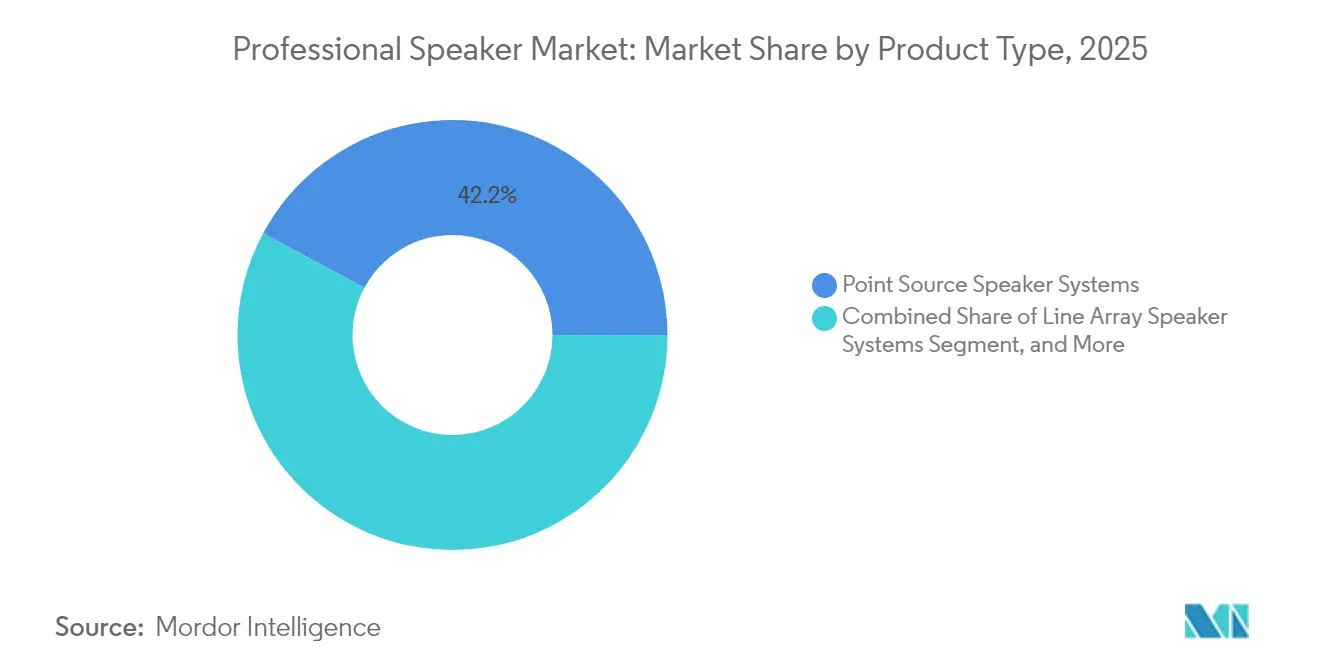
- By product type, line array speaker systems led with 57.85% revenue share of the professional speaker market in 2025; subwoofers are projected to expand at a 4.12% CAGR to 2031.
- By amplification method, powered speaker systems held 67.55% of the professional speaker market share in 2025; the same segment is expected to grow at a 3.63% CAGR through 2031.
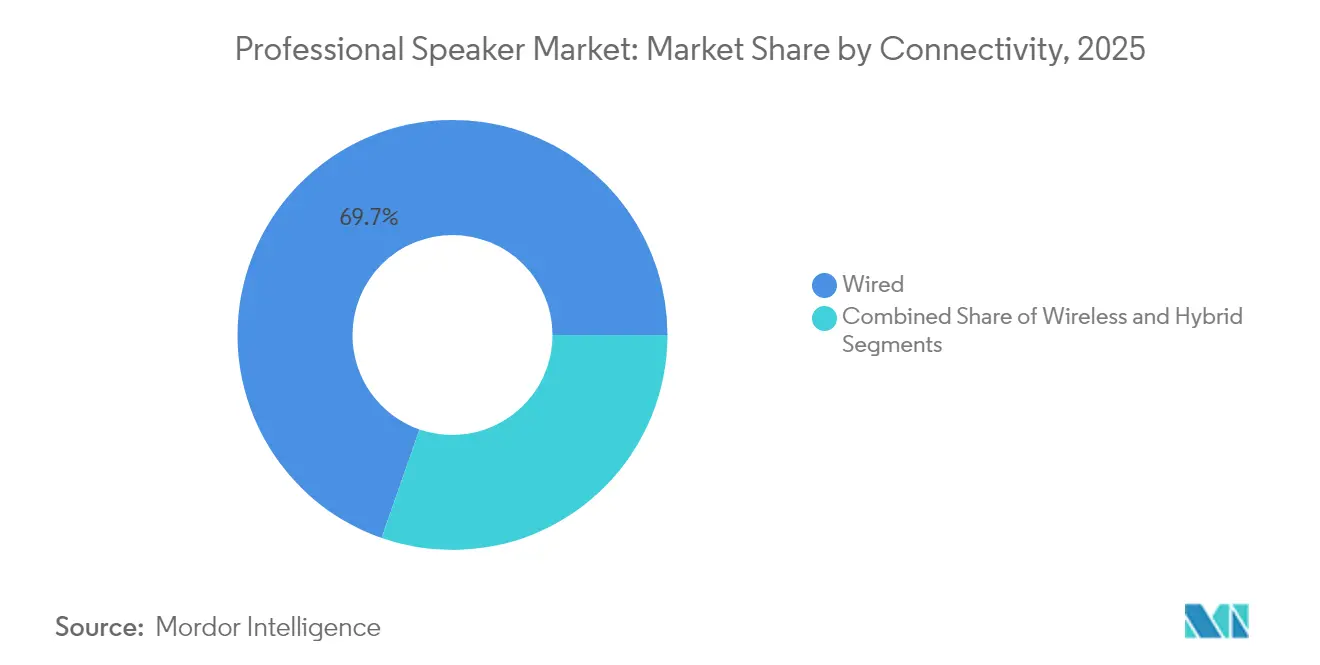
- By connectivity, wired solutions commanded 69.65% share of the professional speaker market size in 2025, while wireless connectivity is advancing at a 5.18% CAGR.
- By power output, the below-500 W segment accounted for 44.92% of the professional speaker market size in 2025; the 500-1,000 W category is forecast to grow at 3.98% CAGR between 2026-2031.
- By end-user, corporate installations captured 30.12% of the professional speaker market in 2025; large venues and events exhibit the highest projected CAGR at 3.66% through 2031.
- By distribution, specialized retail stores held a 49.40% share in 2025, aided by in-person demonstrations and turnkey integration services. online channels will register a 3.98% CAGR to 2031
- By geography, North America represented 33.95% revenue share in 2025, while Asia Pacific is set to register a 4.17% CAGR to 2031.
Note: Market size and forecast figures in this report are generated using Mordor Intelligence’s proprietary estimation framework, updated with the latest available data and insights as of 2026.
Global Professional Speaker Market Trends and Insights
Drivers Impact Analysis*
| Driver | (~) % Impact on CAGR Forecast | Geographic Relevance | Impact Timeline |
|---|---|---|---|
| Corporate AV modernization | +0.8% | North America, Western Europe | Medium term (2-4 years) |
| Hybrid and virtual event proliferation | +0.7% | Global (North America and Europe concentration) | Short term (≤ 2 years) |
| Smart-city convention infrastructure | +0.6% | Asia Pacific (China, India, ASEAN) | Long term (≥ 4 years) |
| Immersive audio in eSports arenas | +0.5% | Global (early adoption in North America, East Asia) | Medium term (2-4 years) |
| Tourism-driven venue construction | +0.4% | Middle East (UAE, Saudi Arabia) | Medium term (2-4 years) |
| OEM demand for powered and networked speakers | +0.3% | Global (North America and Europe focus) | Short term (≤ 2 years) |
| Source: Mordor Intelligence | |||
Corporate AV Modernization Driving Premium Audio Adoption in North America
Enterprises are allocating 15-20% more meeting-room budgets to audio than in 2019, reflecting the direct link between sound quality and hybrid-work productivity. Distributed ceiling arrays are replacing front-of-room boxes to deliver consistent voice pickup regardless of seating position. Financial services firms lead uptake, with 78% of Fortune 500 banks implementing campus-wide upgrades that stress voice intelligibility and spatial audio capabilities. The trend lifts demand for networkable speakers that integrate natively with UC platforms and IT security policies. Integrators report double-digit growth in remote monitoring contracts that ensure uptime without on-site visits.
Rapid Proliferation of Hybrid and Virtual Events Requiring High-Performance Speaker Arrays
Event organizers are specifying audio systems able to serve both in-person and streamed audiences without duplicate signal chains. Networked protocols route multichannel feeds to broadcast encoders while maintaining low-latency reinforcement in the room. AI-driven mixers automatically compensate for acoustic changes and streaming codec losses, reducing engineering overhead. VR and AR adoption inside corporate showcases is accelerating demand for immersive arrays that support spatial audio objects. These requirements favor scalable line arrays with integrated DSP and tight phase coherence across coverage zones.
Government Investments in Smart-City Convention Infrastructure Across Asia
China, India, and ASEAN states channel large-scale public funds into multi-hall convention centers that embed networked AV from the outset. Audio budgets equal 8-12% of technology allocations, with modular line arrays preferred for flexible room configurations. Singapore now mandates that new government-funded venues support simultaneous physical and virtual events, influencing tender specifications toward redundant IP audio backbones. Contractors favor suppliers offering end-to-end solutions, including software for predictive maintenance and cloud-based system health dashboards.
Rising Demand for Immersive Audio in eSports Arenas Globally
Purpose-built eSports venues dedicate up to 20% of their technology budgets to sound systems that create spatial cues for players and cinematic impact for spectators. Hybrid architectures combine PA arrays for audience reinforcement with near-field loudspeakers and head-tracking monitoring for competitors. Beam-steered systems focus SPL on seating zones while isolating play areas, supporting competitive integrity, and viewer engagement. Demand is strongest in North America and East Asia, where eSports revenues exceed USD 2 billion annually. These venues adopt AI-assisted tuning that adjusts coverage in real time as audience sizes fluctuate.
Restraints Impact Analysis*
| Restraint | (~) % Impact on CAGR Forecast | Geographic Relevance | Impact Timeline |
|---|---|---|---|
| Neodymium magnet supply volatility | -0.6% | Global (highest impact in North America and Europe) | Medium term (2-4 years) |
| Venue-noise regulations in Europe | -0.5% | Europe (strictest in Germany, UK, Scandinavia) | Long term (≥ 4 years) |
| Long replacement cycles in education | -0.4% | Asia Pacific, Latin America, Middle East and Africa | Medium term (2-4 years) |
| Wireless synchronization complexity | -0.3% | Global | Short term (≤ 2 years) |
| Source: Mordor Intelligence | |||
Supply Volatility of Neodymium Magnets Increasing BOM Costs
Neodymium price swings of 30-40% during 2024 eroded margins and forced rolling price lists. China controls about 85-90% of sintered NdFeB magnet output, exposing Western brands to geopolitical risk.[1]Glenn Zorpette, “Advanced Magnet Manufacturing Begins in the United States,” IEEE Spectrum, spectrum.ieee.org The U.S. Department of Defense now requires domestic sourcing for military projects, encouraging firms such as MP Materials to open a Fort Worth facility capable of 1,000 tonnes annually. Manufacturers pursue three hedges: funding recycling programs that could cover up to 19% of magnet demand by 2030, investing in alternative ferrite blends for mid-tier products, and negotiating long-term contracts with diversified suppliers.
Venue-Noise Regulations Limiting High-SPL Deployments in Europe
City ordinances in Berlin, London, and Stockholm cap outdoor events at 96 dB(A), compelling system designers to prioritize directional control over raw output. Precision beam-steering and cardioid arrays deliver target SPL in seating zones while trimming off-site leakage. Product roadmaps now emphasize adjustable waveguides and real-time sound field modeling. Manufacturers able to document clear compliance gain an edge in tender scoring, especially for publicly funded cultural venues that must balance audience expectations with community noise objectives.
*Our forecasts treat driver/restraint impacts as directional, not additive. The impact forecasts reflect baseline growth, mix effects, and variable interactions.
Segment Analysis
By Product Type: Line Array Systems Sustain Leadership but Hybrids Emerge
Line arrays accounted for 57.85% of the professional speaker market in 2025, reflecting their scalability and even coverage across varied venue geometries. Their use has expanded from touring to fixed corporate auditoriums where reconfigurable layouts demand adaptable vertical dispersion. Subwoofers are projected to grow at 4.12% CAGR to 2031 as immersive content and EDM-centric entertainment raise low-frequency expectations. Point-source cabinets remain favored in smaller installations that value simplicity and lower cost, while slim column arrays win projects with stringent aesthetic constraints.
The professional speaker market size for line arrays is projected to approach USD 1.56 billion by 2031 at the current growth trajectory. Manufacturers are blending line-array directional control with point-source coherence, creating compact hybrids suited to multipurpose halls. Waveguide software now simulates coverage zones in minutes, shortening design cycles. Neodymium driver shortages elevate the appeal of dual-coil ferrite alternatives refined to cut weight by 20% without compromising sensitivity. Precision manufacturing, including 3-D printed phase plugs, is improving high-frequency response uniformity.


By Amplification Method: Powered Models Drive Integration
Powered-speaker systems captured 67.55% revenue share in 2025 and will expand fastest at 3.63% CAGR through 2031. Users gain simplified wiring, factory-matched components, and native DSP that tunes performance to room acoustics. Passive boxes persist in large touring rigs that benefit from centralized rack amplification for quick swap-outs, yet their share keeps shrinking as powered packages narrow weight and cost gaps.
The professional speaker market size generated by powered models surpassed USD 1.48 billion in 2025 and is set to exceed USD 1.83 billion by 2031. Class-D modules deliver over 1,000 W from cabinets weighing less than 15 kg, opening mobile use cases that once required truck-loaded racks. Battery-powered variants now cover corporate breakouts and street festivals, supported by energy-dense lithium packs and efficient sleep-modes. Powersoft’s majority stake in K-Array illustrates the strategic significance of integrated amplification platforms, enabling end-to-end solutions that fuse loudspeakers, DSP, and network monitoring.
By Connectivity: Wireless Adoption Accelerates in Corporate Spaces
Wired links still dominate with 69.65% share in 2025 thanks to their deterministic latency and immunity to RF congestion. Yet wireless audio is forecast to post the segment’s strongest 5.18% CAGR, propelled by enterprises seeking clutter-free meeting rooms. Hybrid topologies use Ethernet backbones for clock distribution while feeding wireless endpoints in architecturally constrained zones.Corporate users report that 80% of staff employ wireless presentation monthly, pushing IT teams to standardize secure audio encryption.
The professional speaker market share for wireless endpoints is on track to double by 2031 as Wi-Fi 6 delivers robust bandwidth and lower latency. Vendors are embedding spectrum-scanning radios that hop channels automatically, minimizing dropouts in congested urban deployments. End-to-end authentication protocols now align with enterprise zero-trust frameworks, mitigating former security objections.
By Power Output: Mid-Power Class Leads Growth Path
Below-500 W models held a 44.92% share in 2025, suitable for distributed corporate and hospitality systems where moderate SPL suffices. The 500-1,000 W tier is the fastest-expanding band at 3.98% CAGR, driven by mid-size venues adopting more dynamic multimedia content. Efficiency gains let modern 700 W cabinets rival legacy 1 kW boxes for output, extending application breadth.
The professional speaker market size for the 500-1,000 W band is forecast to climb from USD 730 million in 2025 to USD 923 million by 2031. Advanced limiter algorithms safeguard drivers at higher duty cycles, allowing prolonged high-output operation without thermal shutdowns. Touring companies can now cover arenas with fewer enclosures, lowering freight costs. Meanwhile, energy-conscious venues appreciate that class-D conversion efficiencies exceed 90%, which cuts power bills and helps meet sustainability targets.
By End-User: Corporates Remain Largest, Venues Rebound Fast
Corporate installations commanded 30.12% revenue in 2025 as firms retrofit spaces for hybrid collaboration. Audio upgrades focus on voice intelligibility, with ceiling arrays and beamforming microphones pairing with low-profile loudspeakers to create lifelike remote meetings. The professional speaker market size within corporate settings is projected to approach USD 790 million by 2031, supported by evergreen refresh cycles tied to IT budgets.
Large venues and events will grow at 3.66% CAGR, lifted by pent-up demand for live entertainment and purpose-built eSports arenas. Stadium projects specify immersive systems that synchronize on-site PA with mobile-app audio for synchronized fan engagement. Education retains steady demand yet shows longer replacement intervals, while broadcast and studio environments, though smaller, shape product roadmaps through advanced feature requests. Hospitality and tourism venues, especially in the Middle East, increasingly view premium sound as a brand differentiator, adopting distributed systems that cover lobbies, pools, and rooftop lounges.

By Distribution Channel: Online Sales Scale but Retail Expertise Persists
Specialized retail stores held a 49.40% share in 2025, aided by in-person demonstrations and turnkey integration services. Online channels will register a 3.98% CAGR to 2031, leveraging detailed 3-D configurators, virtual demos, and transparent pricing for commodity products. Direct OEM integration remains vital for mega-projects demanding custom enclosure finishes or network-security certification.
Consumers often research products online and then book in-store trials, reflecting a hybrid path-to-purchase. Retailers respond by bundling advisory, installation, and long-term maintenance into service contracts that pure e-commerce sites struggle to match. Manufacturers are deploying augmented-reality tools allowing planners to visualize coverage and enclosure aesthetics within actual rooms before ordering, shortening decision cycles and boosting confidence in remote transactions.
Geography Analysis
North America led the professional speaker market with 33.95% revenue share in 2025 as corporations overhauled meeting spaces and live-touring activity rebounded. U.S. unit sales of high-power systems for touring and permanent installs surged 54% in 2024, supported by early adoption of networked audio protocols that simplify large-scale deployments. Canadian venues follow similar patterns, upgrading legacy rigs to meet stricter occupational sound exposure standards.
Asia Pacific is the fastest-growing geography, expected to post a 4.17% CAGR through 2031 as public investments fuel convention-center construction across China, India, and Southeast Asia. China alone earmarked USD 15 billion for tier-two and tier-three city convention centers through 2027, with audio comprising up to 12% of technology budgets. The region’s pro-AV revenue is projected to reach USD 66.44 billion by 2029 at a 5.54% CAGR. India’s commercial real-estate boom and government push for international expo hubs provide an additional catalyst, while Japan and South Korea focus on immersive systems for cultural venues and theme parks.
Europe holds a steady share but grapples with stringent noise regulations that cap SPL and drive demand for directional dispersion. Germany, the UK, and Scandinavia now require outdoor events to remain below 96 dB(A), prompting accelerated adoption of beam-steering arrays. Southern Europe invests in festival infrastructure to stimulate tourism, yet installations must balance output with community tolerance.
The Middle East, though smaller, exhibits robust growth as Saudi Arabia and the UAE roll out multipurpose entertainment complexes integral to economic-diversification plans. Africa and Latin America remain early-stage markets, yet smart-city pilots in Kenya and Brazil suggest latent demand once macroeconomic conditions stabilize.

Competitive Landscape
The professional speaker market features moderate concentration; the ten largest vendors generate roughly 65% of global revenue, leaving room for niche specialists. Consolidation accelerates as brands pursue technology breadth and distribution scale. Powersoft’s EUR 50 million purchase of a 51% stake in K-Array illustrates the ambition to evolve from component amplifiers to holistic solutions. Harman Professional Solutions launched AI-directed beam-steering speakers at Prolight + Sound 2025, signaling competition around intelligent dispersion.
Differentiation now hinges on software-driven value. Vendors embed firmware that monitors temperature, excursion, and impedance, feeding cloud analytics for predictive maintenance. Integrators selling managed-service contracts capitalize on these diagnostics to minimize downtime. In eSports, L-Acoustics partnered with arena developers to codify standardized specifications, positioning its immersive platform as a turnkey reference. Smaller firms win by specializing: one focuses on recyclable enclosures to satisfy European sustainability mandates, another pioneers robotic arrays that adjust coverage via motorized articulation in real time.
AI stands out as the emerging arms race. The Professional Audio Manufacturers Alliance highlighted that software integration can mitigate skilled-labor shortages during system commissioning. Vendors able to auto-tune arrays for varying crowd sizes and room acoustics reduce setup time and cut operational risk, advantages that translate into premium pricing. Market entrants with deep learning competencies could disrupt incumbents, yet established brands defend share through global support networks, proprietary control ecosystems, and vertically integrated manufacturing that buffers supply-chain shocks.
Professional Speaker Industry Leaders
Bose Corporation
Harman International (Samsung)
D&B Audiotechnik
Yamaha Corporation
K-Array
- *Disclaimer: Major Players sorted in no particular order

Recent Industry Developments
- May 2025: Powersoft S.p.A. completed the acquisition of a 51% stake in K-Array S.r.l. for about EUR 50 million (USD 58.58 million), aiming to broaden its portfolio from amplifiers to full audio solutions.
- April 2025: MP Materials began production at its Fort Worth, Texas, NdFeB magnet plant, introducing 1,000 tonnes of annual capacity and reducing reliance on Chinese magnet supply.
- March 2025: Harman Professional Solutions launched AI-enabled speakers with adaptive beam-steering at Prolight + Sound 2025, optimizing dispersion in real time.
- February 2025: L-Acoustics entered a strategic partnership with an eSports-arena developer to create standardized audio specifications for competitive gaming venues.


Research Methodology Framework and Report Scope
Market Definitions and Key Coverage
Our study defines the professional speaker market as factory-built, electro-acoustic loudspeaker enclosures that are purpose-designed for sound reinforcement, studio monitoring, broadcast, touring, or installed commercial audio. Systems may be passive or self-powered, point source, line-array, or subwoofer formats; revenues track ex-factory hardware only.
Scope exclusion, consumer audio: home entertainment soundbars, smart speakers, and Bluetooth-only portable models fall outside this assessment.
Segmentation Overview
- By Product Type
- Point Source Speaker Systems
- Line Array Speaker Systems
- Subwoofers
- Other Product Types
- By Amplification Method
- Passive Professional Speaker Systems
- Powered Speaker Systems
- By Connectivity
- Wired
- Wireless
- Hybrid (Wired + Wireless)
- By Power Output (Watts)
- Below 500 W
- 500 - 1000 W
- Above 1000 W
- By End-User
- Corporates
- Large Venues and Events
- Educational Institutions
- Government and Military
- Studio and Broadcasting
- Hospitality
- Other Sectors
- By Distribution Channel
- Direct OEM Manufacturing and Integration
- Retail Stores
- Online Sales Channels
- By Geography
- North America
- United States
- Canada
- Mexico
- Europe
- Germany
- United Kingdom
- France
- Italy
- Spain
- Nordics (Denmark, Sweden, Norway, Finland)
- Rest of Europe
- Asia-Pacific
- China
- Japan
- South Korea
- India
- Southeast Asia
- Australia
- Rest of Asia-Pacific
- South America
- Brazil
- Argentina
- Rest of South America
- Middle East
- GCC
- Turkey
- Rest of Middle East
- Africa
- South Africa
- Nigeria
- Rest of Africa
- North America
Detailed Research Methodology and Data Validation
Primary Research
Mordor analysts interviewed rental firms in North America, systems integrators in Europe, OEM product managers in Asia Pacific, and venue procurement heads in the Middle East. Insights on replacement cycles, average selling prices, and network-audio adoption rates bridged gaps left by public filings and confirmed directional trends flagged during desk work.
Desk Research
We began with structured queries across non-paywalled tier-1 sources such as UN Comtrade HS 8518 shipment data, Eurostat Prodcom 26401990 output tables, Federal Communications Commission import filings, AVIXA industry outlooks, and journals of the Audio Engineering Society. Company 10-Ks, investor decks, and major trade-show audits (NAMM, ISE) enriched brand-level splits. D&B Hoovers supplied private-company revenue bands, while Dow Jones Factiva tracked M&A moves that reshape market share. Questel patent counts signaled emerging networked-speaker technologies. These sources illustrate, not exhaust, the wider evidence pool checked for every data point.
Market-Sizing & Forecasting
A top-down model rebuilt global demand from production and trade flows, which are then aligned to end-user pools by mapping venue counts, live-event attendance, and corporate AV capital spending. Select bottom-up approximations, sampled integrator invoices, channel checks, and OEM ASP × unit outputs validate and fine-tune totals. Key variables include average venue renovation cadence, share of powered cabinets, weighted ASP differentials for Dante-enabled models, active stadium construction, and regional live-event ticket revenue. Multivariate regression links these indicators to shipment values, after which ARIMA smoothing extends the forecast through 2030 and scenario analysis stress-tests recession or component-shortage shocks.
Data Validation & Update Cycle
Triangulation, variance scans, and peer review precede sign-off. Outputs are compared with independent metrics such as live-event box-office receipts and integrator backlog indices. Reports refresh each year; interim updates trigger when material events, major regulation, force-majeure, or $100 million-plus mergers shift fundamentals. Before delivery, an analyst re-checks every assumption so clients receive the most current view.
Why Mordor's Professional Speaker Baseline Commands Reliability
Published figures often diverge because firms pick different hardware scopes, currency bases, and refresh cadences. Some fold consumer soundbars into totals, while others freeze exchange rates for several years.
Benchmark comparison
| Market Size | Anonymized source | Primary gap driver |
|---|---|---|
| USD 2.19 B (2025) | Mordor Intelligence | |
| USD 2.54 B (2024) | Global Consultancy A | Includes consumer soundbars and Bluetooth portables, uses list prices without channel margins |
| USD 2.50 B (2024) | Trade Journal B | Excludes Asia Pacific rental channels and applies static FX rates from 2022 |
| USD 2.19 B (2024) | Industry Association C | Counts unit shipments but multiplies by average retail price, inflating value vs. ex-factory basis |
The comparison shows that variances stem less from arithmetic errors and more from scope and pricing choices. By anchoring values on ex-factory hardware, yearly ASP refresh, and a transparent variable set, Mordor's methodology delivers a balanced, traceable baseline that decision-makers can reliably build upon.


Key Questions Answered in the Report
What is the current value of the professional speaker market?
The professional speaker market size is USD 2.27 billion in 2026 and is projected to reach USD 2.69 billion by 2031.
Which product segment holds the largest share?
Line array speaker systems lead the professional speaker market with 57.85% revenue share in 2025.
Why are powered speakers gaining popularity over passive models?
Powered systems integrate amplification and DSP, simplifying setup, lowering cabling costs, and enabling remote monitoring, which drives their 3.63% CAGR growth outlook through 2031.
Which region is expanding fastest?
Asia-Pacific is the fastest-growing geography, forecast to post a 4.17% CAGR through 2031 due to smart-city convention projects and new entertainment venues.
How are supply-chain challenges affecting manufacturers?
Volatility in neodymium magnet prices-linked to China’s 85-90% share of global output-raises bill-of-materials costs and spurs investment in recycling and domestic magnet production.
What role does artificial intelligence play in new loudspeaker systems?
AI algorithms now drive adaptive beam-steering, automatic room tuning, and predictive maintenance, helping venues optimize acoustics and reduce downtime.
Page last updated on:


