Preservatives Market Size and Share
Market Overview
| Study Period | 2021 - 2031 |
|---|---|
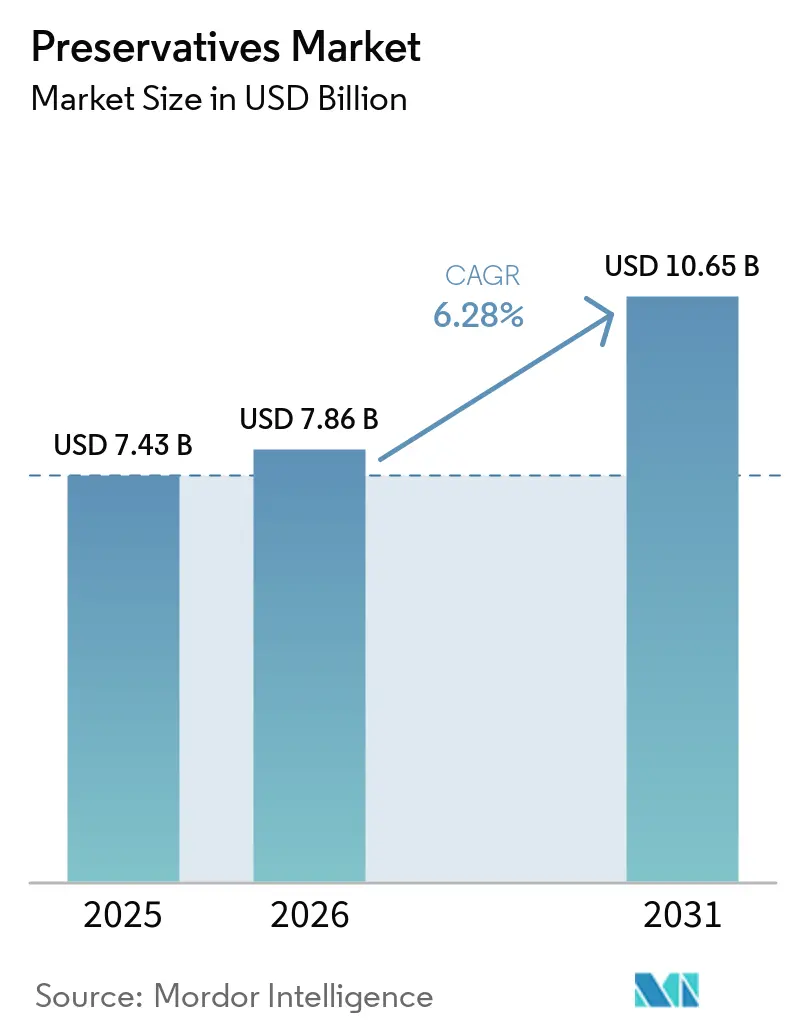
| Market Size (2026) | USD 7.86 Billion |
| Market Size (2031) | USD 10.65 Billion |
| Growth Rate (2026 - 2031) | 6.28% CAGR |
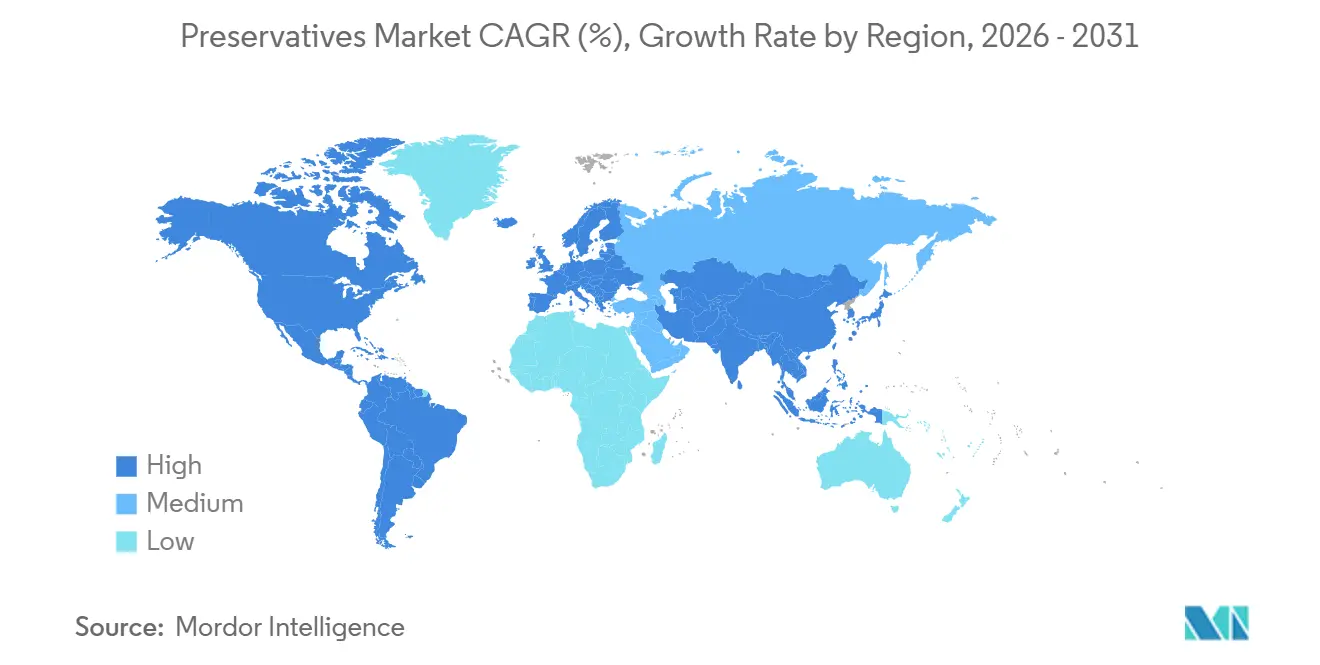
| Fastest Growing Market | Asia-Pacific |
| Largest Market | North America |
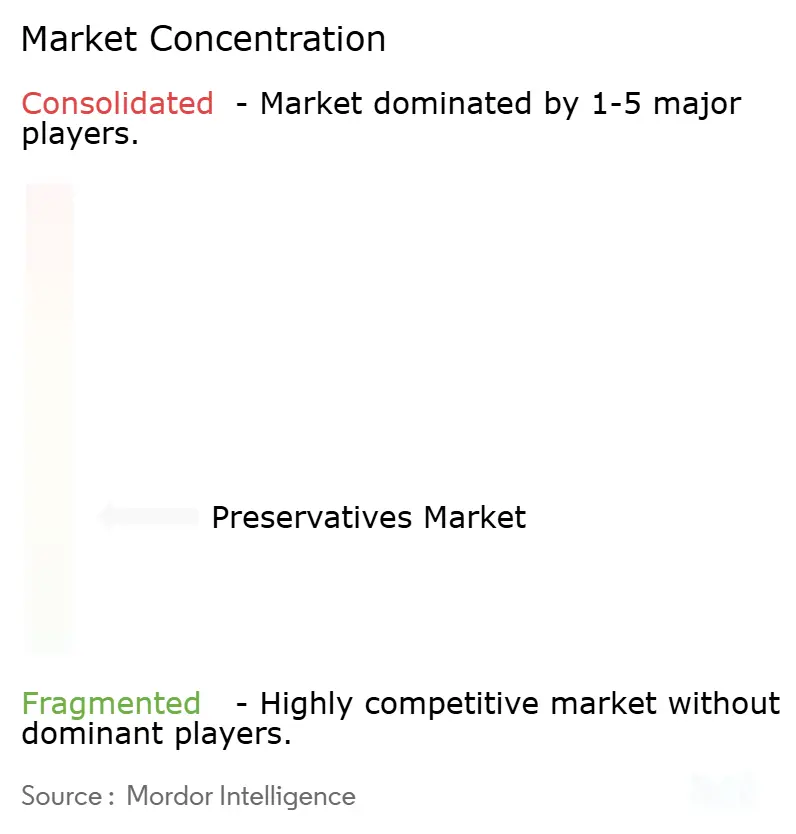
| Market Concentration | Low |
Major Players
*Disclaimer: Major Players sorted in no particular order Image © Mordor Intelligence. Reuse requires attribution under CC BY 4.0. |
|
Preservatives Market Analysis by Mordor Intelligence
The global preservatives market size is expected to grow from USD 7.43 billion in 2025 to USD 7.86 billion in 2026 and is forecast to reach USD 10.65 billion by 2031 at 6.28% CAGR over 2026-2031. With the growing demand for processed and convenience foods and the extension of supply chains in rapidly urbanizing regions, the global food preservatives market is becoming a cornerstone of modern food systems. This growth is further supported by the increasing use of preservatives in industries such as pharmaceuticals and personal care. According to the Food and Agriculture Organization (FAO), food loss and waste contribute to 8–10% of global greenhouse gas emissions[1]Source: Food and Agriculture Organization, "Policy Support and Governance Gateway," fao.org. This alarming statistic has led to heightened policy efforts to promote effective preservation methods that extend product shelf life. At the same time, the industry is shifting its focus to balance microbial safety and oxidative stability with consumer preferences for natural and fermentation-derived alternatives. This shift highlights the dual role of preservatives: safeguarding food quality and driving sustainability, innovation, and consumer confidence in global markets. As regulatory requirements become stricter and consumer expectations evolve, companies that develop clean-label solutions are well-positioned to capture high-value opportunities. The market’s growth trajectory emphasizes its critical role as both a sustainability enabler and a source of competitive advantage.
Key Report Takeaways
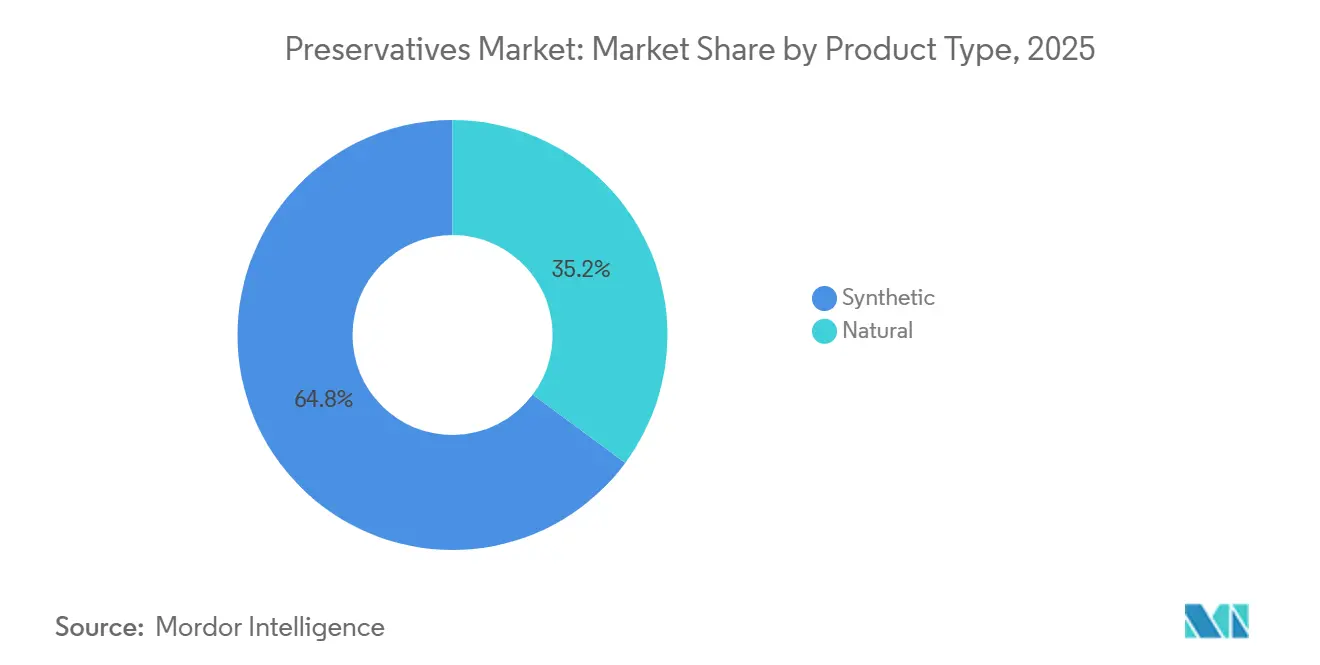
- By product type, synthetic preservatives led the global preservatives market with a share of 64.84% in 2025, while natural preservatives are anticipated to register the fastest CAGR of 8.02% during 2026-2031.
- By function, antimicrobial led the global preservatives market with a share of 67.56% in 2025, while antioxidant is anticipated to register the fastest CAGR of 7.12% during 2026-2031.
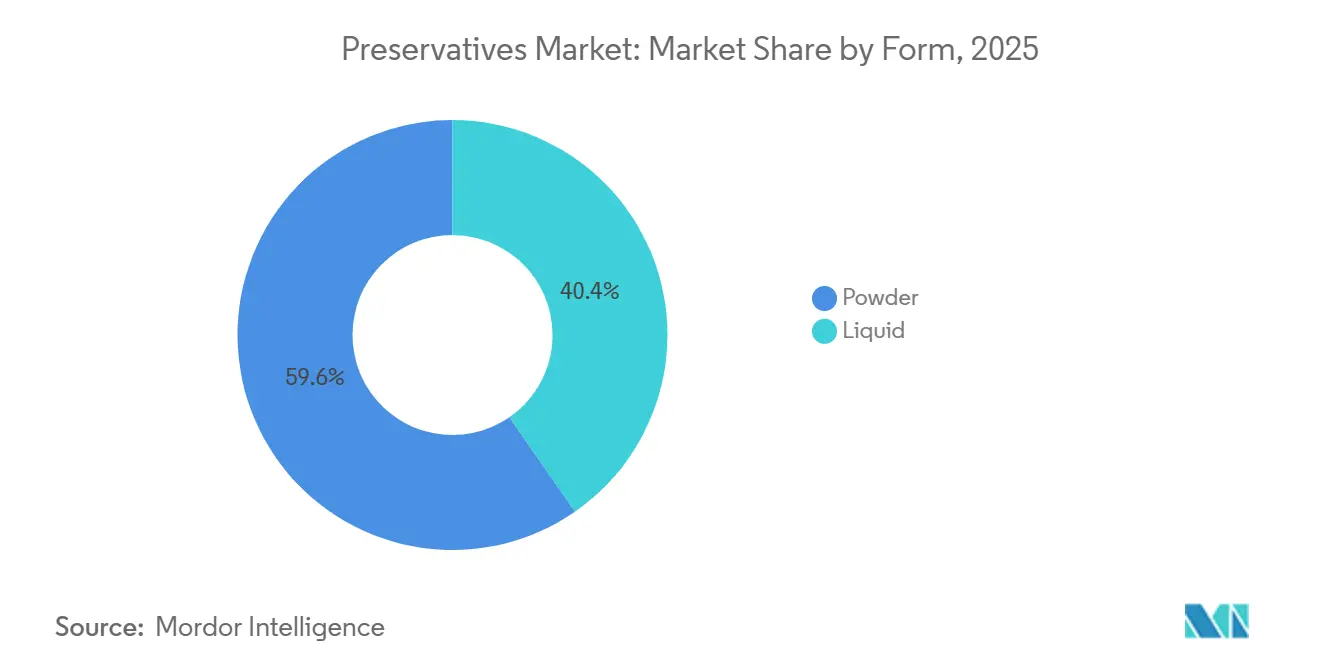
- By form, powder retained 59.64% share in 2025, whereas liquid is forecast to expand at a 6.88% CAGR through 2031.
- By application, food and beverages held 55.03% of 2025 revenue, but pharmaceuticals is expected to grow fastest at 7.45% through 2031.
- By geography, North America led the global preservatives market with a share of 33.21% in 2025, while Asia-Pacific is anticipated to register the fastest CAGR of 7.34% during 2026-2031.
Note: Market size and forecast figures in this report are generated using Mordor Intelligence’s proprietary estimation framework, updated with the latest available data and insights as of January 2026.
Global Preservatives Market Trends and Insights
Drivers Impact Analysis*
| Driver | (~) % Impact on CAGR Forecast | Geographic Relevance | Impact Timeline |
|---|---|---|---|
| Rising demand for longer shelf life amid growth of processed and convenience foods | +1.4% | Global, concentrated in Asia-Pacific and Middle East and Africa growth markets | Short term (≤ 2 years) |
| Food waste reduction initiatives accelerating preservative adoption | +0.8% | Global, strongest policy impact in European Union and developing markets | Medium term (2–4 years) |
| Clean-label reformulation accelerating demand for natural preservation systems | +1.2% | North America and Europe (regulatory pressure), spreading to Asia-Pacific | Short to medium term |
| Pharmaceutical and biologic product growth supporting demand for high-purity preservatives | +0.7% | North America, Europe, Asia-Pacific (Japan, India, South Korea) | Medium to long term (≥ 4 years) |
| Rising adoption of natural preservation in personal care formulations | +0.5% | Europe (regulatory-driven), North America, Asia-Pacific premium segments | Medium term (2–4 years) |
| Fermentation-derived preservatives gaining commercial acceptance across multiple sectors | +0.8% | Global; early commercialization in North America and Europe | Short to medium term |
| Source: Mordor Intelligence | |||
Rising demand for longer shelf life amid growth of processed and convenience foods
The global preservatives market is experiencing robust growth, driven by the increasing demand for processed and convenience foods. As supply chains become longer and more complex, businesses are relying on effective preservation systems to maintain microbial safety and ensure product stability from production to retail shelves. Even traditionally "fresh" product categories, such as chilled ready meals, plant-based meat alternatives, and ambient dairy beverages, are adopting advanced preservation strategies. These strategies often integrate antimicrobial agents and antioxidants to extend shelf life and maintain quality. In the case of dairy alternatives, formulations using oats, peas, and nuts face unique challenges due to the absence of natural antimicrobial properties found in animal proteins. This has created a need for more sophisticated technical solutions. Industry leaders like Corbion emphasize the critical role of fermentation-based preservation solutions. These solutions not only address customer needs but also scale effectively across diverse manufacturing environments through collaborative innovation. Overall, these factors underscore the indispensable role of preservatives in modern food systems. They enable businesses to achieve operational efficiency, meet consumer expectations, and maintain product integrity in an increasingly demanding market landscape.
Food waste reduction initiatives accelerating preservative adoption
Initiatives to reduce food waste are reshaping the global preservatives market, positioning these ingredients as essential tools for sustainability rather than just functional additives. The Food and Agriculture Organization (FAO) reports that food loss and waste contribute 8-10% of global greenhouse gas emissions. In response, governments and businesses are prioritizing shelf-life extension as a practical strategy to achieve Environmental, Social, and Governance (ESG) goals. This focus is particularly critical in emerging markets, where significant food losses occur during transportation and storage. As a result, demand for both synthetic and biopreservatives is rising to stabilize staple foods. The FAO’s International Day of Awareness of Food Loss and Waste 2025 emphasized the importance of investing in advanced preservation technologies, further integrating preservatives into the global sustainability framework. Beyond consumer-facing applications, this shift is also unlocking new opportunities through government-led food security programs. These developments are broadening the market’s reach and reinforcing its vital role in today’s supply chains.
Clean-label reformulation accelerating demand for natural preservation systems
Clean-label reformulation is transforming the global preservatives market, driving changes in supplier dynamics and increasing demand for natural and fermentation-derived systems. In June 2025, the Food and Agriculture Organization/World Health Organization Joint Expert Committee on Food Additives assessed rosemary extract, a key natural antioxidant preservative, during its 100th meeting[2]Source: World Health Organization (WHO), "Evaluation of certain food additives" who.int. The committee established toxicological benchmarks that support regulatory acceptance across various regions, strengthening the credibility of natural solutions. In the European Union, Regulation 2025/2060 expanded the approved use of sorbic acid (E 200) and potassium sorbate (E 202) to include non-heat-treated plant-based mousses[3]Source: EUR-Lex, "Commission Regulation (EU) 2025/2060 of 14 October 2025 amending Regulation (EC) No 1333/2008 of the European Parliament and of the Council as regards the use of sorbic acid (E 200) and potassium sorbate (E 202) in non-heat-treated plant-based mousses," eur-lex.europa.eu. This specific authorization reflects the proactive efforts of regulators to support preservative applications in emerging plant-based product categories. At the same time, fermentation-derived preservatives such as cultured dextrose and buffered vinegars, which align with clean-label declarations, allow manufacturers to meet consumer transparency expectations while maintaining functional performance. Leading companies like Kerry and Corbion are strategically positioning their product portfolios at the intersection of performance and label clarity. This underscores how clean-label reformulation is not only accelerating the adoption of natural systems but also redefining competitive advantages within the preservatives market.
Fermentation-derived preservatives gaining commercial acceptance across multiple sectors
Fermentation-derived preservatives are rapidly gaining momentum in the commercial market. These solutions effectively bridge the gap between traditional synthetic preservatives and naturally sourced plant extracts, offering scalability, cost efficiency, and a consumer-friendly "natural" appeal. Nisin, produced through the fermentation of Lactococcus lactis, has received regulatory approval from both the United States Food and Drug Administration (FDA) and the European Food Safety Authority (EFSA). This approval enables its extensive use as an antimicrobial agent across food and pharmaceutical industries. Similarly, natamycin is experiencing significant growth in adoption across Asia, particularly in dairy processing and cold-chain operations, due to its effectiveness in controlling mold. Strategic investments, such as Corbion’s circular lactic acid plant in Thailand, are enhancing cost competitiveness and strengthening regional supply chains, positioning fermentation platforms as leaders in the market. This shift demonstrates how fermentation-derived solutions are not only meeting regulatory and consumer demands but are also establishing a sustainable competitive advantage that traditional chemistry-based preservative suppliers will find challenging to replicate.
Restraints Impact Analysis*
| Restraint | (~) % Impact on CAGR Forecast | Geographic Relevance | Impact Timeline |
|---|---|---|---|
| Growing consumer backlash against artificial food additives | -0.7% | North America and Europe (primary), spreading globally via premium retail trends | Short to medium term |
| Stringent regulatory scrutiny on synthetic preservatives | -0.5% | European Union (most acute), North America, Asia-Pacific with Food Safety and Standards Authority of India tightening | Medium to long term |
| High cost of natural and clean-label preservation solutions | -0.4% | Global; strongest impact in price-sensitive developing markets and small and medium-sized enterprises food manufacturers | Medium term |
| Rising adoption of alternative preservation technologies | -0.3% | North America and Europe (premium segments), Asia-Pacific (increasingly in food export supply chains) | Long term (≥ 4 years) |
| Source: Mordor Intelligence | |||
Growing consumer backlash against artificial food additives
Consumer resistance to artificial food additives has emerged as a significant challenge for the global preservatives market. What was once a niche strategy, reformulating products, has now become a business necessity. In North America and Europe, the rise of product launches featuring "no artificial preservatives" claims reflects how consumer preferences are reshaping procurement and innovation strategies. Natural preservative claims are gaining popularity across various product categories. However, the backlash against artificial additives is often broad and indiscriminate, targeting even well-established synthetic systems with proven safety records. This creates pressure to remove these systems, regardless of their regulatory approval. While natural alternatives are appealing, they frequently fail to match the performance or cost-effectiveness of synthetic preservatives in complex applications. As a result, manufacturers are adopting operational adjustments, such as enhanced refrigeration or faster product turnover, to address these challenges. These shifts have led to a reduction in preservative demand in certain market segments, highlighting how consumer perception is increasingly driving market trends over technical performance.
High cost of natural and clean-label preservation solutions
Smaller manufacturers in price-sensitive categories face significant challenges due to the high costs associated with natural and clean-label preservation solutions, which continue to constrain the global preservatives market. Natural preservatives, such as nisin, rosemary extract, and natamycin, are considerably more expensive than synthetic alternatives. Additionally, these natural options often require higher application levels or complex multi-ingredient formulations to achieve the same level of effectiveness as synthetics, further driving up production costs. Even with efforts like Corbion’s circular lactic acid plant, which aims to reduce production expenses, the cost disparity remains substantial. This issue is particularly pronounced in markets with narrow profit margins, where reliance on synthetic preservatives persists. However, consumer demand for transparency and regulatory pressures are pushing the industry to prioritize clean-label solutions. While the transition to natural systems is progressing slowly, advancements in scaling innovations and the adoption of renewable feedstock strategies could help bridge the cost gap over time. For businesses, the key challenge lies in balancing cost-effectiveness with transparency, ensuring that sustainability objectives align with commercial viability and do not compromise profitability.
*Our forecasts treat driver/restraint impacts as directional, not additive. The impact forecasts reflect baseline growth, mix effects, and variable interactions.
Segment Analysis
By Product Type: Natural Segment Narrows the Synthetic Share Lead
In 2025, synthetic preservatives accounted for 64.84% of the global market share, emphasizing their critical role in industries such as food processing, pharmaceuticals, and personal care products. Their dominance is driven by their cost-effectiveness, widespread availability, and compliance with regulatory standards. These preservatives are particularly essential in categories like bakery products, processed meats, and injectable formulations, where ensuring microbial safety and extending shelf life are non-negotiable. Although synthetic preservatives face increasing scrutiny, they remain indispensable in many applications. For instance, while sorbates and propionates continue to be widely accepted, compounds such as Butylated Hydroxytoluene (BHT) and nitrates are encountering growing regulatory and consumer concerns. Despite these challenges, synthetic preservatives maintain a strong foothold in the market, even as reformulation trends begin to reshape the competitive dynamics.
Conversely, natural preservatives are emerging as the fastest-growing segment, with a projected CAGR of 8.02% between 2026 and 2031. Ingredients like tocopherols, rosemary extract, nisin, natamycin, and lactic acid-based systems are gaining significant traction in premium product categories, including bakery, dairy, beverages, and personal care. This growth is largely driven by increasing demand for clean-label products and regulatory support, such as the Joint FAO/WHO Expert Committee on Food Additives’ (JECFA) 2025 evaluation of rosemary extract. Furthermore, fermentation-derived compounds like cultured dextrose and buffered vinegar are redefining classification boundaries. These compounds qualify as “natural” under the Generally Recognized as Safe (GRAS) framework by the United States Food and Drug Administration (FDA) and European Union (EU) standards, thereby expanding the commercial potential of the natural preservatives segment. As consumer demand for transparency continues to rise, companies operating at the intersection of synthetic and natural preservative reformulations are well-positioned to capitalize on this growth. Natural preservative systems are increasingly shaping the competitive landscape, offering a significant advantage in the evolving preservatives market.


By Function: Antimicrobial Applications Set the Structural Baseline, Antioxidants Accelerate
In 2025, antimicrobial preservatives led the market, holding a significant 67.56% share, which highlights their critical importance in the food and pharmaceutical industries. These preservatives are essential for applications ranging from bakery products and deli meats to multi-dose injectable medications. Both synthetic options, such as benzoates, sorbates, and nitrites, and natural alternatives, including nisin, natamycin, and organic acid blends, contribute to this dominance. Even as the industry transitions between natural and synthetic solutions, the fundamental need for antimicrobial protection remains constant, establishing this segment as the backbone of the market.
Meanwhile, antioxidants are projected to be the fastest-growing functional category, with a CAGR of 7.12% from 2026 to 2031. This growth is driven by increasing demand in products like fats, oils, snacks, and plant-based foods, where lipid oxidation can cause rancidity, unpleasant flavors, and color changes, all of which can negatively impact commercial success. Regulatory approvals, such as the Joint FAO/WHO Expert Committee on Food Additives (JECFA)’s 2025 evaluation of ascorbyl palmitate and rosemary extract, have strengthened the credibility of natural antioxidant systems, encouraging their adoption across various markets. Additionally, the market is witnessing a shift toward multi-functional preservative systems that combine antimicrobial and antioxidant benefits. These systems simplify product formulations and reduce the number of ingredients, offering significant value in meat and meat alternatives, where both microbial spoilage and lipid oxidation pose simultaneous challenges.
By Form: Powder Retains Scale Advantages, Liquid Gains Momentum in Ease-of-Use Applications
In 2025, powder preservatives accounted for a significant 59.64% share of the market, highlighting their critical role in dry-blending operations across industries such as bakery, confectionery, dairy powders, and pet food manufacturing. These preservatives are favored for their stability under ambient conditions, ease of transportation, and precise dosing capabilities. As a result, they remain the preferred choice for large-scale processors focused on achieving efficiency and reliability. Powder preservatives continue to form the backbone of the market, thanks to their compatibility with batch-oriented production processes and their ability to deliver cost-effective preservation solutions at scale.
Liquid preservatives, while holding a smaller market share, are experiencing the fastest growth, with a CAGR of 6.88% projected between 2026 and 2031. This growth is driven by the industry's transition toward continuous processing and automation. Liquid preservatives integrate seamlessly into inline dosing systems, which helps reduce manual handling, minimize batch variability, and lower contamination risks. These attributes make them particularly suitable for applications in beverages, sauces, dressings, and dairy products. Leading suppliers such as Kerry and Corbion are strategically expanding their liquid preservative portfolios to meet the needs of wet application environments. This shift indicates that as automation increasingly influences procurement practices, the market is likely to see a gradual tilt toward liquid preservatives, even as powder preservatives retain their advantages in large-scale operations.
By Application: Food and Beverages Anchor Volume, Pharmaceuticals Set the Value Growth Pace
In 2025, the food and beverages sector led the preservatives market, accounting for a significant 55.03% share. This sector, critical to the market's overall volume, includes a diverse range of categories such as bakery, confectionery, dairy and dairy alternatives, beverages, meat and meat alternatives, snacks, sauces, condiments, and fats and oils. Among these, dairy alternatives present distinct challenges, requiring advanced preservation techniques to address microbial and oxidative issues that are not encountered in traditional dairy products. Similarly, the meat and meat alternatives segment demands a dual approach: antimicrobial systems to ensure safety and antioxidants to maintain fat stability. These requirements highlight the essential role of preservatives in preserving quality across various food categories.
The pharmaceuticals sector is the fastest-growing application area, projected to grow at a CAGR of 7.45% between 2026 and 2031. This growth is primarily driven by the increasing adoption of biologics and biosimilars, such as vaccines, monoclonal antibodies, and gene therapies. These advanced medical products require robust antimicrobial systems to maintain sterility, particularly in multi-dose packaging. Additionally, regulatory developments, such as Generally Recognized as Safe (GRAS) submissions to the United States Food and Drug Administration (FDA) for fermentation-derived antimicrobials, are fostering innovation in pharmaceutical-grade preservation. Ingredients like benzyl alcohol and phenoxyethanol are gaining popularity in ophthalmic and parenteral formulations as stricter regulations limit the use of parabens. Meanwhile, the personal care and cosmetics industry is also transitioning toward paraben-free alternatives. The pet food and animal feed sectors are further contributing to growth, driven by a trend toward premiumization, which raises shelf-life expectations to levels comparable to human food. Collectively, these factors not only reinforce the dominance of the food and beverages sector in terms of volume but also position the pharmaceuticals sector as the primary driver of value growth in the preservatives market.
Geography Analysis
In 2025, North America held a significant 33.21% market share, driven by its well-established industries in processed food, pharmaceuticals, and personal care products. The United States Food and Drug Administration's (FDA) Generally Recognized as Safe (GRAS) pathway is accelerating the commercialization of natural preservatives, providing North America with a regulatory advantage over other regions. The United States leads the demand in this market, while Canada and Mexico contribute through integrated United States-Mexico-Canada Agreement (USMCA) supply chains, particularly in bakery, meat, and beverage production. The region faces a dual challenge: the growing demand for clean-label reformulation in food products contrasts with the increasing need for high-purity synthetic preservatives in pharmaceuticals.
The Asia-Pacific region is experiencing rapid growth, with a projected CAGR of 7.34% between 2026 and 2031. Urbanization in countries such as China, India, Indonesia, and Vietnam is transforming food supply chains, shifting consumer preferences from traditional wet markets to packaged and shelf-stable foods. This shift is significantly expanding the market for preservatives. In China, the dairy and processed meat industries are growing rapidly, with natamycin procurement concentrated in coastal areas. In India, stricter regulations on additive labeling are encouraging manufacturers to adopt cleaner and more transparent systems. Japan and South Korea demonstrate sophisticated consumer demand, with a strong emphasis on transparency. Southeast Asia is emerging as a high-growth area, driven by the expansion of the foodservice industry and increased consumption of packaged foods. Australia and New Zealand, reflecting trends seen in Europe, are showing a strong preference for clean-label products and natural preservatives.
In Europe, the regulatory environment plays a critical role in shaping market dynamics. The European Food Safety Authority's (EFSA) comprehensive re-evaluation programs and updated guidelines for additive authorizations are raising scientific standards, favoring companies with robust data capabilities. Key markets such as Germany, the United Kingdom, France, and the Netherlands drive demand, supported by their strong food, pharmaceutical, and cosmetics industries. In the Middle East and Africa, the consumption of packaged foods is on the rise, accompanied by growing investments in food processing. Gulf Cooperation Council (GCC) countries are actively reducing their reliance on imports by developing domestic manufacturing capabilities. Additionally, countries like Egypt, South Africa, and Nigeria are increasing their demand for industrial-scale preservatives. Collectively, these regions illustrate how regulatory frameworks, consumer preferences, and industrial investments are shaping the global landscape of preservative adoption.

Competitive Landscape
The global preservatives market presents a competitive and fragmented landscape where companies gain an edge through diverse product portfolios and specialized application expertise, rather than relying solely on operational scale. Leading chemical corporations such as BASF utilize their integrated Nutrition and Care platforms to address the needs of the food, pharmaceutical, and personal care industries. This approach enables them to leverage cross-segment synergies and maintain strong pricing power. Meanwhile, specialized preservation companies like Corbion and Kerry distinguish themselves through innovation and technical collaboration. For example, Corbion’s Computational Nonlinear Multivariate Interaction Modeling (CNMIM) platform demonstrates how advanced service models can foster customer loyalty by reducing costly trial-and-error processes. This combination of scale-driven industry leaders and application-focused specialists defines the current competitive dynamics of the market.
Opportunities are emerging in underdeveloped segments where established players have limited market penetration. One such area is the preservation of pet food and animal feed, where increasing premiumization is driving shelf-life expectations to levels comparable to human food. Kemin Industries’ expansion of its Nutrisurance unit reflects a strategic effort to capitalize on this growing demand. Another high-potential segment is pharmaceuticals, particularly in biologics and biosimilars, where strict sterility requirements are fueling the need for high-purity preservatives. Additionally, smaller companies such as Galactic, Jungbunzlauer, and Novonesis are disrupting the market for fermentation-derived natural preservatives by combining cost-efficient production methods with strong application development capabilities.
Looking ahead, new entrants utilizing plant cell culture technologies are expected to further transform the competitive landscape. These innovations offer stable antioxidant and antimicrobial compounds with improved heat resistance and delivery mechanisms, posing a challenge to traditional botanical extract suppliers. For instance, Novella Innovative Technology plans to launch commercial-scale operations in 2026, targeting the meat and Asia-Pacific food sectors, supported by a long-term supply agreement. This illustrates how new players can quickly scale their operations and disrupt established competitors. Overall, the competitive dynamics of the market reflect a balance between established leaders, agile specialists, and disruptive innovators, with success increasingly dependent on technical differentiation and the ability to adapt to evolving regulatory and consumer demands.
Preservatives Industry Leaders
-
Cargill, Incorporated
-
BASF SE
-
DSM-Firmenich AG
-
Kerry Group plc
-
Corbion N.V.
- *Disclaimer: Major Players sorted in no particular order

Recent Industry Developments
- March 2026: At the In-Cosmetics Global trade fair in Paris, LANXESS showcased its extensive range of products designed for the cosmetics and personal care industry. Under the tagline "Your partner for preservation solutions,” the specialty chemicals company presented its comprehensive portfolio, which included preservatives, multifunctional ingredients, emollients, and fragrances. A key highlight was the Neolone PH 100 Preservative, positioned as an ideal solution for preserving various cosmetics and personal care products, such as shampoos, conditioners, creams, and baby products. This preservative, powered by the active ingredient phenoxyethanol, offered reliable protection against a broad spectrum of bacteria. Additionally, it had demonstrated exceptional stability across a wide range of pH levels and temperatures, making it a versatile choice for manufacturers.
- October 2025: Kemin Industries celebrated the opening of its new regional headquarters and advanced research laboratory for its pet food and rendering technologies division, Kemin Nutrisurance, in Veronella, Italy. The inauguration, held on October 9, 2025, had represented a significant milestone in the company’s strategy to expand its presence and innovation capabilities across Europe, the Middle East, and Africa (EMEA). The facility spanned 3,400 square meters, with 1,000 square meters dedicated to research activities. Designed to promote collaboration and innovation, the new headquarters had also prioritized creating a supportive and engaging environment for employees.
- June 2025: DSM-Firmenich finalized the sale of its stake in the Feed Enzymes Alliance to its partner Novonesis, a global leader in biosolutions, for EUR 1.5 billion. After accounting for transaction costs, DSM-Firmenich received approximately EUR 1.4 billion in cash from the deal.


Global Preservatives Market Report Scope
Preservatives are substances added to products such as food, beverages, pharmaceuticals, cosmetics, and others to prevent spoilage, microbial growth, or undesirable chemical changes, thereby extending shelf life and maintaining safety, quality, and appearance.
The preservatives market is segmented based on product type, function, form, application, and geography. By product type, the market is segmented into synthetic and natural. By function, the market is segmented into antimicrobial and antioxidant. By form, the market is segmented into liquid and powder. By application, the market is segmented into food and beverages, pharmaceuticals, pet food, personal care and cosmetics, animal feed, and others. By geography, the market is segmented into North America, Europe, Asia-Pacific, South America, and Middle East and Africa. The market forecasts are provided in terms of value (USD) and volume (in Tons).
| Synthetic | Phosphates |
| Benzoates | |
| Sorbates | |
| Propionates | |
| Nitrites and Nitrates | |
| Sulfites | |
| Butylated hydroxytoluene (BHT) | |
| Other Synthetic Preservatives | |
| Natural | Tocopherols |
| Rosemary Extract | |
| Nisin | |
| Natamycin | |
| Vinegar | |
| Green Tea Extract | |
| Lactic acid | |
| Acetic acid | |
| Other Natural Preservatives |
| Antimicrobial |
| Antioxidant |
| Powder |
| Liquid |
| Food and Beverages | Bakery |
| Confectionery | |
| Dairy and Dairy Alternatives | |
| Beverages | |
| Meat and Meat Alternatives | |
| Snacks and Cereals | |
| Sauces, Dressings, and Condiments | |
| Fats and Oil | |
| Other Applications | |
| Pharmaceuticals | |
| Personal Care and Cosmetics | |
| Pet Food | |
| Animal Feed | |
| Others |
| North America | United States |
| Canada | |
| Mexico | |
| Rest of North America | |
| Europe | Germany |
| United Kingdom | |
| Italy | |
| France | |
| Spain | |
| Netherlands | |
| Poland | |
| Belgium | |
| Sweden | |
| Rest of Europe | |
| Asia-Pacific | China |
| India | |
| Japan | |
| Australia | |
| Indonesia | |
| South Korea | |
| Thailand | |
| Singapore | |
| Rest of Asia-Pacific | |
| South America | Brazil |
| Argentina | |
| Columbia | |
| Chile | |
| Peru | |
| Rest of South America | |
| Middle East and Africa | South Africa |
| Saudi Arabia | |
| United Arab Emirates | |
| Nigeria | |
| Egypt | |
| Morocco | |
| Turkey | |
| Rest of Middle East and Africa |
| By Product Type | Synthetic | Phosphates |
| Benzoates | ||
| Sorbates | ||
| Propionates | ||
| Nitrites and Nitrates | ||
| Sulfites | ||
| Butylated hydroxytoluene (BHT) | ||
| Other Synthetic Preservatives | ||
| Natural | Tocopherols | |
| Rosemary Extract | ||
| Nisin | ||
| Natamycin | ||
| Vinegar | ||
| Green Tea Extract | ||
| Lactic acid | ||
| Acetic acid | ||
| Other Natural Preservatives | ||
| By Function | Antimicrobial | |
| Antioxidant | ||
| By Form | Powder | |
| Liquid | ||
| By Application | Food and Beverages | Bakery |
| Confectionery | ||
| Dairy and Dairy Alternatives | ||
| Beverages | ||
| Meat and Meat Alternatives | ||
| Snacks and Cereals | ||
| Sauces, Dressings, and Condiments | ||
| Fats and Oil | ||
| Other Applications | ||
| Pharmaceuticals | ||
| Personal Care and Cosmetics | ||
| Pet Food | ||
| Animal Feed | ||
| Others | ||
| By Geography | North America | United States |
| Canada | ||
| Mexico | ||
| Rest of North America | ||
| Europe | Germany | |
| United Kingdom | ||
| Italy | ||
| France | ||
| Spain | ||
| Netherlands | ||
| Poland | ||
| Belgium | ||
| Sweden | ||
| Rest of Europe | ||
| Asia-Pacific | China | |
| India | ||
| Japan | ||
| Australia | ||
| Indonesia | ||
| South Korea | ||
| Thailand | ||
| Singapore | ||
| Rest of Asia-Pacific | ||
| South America | Brazil | |
| Argentina | ||
| Columbia | ||
| Chile | ||
| Peru | ||
| Rest of South America | ||
| Middle East and Africa | South Africa | |
| Saudi Arabia | ||
| United Arab Emirates | ||
| Nigeria | ||
| Egypt | ||
| Morocco | ||
| Turkey | ||
| Rest of Middle East and Africa | ||


Key Questions Answered in the Report
What is the size of the global preservatives market and how is it expected to grow?
The global preservatives market was valued at USD 7.43 billion in 2025 and is projected to reach USD 10.65 billion by 2031, growing at a CAGR of 6.28% between 2026 and 2031.
Which product type segment held the largest share in 2025?
Synthetic preservatives dominated with a 64.84% share in 2025, reflecting their entrenched role in industrial food, pharmaceutical, and personal care applications.
Which product type segment is expected to grow the fastest?
Natural preservatives are forecasted to expand at a CAGR of 8.02% from 2026 to 2031, driven by clean-label reformulation and regulatory support for botanical and fermentation-derived systems.
What was the largest functional category in 2025?
Antimicrobial preservatives led with a 67.56% share, underscoring their critical role in microbial control across food and pharmaceutical applications.
Which application segment was the largest in 2025?
Food and beverages anchored demand with a 55.03% share, spanning bakery, dairy, meat, beverages, and snacks.
Which region held the largest share in 2025?
North America led with a 33.21% share, supported by strong food, pharma, and personal care industries, alongside favorable regulatory pathways.
Page last updated on:


