
Market Overview
| Study Period | 2021 - 2031 |
|---|---|
| Market Size (2026) | USD 3.81 Billion |
| Market Size (2031) | USD 4.87 Billion |
| Growth Rate (2026 - 2031) | 5.01 % |
| Fastest Growing Market | Middle East and Africa |
| Largest Market | North America |
| Market Concentration | Medium |
Major Players *Disclaimer: Major Players sorted in no particular order Image © Mordor Intelligence. Reuse requires attribution under CC BY 4.0. | |
Food Preservatives Market Analysis by Mordor Intelligence
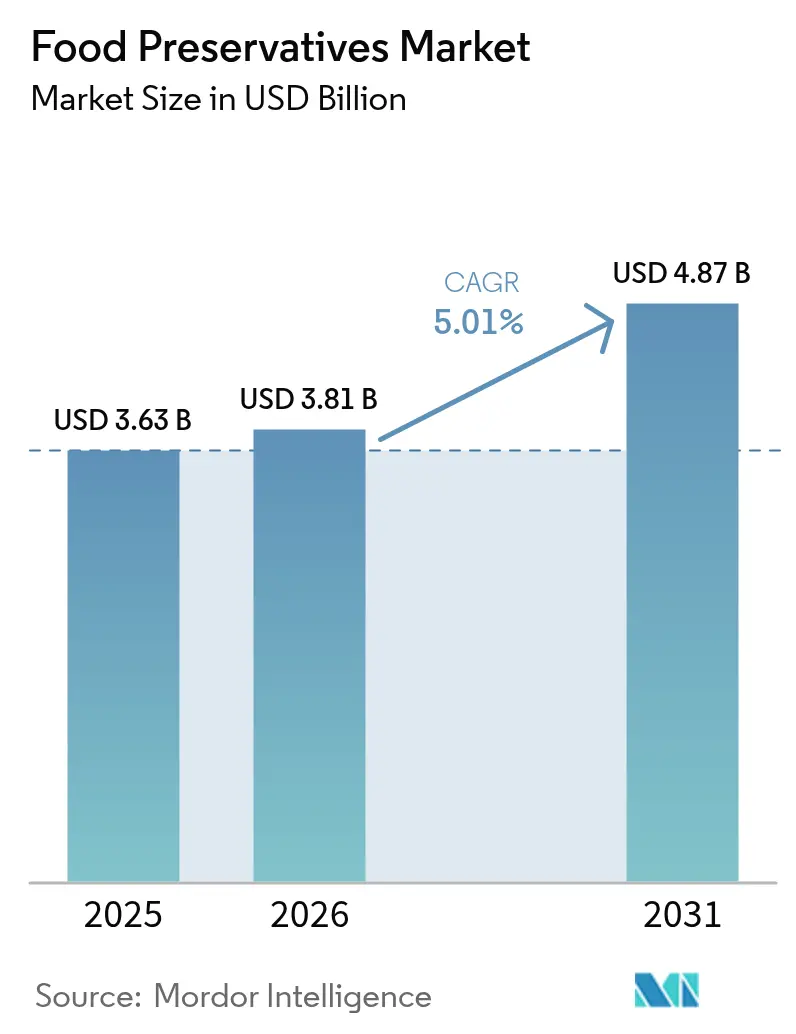
The food preservatives market size is expected to grow from USD 3.63 billion in 2025 to USD 3.81 billion in 2026 and is forecast to reach USD 4.87 billion by 2031 at 5.01% CAGR over 2026-2031. The market size expansion is primarily driven by heightened consumer demand for processed, convenience, and ready-to-eat foods, particularly in rapidly urbanizing regions. A significant market transformation is underway as consumers and regulatory bodies intensify their focus on natural, clean-label, and plant-based preservatives, while increasing scrutiny of synthetic additives and demanding transparent food labeling. The implementation of stringent food safety regulations, combined with the necessity to extend shelf life, reduce food waste, and ensure product safety during global distribution, continues to shape market dynamics. The adoption of advanced technologies, including high-pressure processing and controlled atmosphere packaging, enables manufacturers to reduce chemical preservative usage while maintaining product integrity.
Key Report Takeaways
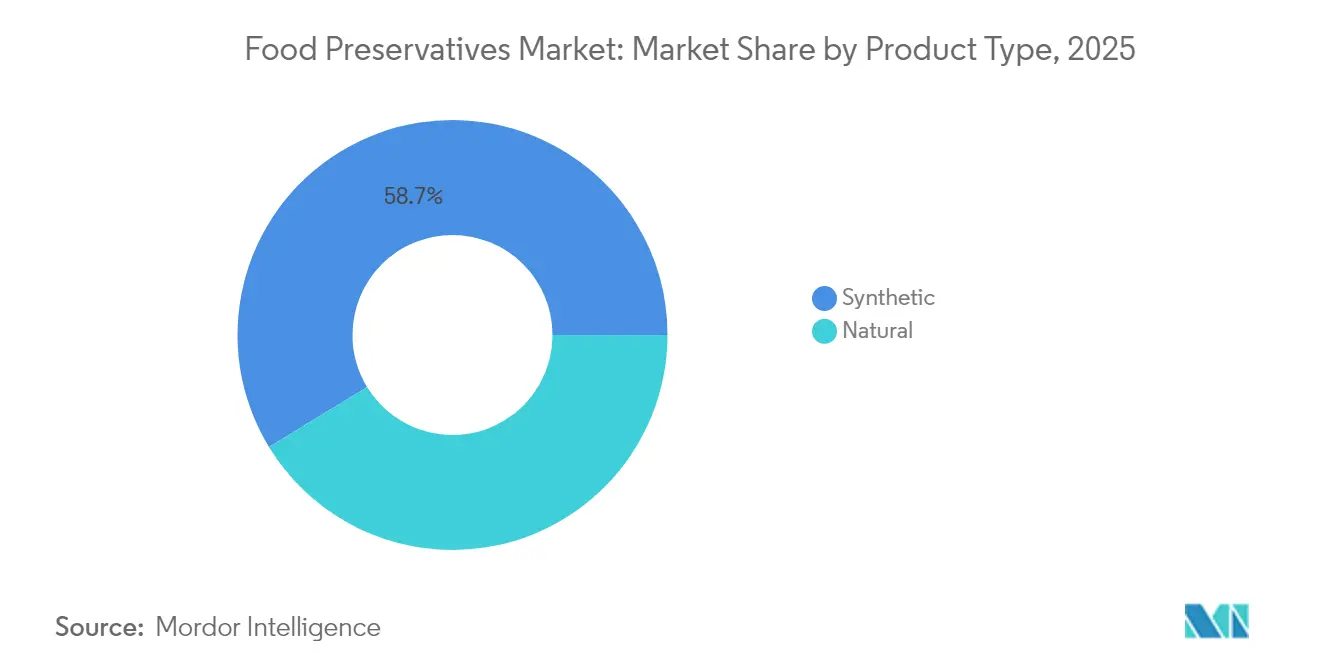
- By type, synthetic preservatives led with 58.72% of food preservatives market share in 2025, while the natural segment is projected to expand at a 7.38% CAGR through 2031.
- By function, antimicrobials accounted for 56.85% of the food preservatives market size in 2025; antioxidants are set to grow at a 6.33% CAGR to 2031.
- By form, dry/granular formats commanded 60.55% share of the food preservatives market size in 2025, whereas liquid systems are forecast to post a 6.54% CAGR.
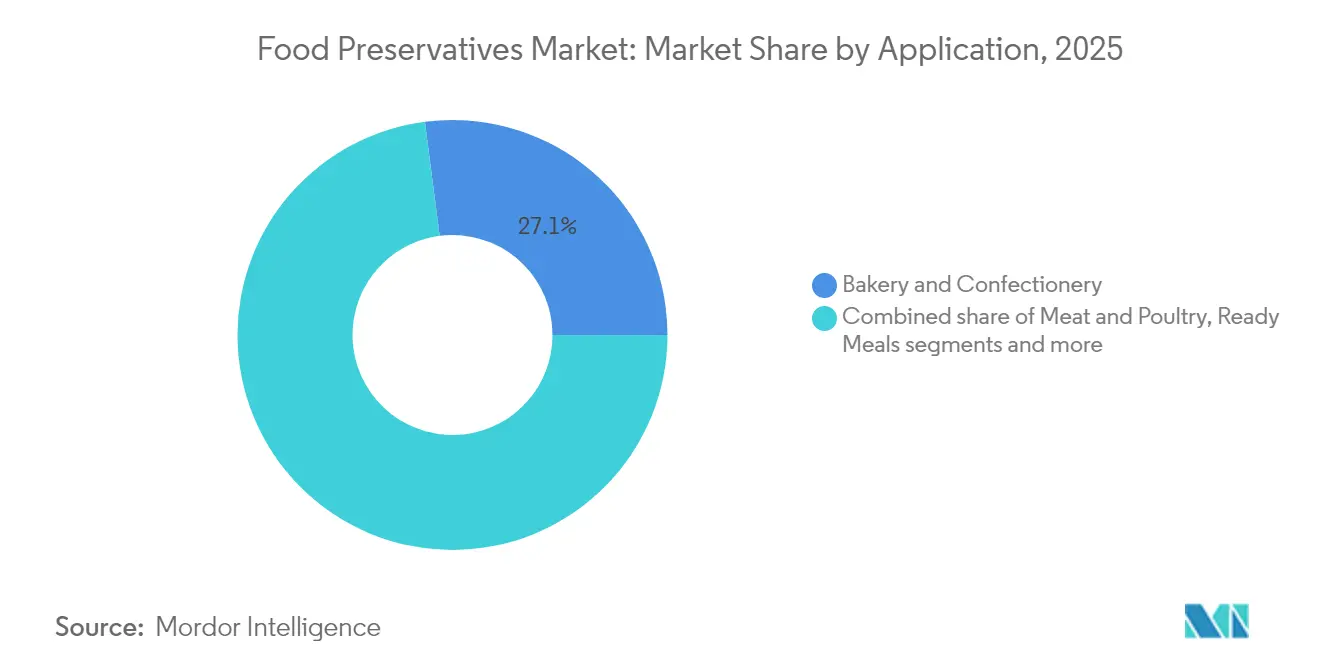
- By application, bakery and confectionery captured 27.05% of the food preservatives market share in 2025, and ready meals are advancing at an 8.54% CAGR through 2031.
- By geography, North America retained the largest position with a 31.05% share in 2025; the Middle East and Africa region is projected to rise at a 7.16% CAGR.
Note: Market size and forecast figures in this report are generated using Mordor Intelligence’s proprietary estimation framework, updated with the latest available data and insights as of 2026.
Market Trends and Insights
Drivers Impact Analysis of Food Preservatives Market*
| Driver | (~) % Impact on CAGR Forecast | Geographic Relevance | Impact Timeline |
|---|---|---|---|
| Consumer preference for processed food products | +1.2% | Global, with concentration in North America and Europe | Medium term (2-4 years) |
| Demand for convenient foods with extended shelf Life | +0.9% | Global, accelerated in Asia-Pacific urban centers | Short term (≤ 2 years) |
| Fueling demand for organic food products | +0.8% | North America and European Union primary, expanding to Asia-Pacific | Long term (≥ 4 years) |
| Advancement in food preservation technologies | +0.7% | Global, led by North America and the Europe, Research and Development hubs | Medium term (2-4 years) |
| Urbanization and changing lifestyles | +0.6% | Asia-Pacific core, spill-over to Middle East and Africa and Latin America | Long term (≥ 4 years) |
| Research and development investment | +0.5% | North America and Europe, emerging in China | Medium term (2-4 years) |
| Source: Mordor Intelligence | |||
Consumer Preference for Processed Food Products
The global food preservatives market demonstrates significant growth, primarily driven by sustained consumer demand for processed food products. The acceleration in urbanization and increasingly demanding lifestyles has generated substantial demand for convenient, ready-to-eat, and easy-to-prepare food options. Processed foods necessitate extended shelf lives and stability during storage and transportation, making preservatives fundamental for maintaining food safety, taste, and quality. The proliferation of dual-income households and single-person households has substantially contributed to the increased consumption of packaged and processed foods, as these products deliver efficient solutions while maintaining variety and nutritional value. According to the International Food Information Council (IFIC), in 2024, 79% of adults in the United States considered the processing level of food and beverages when making purchase decisions [1]Source: International Food Information Council, “2024 IFIC Food and Health Survey,”foodinsight.org . This market dynamic illustrates that while consumers prioritize the convenience of processed foods, their growing awareness of food processing methods and ingredients continues to shape the food preservatives market landscape.
Demand for Convenient Foods with Extended Shelf Life
The demand for convenient foods with extended shelf life significantly influences the food preservatives market growth. Modern lifestyles, rapid urbanization, and increasing dual-income and single-person households have fundamentally transformed dietary preferences toward ready-to-eat, packaged, and minimally processed products. Consumers increasingly prioritize foods that offer quick preparation while maintaining optimal freshness and safety over extended periods, compelling manufacturers to incorporate both synthetic and natural preservatives. Furthermore, the substantial expansion of global retail networks and the accelerated growth of e-commerce platforms have intensified the requirement for shelf-stable products, as food items must maintain consistent quality throughout extended supply chains. This continuous evolution in consumer preferences and distribution channels underscores the critical importance of preservatives in the global food industry, positioning the market for sustained growth in the forecast period.
Fueling Demand for Organic Food Products
The increasing consumer preference for organic food products is driving growth in the global food preservatives market, particularly for natural and bio-based preservation solutions. This shift stems from heightened health consciousness, environmental awareness, and concerns about artificial additives in food. Consumers seek products they perceive as safer and minimally processed, prompting manufacturers to incorporate natural preservatives such as vinegar, nisin, and rosemary extract. Organic foods, which contain fewer synthetic additives and higher moisture content, are more susceptible to microbial spoilage, making effective natural preservation essential for safety and shelf stability. The United States organic market demonstrates this trend, reaching USD 71.6 billion in 2024, with a 5.2% year-over-year growth, according to the Organic Trade Association [2]Source: Organic Trade Association, “Growth of U.S. Organic Marketplace Accelerated in 2024,”ota.com. This growth indicates both consumer acceptance of health-oriented food products and the increased scale of organic food production and distribution.
Advancement in Food Preservation Technologies
Food preservation technology increasingly adopts biomimetic approaches that replicate natural preservation mechanisms for industrial use. Precision fermentation enables the production of natural preservatives, including organic acids and antimicrobial peptides, with consistent quality and efficiency. Nanotechnology in food preservation develops controlled-release systems that enhance preservative effectiveness while reducing sensory impact. Advanced packaging systems integrate with preservation methods to respond to environmental conditions, extending product shelf life and reducing preservative content. The integration of artificial intelligence enables data-driven preservation strategies that match preservatives to specific product formulations and distribution needs. These technological developments help balance preservation effectiveness, cost, and consumer acceptance, creating new opportunities in the preservation market.
Restraints Impact Analysis of Food Preservatives Market*
| Restraint | (~) % Impact on CAGR Forecast | Geographic Relevance | Impact Timeline |
|---|---|---|---|
| Stringent government regulations regarding the use of synthetic preservatives | -0.8% | Global, most restrictive in European and North America | Short term (≤ 2 years) |
| Rising health concerns drive shift away from chemical preservatives | -0.6% | North America and European Union primary, expanding globally | Medium term (2-4 years) |
| Cost constraints and supply chain challenges in natural preservative adoption | -0.5% | Global, acute in emerging markets | Short term (≤ 2 years) |
| The limited shelf life of natural preservatives | -0.4% | Global, particularly challenging in hot climates | Long term (≥ 4 years) |
| Source: Mordor Intelligence | |||
Stringent Government Regulations Regarding the Use of Synthetic Preservatives
Stringent regulatory frameworks governing synthetic preservatives pose a significant impediment to the global food preservatives market expansion. Intensifying scrutiny from regulatory authorities and heightened consumer awareness compel food manufacturers to systematically reduce or eliminate artificial additives from their product formulations. The United States Food and Drug Administration (FDA), European Food Safety Authority (EFSA), and other national regulatory bodies enforce comprehensive restrictions through stringent usage limitations, mandatory labeling protocols, and systematic safety evaluations for synthetic preservatives, including sodium benzoate, potassium sorbate, nitrates, and sulfites. These regulatory measures, implemented to address critical health concerns such as allergic reactions, hyperactivity, carcinogenicity, and other adverse long-term health implications, constitute a substantial market restraint that fundamentally challenges the growth trajectory of the food preservatives industry.
Rising Health Concerns Drive Shift Away from Chemical Preservatives
The global food preservatives market encounters substantial limitations attributed to heightened consumer health consciousness regarding chemical and synthetic preservatives. The market experiences significant constraints as consumer preferences demonstrate a pronounced transition toward products perceived as healthier and more natural, consequently increasing demand for clean-label and chemical-free food products. This market impediment is validated by the International Food Information Council (IFIC) data, which indicates that 24% of United States consumers in 2024 systematically analyze food labels to confirm products are devoid of chemical additives, representing a substantial market segment actively avoiding artificial preservatives. As a direct consequence, food manufacturers face intensified pressure to reformulate their product compositions, requiring the substitution of synthetic preservatives with natural alternatives derived from plant extracts, herbs, and fermentation by-products.
*Our forecasts treat driver/restraint impacts as directional, not additive. The impact forecasts reflect baseline growth, mix effects, and variable interactions.
Food Preservatives Market Segment Analysis
By Type:
Natural Segment Disrupts Synthetic DominanceIn 2025, synthetic preservatives dominated the global food preservatives market with a 58.72% share, reflecting their efficacy, reliability, and cost-effectiveness in high-volume food processing. Sorbates, benzoates, and propionates remain essential synthetic preservatives, providing antimicrobial protection for baked goods, beverages, dairy, and processed meats. These preservatives demonstrate superior performance in challenging conditions, including high-pH products, extended shelf-life requirements, and complex distribution chains with variable temperature conditions. The cost-effectiveness and standardization capabilities of synthetic preservatives make them essential for large-scale producers managing extended supply chains.
The natural preservatives segment projects a 7.38% CAGR through 2031, driven by regulatory developments and consumer preferences. Consumer demand for clean-label products with recognizable ingredients has prompted manufacturers to adapt their formulations. Natural options, including nisin, natamycin, vinegar, rosemary extract, and mixed tocopherols, are increasing in popularity due to their minimal processing and compatibility with organic and non-GMO products. The European Food Safety Authority (EFSA) has supported this trend by increasing the acceptable daily intake (ADI) of nisin from 0.13 mg to 1 mg per kilo of body weight and expanding its approved use in unripened cheese and heat-treated meat products.



By Function:
Antimicrobials Lead Amid Safety ImperativesIn the food preservatives market, antimicrobials maintain a dominant position with 56.85% market share in 2025, primarily attributed to heightened food safety requirements following global supply chain disruptions and foodborne illness incidents. The antimicrobial segment encompasses both synthetic and natural preservation solutions, ranging from established sodium benzoate applications to advanced bacteriocin technologies that deliver targeted microbial control. The implementation of precision fermentation technology facilitates the production of antimicrobial peptides, offering enhanced pathogen specificity while maintaining product integrity.
The antioxidant segment demonstrates superior market growth at 6.33% CAGR, driven by increased industry recognition of oxidation prevention in maintaining nutritional integrity and product stability. Antioxidants fulfill dual market requirements in preservation efficacy and nutritional value enhancement, enabling manufacturers to implement strategic premium pricing for natural preservation alternatives. Mixed tocopherols and rosemary extracts maintain market leadership in natural antioxidant applications, supported by established consumer acceptance and comprehensive regulatory compliance across global markets.
By Form:
Liquid Segment Gains Processing AdvantagesDry/granular preservatives maintain a dominant position with 60.55% market share in 2025, attributed to their superior handling characteristics, storage stability, and well-established manufacturing processes. These solid preservation systems demonstrate significant market penetration in high-volume food applications where precise dosing and uniform distribution are essential, particularly in baking and snack food production, where moisture control is paramount. The dry segment's market leadership is reinforced by existing manufacturing infrastructure, operational efficiency, and the economic advantages of concentrated preservation systems, contributing to sustained market growth.
The food preservatives market demonstrates robust growth dynamics, with the liquid segment recording a 6.54% CAGR, primarily driven by advanced processing capabilities, including enhanced dispersion, reduced dust exposure, and superior automation compatibility. These preservation systems facilitate precise application and seamless integration with continuous processing operations, particularly in beverage and sauce manufacturing, where uniform distribution is crucial. The segment's expansion correlates with the increasing adoption of natural preservatives, as plant extracts and fermentation-derived compounds demonstrate optimal performance in liquid formulations.
By Application:
Ready Meals Segment AcceleratesBakery and confectionery applications hold a 27.05% market share in 2025, as these products require advanced preservation technologies to maintain quality, extend shelf life, and ensure food safety across distribution channels. The segment's preservation needs include moisture control, mold inhibition, and oxidation prevention, necessitating multifunctional preservation systems. While calcium propionate and sorbic acid derivatives remain primary preservatives, the growing consumer preference for clean-label products has increased the adoption of natural alternatives, such as vinegar-based systems and plant extracts.
Ready meals emerge as the fastest-growing application segment with an 8.54% CAGR, supported by urbanization and changing lifestyles that emphasize convenience without sacrificing quality. This segment requires preservation systems that maintain sensory qualities and nutritional value during refrigerated storage while ensuring microbiological safety across diverse ingredient combinations. Natural preservation developments include integrated systems combining plant extracts with modified atmosphere packaging to extend shelf life while maintaining clean label status. The segment's growth reflects the increasing demand for prepared foods that need advanced preservation methods to meet convenience, quality, and safety requirements in global distribution.
Geography Analysis
North America Food Preservatives Market
North America holds a dominant 31.05% market share in 2025, driven by strict regulatory frameworks that promote advancements in preservation technologies. The well-developed food manufacturing sector and established supply chains in North America require effective preservation systems to maintain food safety and shelf stability across extensive distribution networks. The market's strength is further supported by increasing consumer demand for processed and packaged foods that offer convenience and longer shelf life. According to the Academy of Nutrition and Dietetics, more than 60% of foods purchased by Americans in 2023 contained technical additives, including preservatives . This high percentage reflects both the widespread use of preservatives in the United States food system and consumer acceptance of these ingredients.
Europe and APAC Food Preservatives Market
Europe maintains a significant market presence through its regulatory leadership, which shapes global preservation technology trends. The European Food Safety Authority's updated regulations on food additives are driving innovation in natural preservation alternatives. The Asia-Pacific region experiences growth through urbanization, population expansion, rising disposable incomes, and rapid development of the packaged food sector. Countries including China, India, Indonesia, and Vietnam undergo significant demographic and economic changes, resulting in consumer lifestyle shifts toward convenience, processed, and ready-to-eat food products, increasing demand for effective preservation solutions.
MEA Food Preservatives Market
Middle East and Africa emerge as the fastest-growing regions at 7.16% CAGR, driven by rapid urbanization, expanding middle-class populations, and increasing food safety awareness. The regions' growth reflects economic development patterns that increase processed food consumption while raising quality expectations, creating sustained demand for preservation technologies that balance efficacy, cost, and consumer acceptance across diverse markets.


Regulatory Landscape
Food preservatives operate under additive positive-list systems and ongoing safety surveillance led by regulators such as the US Food and Drug Administration (FDA) and the European Food Safety Authority (EFSA), with enforcement supported by detailed use conditions and labeling requirements for substances including benzoates, sorbates, nitrates, and sulfites. In May 2026, the FDA finalized an Enhanced Systematic Process for Post-Market Assessment of Chemicals in Food and initiated reassessments of butylated hydroxytoluene (BHT) and azodicarbonamide (ADA), which raises compliance and documentation requirements for legacy synthetic additives in reformulation-heavy categories.
Across Asia, updates have tightened and harmonized permitted-use frameworks, affecting both domestic formulations and import compliance. China implemented GB 2760-2024 (from February 2025) governing food additive use, while Hong Kong commenced the Preservatives in Food (Amendment) Regulation 2024 in December 2024, updating permitted lists and aligning with Codex Alimentarius with a transitional period ending December 29, 2026. In Europe, the re-evaluation program for additives approved before 2009 continues to advance under Regulation (EC) No 1333/2008, and the EU also updated related compliance requirements through changes such as Regulation (EU) 2025/2058 and Regulation (EU) 2026/245 affecting conditions tied to food use and packaging interfaces.
Value Chain Analysis
The value chain spans upstream feedstocks and bio-based inputs (petrochemical intermediates and fermentation substrates), conversion into preservation actives (antimicrobials and antioxidants across synthetic and natural systems), formulation and blending into dry or liquid ingredient systems, and downstream distribution through global ingredient distributors and direct supply to food manufacturers. Demand is concentrated across bakery and confectionery, meat and poultry, ready meals, snacks, sauces and dressings, and edible oils. Scale advantages and consistent quality are critical in synthetic preservatives, where products such as standardized sorbates and benzoates support high-volume processing, while natural preservatives require additional complexity around botanical and fermentation sourcing, extraction, and stability management.
Midstream and downstream operations increasingly reflect traceability and regulatory reporting expectations. This includes the EU additive framework under Regulation (EC) No 1333/2008 and the US FDA Food Safety Modernization Act (FSMA) environment, alongside EFSA reporting guidance for additive use-level data. Capacity and localization initiatives also shape supply assurance, such as Galactic commissioning a new production line at its Guzhen, China site in May 2025 to increase capacity for preservative powders. As clean-label reformulation expands, suppliers are pairing application labs and digital tools with packaging-linked hurdle approaches (including controlled atmosphere packaging and high-pressure processing compatibility) to deliver performance with lower chemical loadings and to shorten customer qualification timelines.
Competitive Landscape
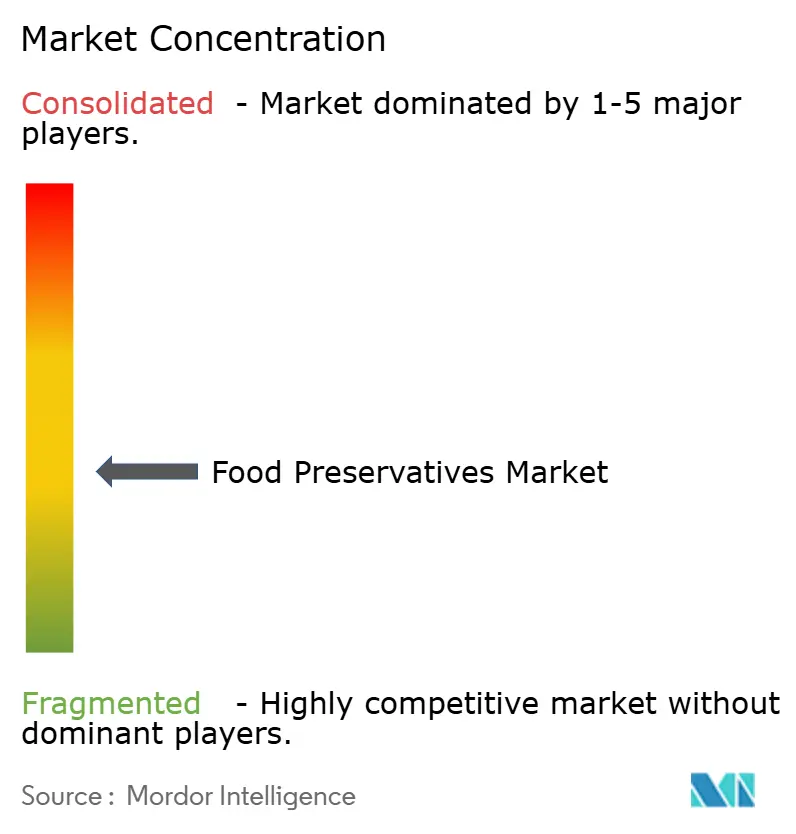
The food preservatives market is moderately fragmented, an environment where established chemical manufacturers and biotechnology firms compete through technological differentiation. The market's fragmentation results from diverse preservation requirements across food categories, geographic regions, and regulatory frameworks, creating distinct market segments for specialized preservation solutions. Major companies such as Corbion N.V., Givaudan S.A., Kerry Group plc, and DSM-Firmenich AG leverage their economies of scale and vertically integrated supply chains to maintain market positions.
The competitive dynamics demonstrate a clear segmentation between large-scale manufacturers focusing on traditional preservation methods and emerging companies specializing in natural preservation technologies. These emerging firms target specific market applications that require innovative solutions, particularly in clean-label and natural preservation segments. This market structure enables multiple players to maintain profitable operations while serving distinct customer needs and regulatory requirements.
Companies are implementing strategic vertical integration and technology acquisition initiatives to strengthen their control over preservation technology platforms and secure consistent access to natural raw materials. The competitive focus has evolved toward developing comprehensive preservation solutions that address multiple challenges simultaneously. Market participants are directing investments toward advanced technologies, including precision fermentation, encapsulation systems, and integrated preservation methods, establishing competitive advantages that extend beyond conventional price and performance metrics.
Food Preservatives Industry Leaders
Corbion N.V.
Givaudan S.A.
Kerry Group plc
DSM-Firmenich AG
Ita Food Improvers
- *Disclaimer: Major Players sorted in no particular order
Food Preservatives Market Companies Covered in this Report
- Corbion N.V.
- Givaudan S.A.
- Kerry Group plc
- Ita Food Improvers
- DSM-Firmenich AG
- Redox Industries Ltd.
- Rejoice Life Ingredients
- BASF SE
- Tate & Lyle plc
- Brenntag SE
- Hawkins Watts Limited
- Celanese Corporation
- Jungbunzlauer Suisse AG
- Eastman Chemical Company
- Amerex Ingredients
- Handary S.A.
- Amtech Biotech Co.,Ltd.
- Hemadri Chemicals
- Prakash Chemicals International Private Limited
- Matangi Industries LLP

Market Opportunities and Future Outlook
The clearest opportunity sits at the intersection of tighter oversight of legacy chemicals and ongoing clean-label reformulation work, which keeps demand focused on ingredient systems that can replace or reduce traditional synthetics while sustaining sensory and shelf-life performance. In May 2026, the FDA initiated reassessments of BHT and ADA under its finalized post-market assessment process, reinforcing the commercial need for alternative antioxidant and dough-improver solutions, along with documented safety and use-condition support across customer portfolios.
Capability build-outs in 2026 also show where suppliers are positioning to serve reformulation requirements and higher-value blends. ADM completed a USD 26 million investment at its Erlanger, Kentucky flavor campus (January 2026) to expand capacity and digitalization for clean-label reformulation, and dsm-firmenich completed a USD 10 million modernization at its Schenectady, New York premix facility (March 2026) to improve GMP zoning and material handling for additive and premix blends. Technical work on fermentation-derived and bio-based preservative pathways is expanding alongside industry efforts to pair natural actives with process and packaging technologies, targeting shelf-life and food-waste reduction pressures across long distribution chains.
Recent Industry Developments in Food Preservatives Market
- May 2026: The US FDA finalized its Enhanced Systematic Process for Post-Market Assessment of Chemicals in Food and initiated reassessments of butylated hydroxytoluene (BHT) and azodicarbonamide (ADA). The move raises the bar for data, documentation, and portfolio risk management around established additives, pushing suppliers and food manufacturers to prioritize reformulation-ready preservation and antioxidant systems.
- December 2025: Givaudan highlighted synergistic natural shelf-life and sensory solution concepts combining botanical extracts with flavoring technologies during Fi Europe 2025. This reinforces the shift toward multi-functional ingredient systems where preservation performance is designed alongside taste and label simplification for processed foods.
- October 2024: Amerex launched Biamex FP to extend commercial shelf life for products nearing best-before dates, positioned for protection against Listeria and heterofermentation. The launch adds competitive intensity in natural antimicrobial preservation offerings tailored to safety-driven applications in ready-to-eat and other perishables.


Food Preservatives Market Report Scope and Research Methodology
Market Definition and Coverage
For this study, the food preservatives market is defined as the value of preservative ingredients sold for use in food and beverage formulations to slow spoilage and maintain quality and safety, across natural and synthetic options.
Scope exclusions: We exclude packaging solutions, processing equipment, and cold chain services, even if they contribute to shelf-life extension.
Segments Covered in This Report
- By Product Type
- Synthetic
- Sorbates
- Benzonates
- Propionates
- Others
- Natural
- Nisin
- Natamycin
- Vinegar
- Rosemary Extract
- Mixed Tocopherols
- Others
- Synthetic
- By Function
- Antimicrobials
- Antioxidants
- By Form
- Dry/Granular
- Liquid
- By Application
- Bakery and Confectionery
- Meat and Poultry
- Ready Meals
- Sweet and Savory Snacks
- Sauces and Dressings
- Edible Oils
- Other Applications
- By Geography
- North America
- United States
- Canada
- Mexico
- Rest of North America
- Europe
- Germany
- United Kingdom
- Italy
- France
- Spain
- Netherlands
- Poland
- Belgium
- Sweden
- Rest of Europe
- Asia-Pacific
- China
- India
- Japan
- Australia
- Indonesia
- South Korea
- Thailand
- Singapore
- Rest of Asia-Pacific
- South America
- Brazil
- Argentina
- Colombia
- Chile
- Peru
- Rest of South America
- Middle East and Africa
- South Africa
- Saudi Arabia
- United Arab Emirates
- Nigeria
- Egypt
- Morocco
- Turkey
- Rest of Middle East and Africa
- North America
Data Sources, Market Sizing, and Validation
Desk Research
Desk research was used to set the base context on food production, processed food trade flows, and the regulatory boundary for what can be sold and labeled as a preservative. We relied on public sources such as food additive regulations and notices from the US FDA and EFSA, Codex Alimentarius standards, FAOSTAT production series, and UN Comtrade trade statistics for relevant food categories.
In parallel, we reviewed investor presentations and annual reports of ingredient suppliers, association publications, and reputable business press to understand application mix and pricing direction. For cross-checking company scale and key developments, we used paid subscriptions that aggregate company financials and track news, and we also referenced patent databases to spot innovation activity that can shift adoption in antimicrobials and antioxidants. The desk sources listed here are illustrative only, and other public and paid sources were used for data collection, validation, and clarification.
Primary Interviews and Surveys
Primary work focused on validating what portion of preservative demand is tied to packaged and processed foods, and how customers choose between natural and synthetic options based on cost, label claims, and regional rules. We spoke with a mix of ingredient suppliers, formulators, distributors, and food manufacturers across major consuming and producing regions, and then used the inputs to confirm assumptions that were unclear in public data. Where responses diverged, follow-ups were used to pin down the driver, such as application-level dosage norms or near-term price movements.
Distribution of primary research fieldwork respondents
| Company type | Respondent position | Region |
|---|---|---|
| Top tier: 28% | CXOs: 15% | APAC: 50% |
| Mid tier: 53% | Functional/Unit leaders: 42% | EMEA: 31% |
| Smaller Players: 19% | Managers: 43% | Americas: 19% |
Market-Sizing & Forecasting
Sizing was built using both top-down and bottom-up logic, with the main build coming from a top-down demand pool reconstructed from processed food output, trade intensity, and preservative penetration by application. Once the application pools were formed, typical inclusion rates and price bands were applied by function and form, and then totals were rolled up to regional and global values.
To keep the model grounded, we tracked several market fingerprints as inputs, including packaged and ready-meal production trends, bakery and confectionery output direction, meat and poultry processing volumes, edible oils processing growth, and the shift in label preference toward natural solutions. Pricing and mix assumptions were adjusted using interview feedback on contract reset timing and the difference between dry and liquid formats, and gaps in bottom-up checks were handled by using sampled company revenue shares and channel checks to avoid overcounting.
For forecasting, scenario analysis was used so near-term demand can respond to changes in processed food growth, regulatory tightening on specific preservative chemistries, and expected price normalization after input cost swings. Final numbers were corroborated with selective bottom-up approximations, such as sampled average selling price times estimated volume for key applications, and then corrected where the two views did not align.
Data Validation & Update Cycle
Outputs were validated through triangulation across demand indicators, supplier-side signals, and expert feedback, followed by checks for unusual jumps at region and application levels. If a segment result moved faster than its linked driver, the assumption set was reviewed and a call-back was triggered to confirm whether the change was real or modeling noise.
Before sign-off, the work is reviewed in steps, starting with analyst peer checks on inputs and formulas and followed by a final consistency check against independent markers like trade flows and processed food output growth. Reports are refreshed annually, and interim updates are made when a material event occurs, such as a meaningful regulatory change or a sharp price shock. Right before delivery, a fresh pass is done so clients receive the most current view.
Mordor Intelligence's Food Preservatives Market Estimate Compared With Other Published Estimates
Published market sizes for food preservatives can differ even when the topic name looks the same, because each study can draw the boundary differently around what counts as preservative revenue and how the application mix is built. Differences also come from the anchor year used, how prices are converted into USD, and how quickly assumptions are refreshed.
Trade-linked processed food volumes, additive regulatory lists, and interview-confirmed usage rates are the checks that keep Mordor Intelligence's 2026 estimate tied to preservative ingredient demand inside food and beverage formulations, rather than adjacent shelf-life solutions. In practice, the biggest gaps usually come from scope choices, for example whether pet food, feed, or broader preservative chemicals are blended into the market total, and from pricing logic where some models apply a single blended price without separating dry versus liquid forms across applications.
Benchmark comparison
| Source | Market Size | Gaps in Research Methodology |
|---|---|---|
| Mordor Intelligence | USD 3.81 B (2026) | |
| Industry Publisher A | USD 3.32 B (2025) | Uses a 2025 base year and a longer forecast window, and the page-level scope summary suggests broader inclusion across applications without clearly separating form-driven price differences, which can pull the starting value down. |
| Market Platform B | USD 3.30 B (2024) | Anchors the market in 2024 and can include a wider function bucket and application list in one roll-up, and the conversion of mixed regional prices into USD for the base year is not clearly tied to contract reset timing. |
Across the three figures, the spread is mainly explained by anchor-year choice and how each source treats pricing and boundary items around food and beverage use. By keeping the model traceable to demand signals and application-level assumptions that can be rechecked, the estimate stays practical to reproduce and update when new evidence appears.


Key Questions Answered in the Report
What is the current size of the food preservatives market?
The market stands at USD 3.81 billion in 2026 and is projected to reach USD 4.87 billion by 2031, growing at a 5.01% CAGR.
Which preservative type is growing fastest?
Natural preservatives lead growth with a 7.38% CAGR as regulators and consumers favor plant- and fermentation-derived solutions.
Why are antimicrobials the largest functional category?
Food-safety imperatives make broad-spectrum antimicrobials indispensable, resulting in 56.85% of 2025 revenue.
Which region offers the greatest growth potential?
The Middle East and Africa shows the fastest regional CAGR at 7.16%, driven by new processing investments and high ambient temperatures that magnify shelf-life needs.
Page last updated on:





