
Market Overview
| Study Period | 2021 - 2031 |
|---|---|
| Forecast Data Period | 2026 - 2031 |
| Base Year Market Size (2025) | USD 1.09 Billion |
| Market Size (2026) | USD 1.16 Billion |
| Market Size (2031) | USD 1.58 Billion |
| Growth Rate (2026 - 2031) | 6.33 % |
| Market Concentration | Medium |
Major Players *Disclaimer: Major Players sorted in no particular order Image © Mordor Intelligence. Reuse requires attribution under CC BY 4.0. | |
Asia-Pacific Food Preservatives Market Analysis by Mordor Intelligence
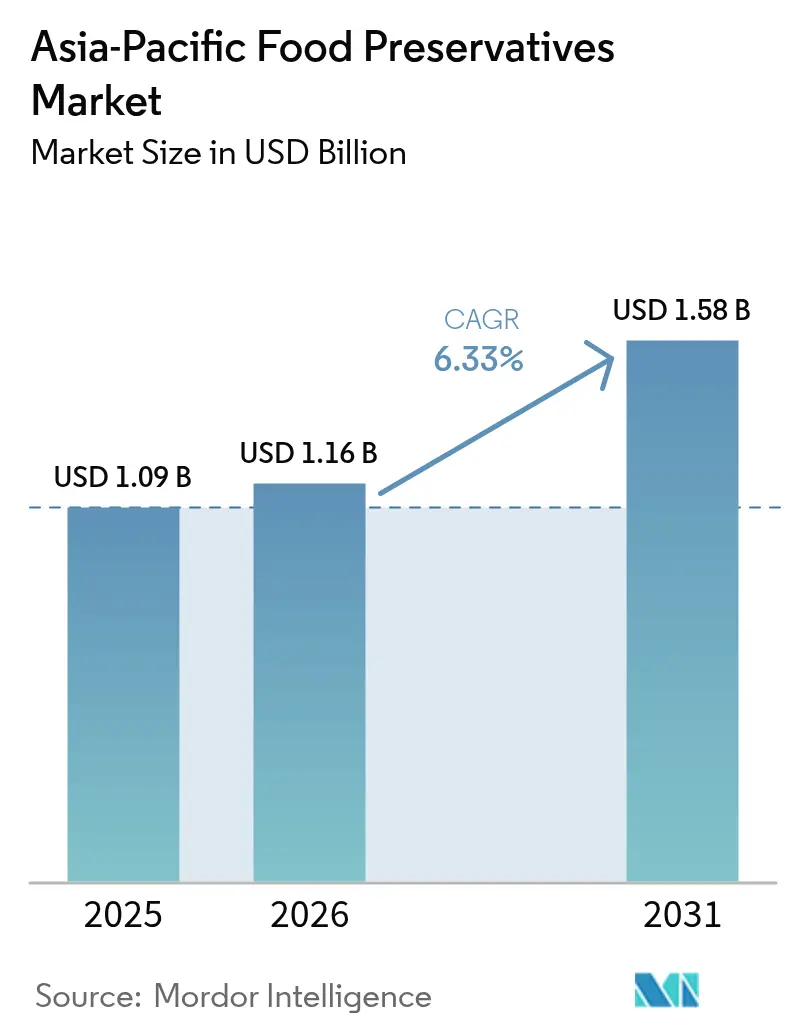
The Asia-Pacific Food Preservatives market size is expected to grow from USD 1.09 billion in 2025 to USD 1.16 billion in 2026 and is forecast to reach USD 1.58 billion by 2031 at 6.33% CAGR over 2026-2031. Growing urban populations, tight retail logistics, and the rapid rise of ready-to-eat formats are amplifying demand for longer shelf life across every major product category. Regulatory tightening in China and Japan is accelerating a pivot toward natural antimicrobials, while multinational suppliers localize production to cut freight costs and reduce supply-chain risk. E-commerce grocery growth in core cities, mandatory halal certification in Indonesia, and expanding exports from India together extend the addressable base for both synthetic and biopreservation platforms. Competitive advantage is gradually migrating from raw-material access toward research and development speed, clean-label positioning, and regulatory fluency as authorities update additive lists with greater frequency.
Key Report Takeaways
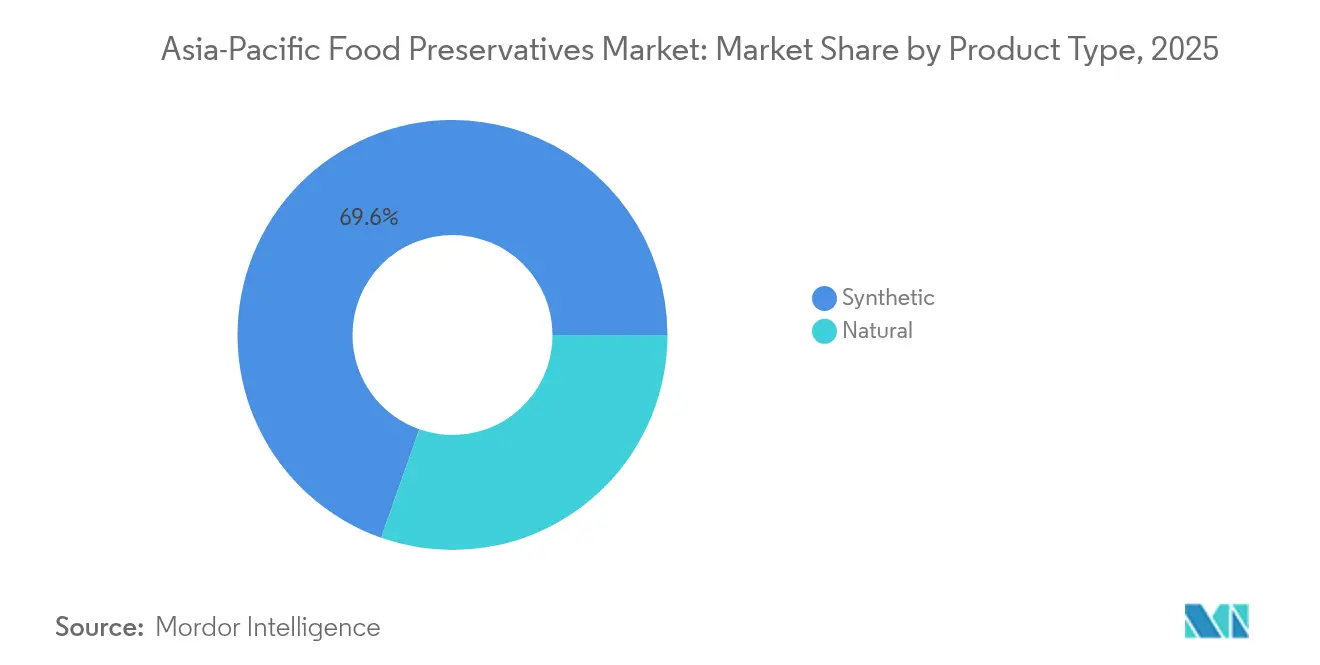
- By product type, synthetic preservatives captured 69.62% of the Asia-Pacific Food Preservatives market share in 2025, while natural preservatives are projected to grow at an 7.85% CAGR through 2031.
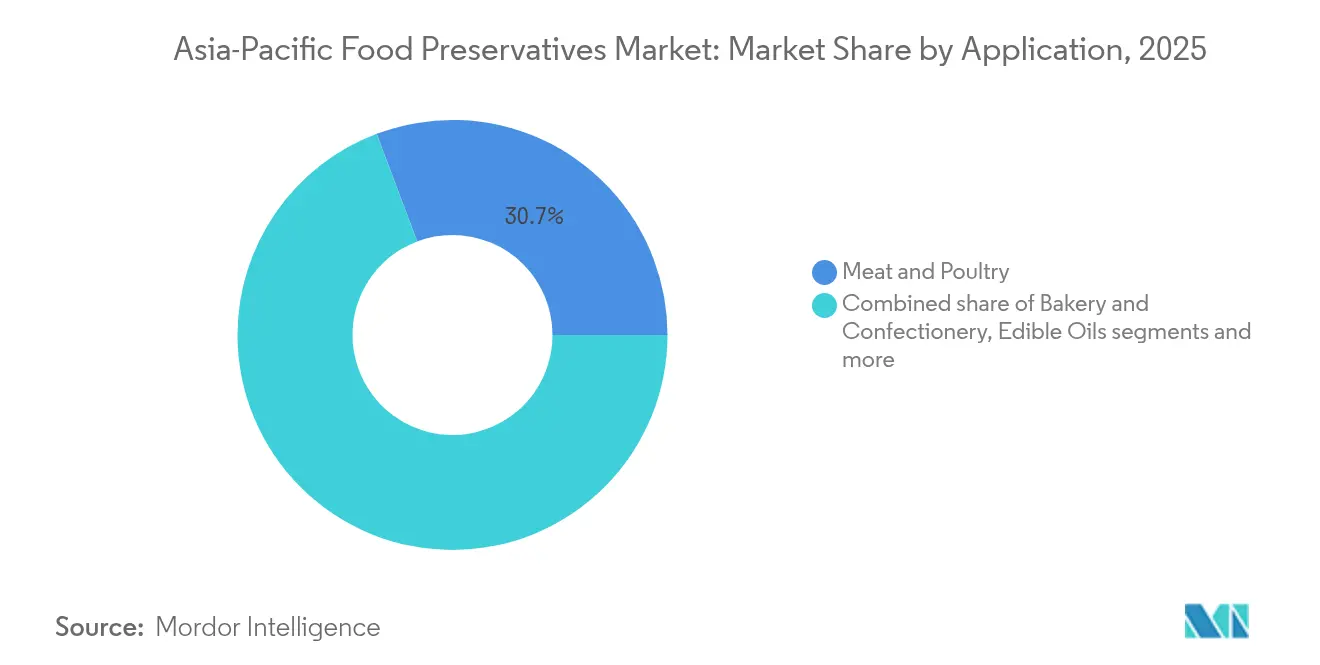
- By application, meat and poultry accounted for a 30.74% share of the Asia-Pacific Food Preservatives market size in 2025, and ready meals are expected to advance at a 6.88% CAGR through 2031.
- By geography, China represented 39.72% of the Asia-Pacific Food Preservatives market size in 2025, while Indonesia is poised to expand at a 7.12% CAGR to 2031.
Note: Market size and forecast figures in this report are generated using Mordor Intelligence’s proprietary estimation framework, updated with the latest available data and insights as of 2026.
Market Trends and Insights
Drivers Impact Analysis of Asia-Pacific Food Preservatives Market*
| Driver | (~) % Impact on CAGR Forecast | Geographic Relevance | Impact Timeline |
|---|---|---|---|
| Rapid growth of processed foods | +1.8% | China, India, Indonesia, Thailand | Medium term (2-4 years) |
| Growth in convenience food sector requiring extended shelf life | +1.5% | China, Japan, South Korea, urban ASEAN | Short term (≤ 2 years) |
| Demand for organic foods needing specialized preservatives | +0.9% | Japan, Australia, urban China, Singapore | Long term (≥ 4 years) |
| Consumer shift toward clean-label and natural preservatives amid health awareness | +1.3% | Regional, strongest in Japan, Australia, urban China | Medium term (2-4 years) |
| Investments in research and development for natural additives | +0.7% | Regional, research and development hubs in China, Japan, Singapore | Long term (≥ 4 years) |
| Rising exports of ready-to-eat products | +0.9% | India, Thailand, Vietnam, China | Medium term (2-4 years) |
| Source: Mordor Intelligence | |||
Rapid growth of processed foods
The rapid expansion of India’s food processing sector is driving significant demand for food preservatives, with increased production throughput and broader distribution networks making shelf life a critical factor for competitiveness. The Indian food processing market, valued at approximately INR 30,49,800 crore (USD 354.5 billion) in 2024, is projected to reach INR 4,584,415 crore (USD 535 billion) by FY26 [1]. This growth necessitates optimized utilization of installed capacity, increasing the volume of products requiring preservation to remain stable across extended supply chains and complex retail channels. The gap between installed capacity and raw material utilization highlights the need for effective preservation to minimize wastage, particularly in categories such as dairy, meat, ready meals, and bakery products. Leading Indian companies, including ITC (Aashirvaad, Sunfeast), Haldiram’s, Amul, and Mother Dairy, are expanding their packaged and frozen product portfolios, which depend on both synthetic and natural preservatives to ensure consistent quality across metropolitan and Tier 2–3 cities. Modern trade and quick-commerce platforms like BigBasket and Blinkit are extending their geographic reach and delivery timelines, prompting brands to adopt more robust preservative systems designed to withstand multiple handling stages and ambient storage conditions. This growth is attracting global and regional co-packers and contract manufacturers adhering to multinational standards, driving the adoption of advanced preservative blends aligned with Asia-Pacific norms. Multinational brands such as Nestlé, PepsiCo, and Mondelez are harmonizing preservative specifications with Southeast Asia and other Asia-Pacific export markets. As product portfolios shift toward premium offerings, including high-protein, fortified, and convenient formats, formulation complexity increases, necessitating precise combinations of antimicrobials and antioxidants. Simultaneously, consumer demand for clean-label products is driving manufacturers to incorporate natural preservatives, creating a shift in the preservative mix rather than reducing overall usage intensity.
Growth in convenience food sector requiring extended shelf life
The growing demand for convenience food and home-delivery services in China and Southeast Asia is driving structural changes in the food preservatives market. Products now require enhanced safety and stability across fragmented cold chains and shorter meal-preparation windows. In China, platforms like Meituan and Ele.me have set consumer expectations for ready-to-heat and ready-to-eat meals that maintain quality throughout complex supply chains, prompting formulators to develop preservative systems that perform across varying temperature and handling conditions. Combination strategies, such as organic acids paired with natural antimicrobials like nisin or natamycin, are increasingly preferred for their ability to ensure microbial stability without compromising sensory attributes or clean-label requirements. Brands like Sanquan in China, known for frozen dumplings and ready dishes, exemplify the need for robust preservative systems that address both frozen logistics and last-mile delivery challenges. This trend extends to refrigerated and ambient formats, such as convenience-store bento meals in Japan and co-branded noodle bowls or rice dishes, where preservatives must complement modified-atmosphere packaging and mild thermal processing. Moreover, in Thailand, government initiatives to boost processed food exports by 2027 are accelerating investments in “Future Food” categories, including plant-based meats and functional beverages [2]. Companies like NR Instant Produce require preservative systems that protect high-protein matrices and nutraceuticals while meeting vegan claims and international regulations. Functional beverages and RTD nutrition drinks, such as Vitasoy’s plant-based offerings, also depend on tailored preservative systems to maintain sensory quality during distribution. Additionally, the expansion of branded retail lines by QSR chains and cloud kitchens in markets like China, South Korea, and Singapore is driving demand for multifunctional preservative systems that harmonize across delivery, in-store, and retail-packaged formats, reflecting the increasing sophistication of preservative design in the region.
Demand for organic foods needing specialized preservatives
The demand for organic and clean-label foods is driving the need for advanced preservative systems that ensure product safety and shelf life while meeting stricter additive regulations. Food Standards Australia New Zealand’s (FSANZ) 2024 approval to expand the use of rosemary extract as a food additive (antioxidant) reflects regulatory recognition of botanically derived antioxidants as effective solutions that align with "natural" and organic claims [3]. This approval is prompting manufacturers in Australia and New Zealand to replace synthetic antioxidants like BHA/BHT with alternatives such as rosemary extract and mixed tocopherols in organic snacks, oils, and ready meals, aligning with clean-label product ranges. Brands like Macro Organic (Woolworths private label) and Sanitarium’s natural-positioned cereals and plant-based products are leveraging these changes to balance oxidation control with consumer-friendly ingredient lists. In Japan, organic-processed food standards under JAS limit chemically synthesized additives, encouraging producers of organic bento, bakery items, and snacks to adopt vinegar, plant extracts, and tocopherols over synthetic preservatives. Japanese brands promoting “mutenka” (no additives) or reduced-additive products, including private labels, are adopting milder, label-friendly preservation methods to maintain microbiological and oxidative stability. Similarly, in Mainland China and India, premium organic and “chemical-free” brands in oils, baby foods, and health snacks are shifting to natural antioxidants and fermentation-derived antimicrobials. These trends are driving global and regional ingredient suppliers to pivot from synthetic preservatives to plant-based solutions, reshaping the market toward higher-value natural preservative systems tailored to organic and clean-label standards.
Rising exports of ready-to-eat products
The increasing export of ready-to-eat products from countries in the Asia-Pacific region is driving the need for advanced preservative systems to ensure product quality during extended sea and air shipments to demanding import markets. In India, exports of products such as sweets, snacks, biscuits, and frozen curries require preservatives like sorbates and natural antioxidants to withstand multi-week transit while meeting strict microbial and quality standards in regions such as the United States, Europe, and the Middle East. Companies like MTR Foods and Bagrry’s are reformulating their offerings with benzoates and rosemary extracts to extend shelf life for supermarket channels in the United States and the United Arab Emirates without compromising authentic flavors. Thailand’s efforts to become a leading processed food exporter by 2027 are fueling investments in ready-to-eat meals, sauces, and plant-based products, which require export-grade preservatives to address cold-chain gaps in destination markets. For instance, Lee Kum Kee’s sauces and meal kits, targeting both domestic growth and exports within the ASEAN region, highlight the importance of antimicrobial blends to prevent spoilage during humid storage and shipping. In China, products such as dim sum, noodles, and frozen appetizers exported to North America and Europe depend on nisin-propionate combinations to maintain safety during extended logistics while avoiding clean-label rejections. Emerging sectors in Indonesia and Vietnam, focusing on dehydrated spices and pouch meals for Middle Eastern markets, are adopting tocopherols and organic acids to manage production-to-port timelines. Japan’s high-end sushi and bento exports to the United States prioritize natamycin and vinegar-based systems to ensure stability under refrigerated conditions. Harmonizing preservative formulations to meet diverse import regulations is essential, driving innovation as brands upgrade systems to ensure compliance, sensory consistency, and competitiveness in global markets.
Restraints Impact Analysis of Asia-Pacific Food Preservatives Market*
| Restraint | (~) % Impact on CAGR Forecast | Geographic Relevance | Impact Timeline |
|---|---|---|---|
| Health hazards linked to synthetic preservatives reducing consumer acceptance | -0.9% | China, Japan, urban ASEAN, Australia | Short term (≤ 2 years) |
| Stringent government regulations on preservative usage and pricing | -1.1% | China, Japan, Australia, New Zealand, India | Medium term (2-4 years) |
| Challenges in developing effective natural preservatives | -0.6% | Regiional | Long term (≥ 4 years) |
| Supply chain and pricing volatility | -0.7% | Indonesia, Vietnam, Thailand, India | Short term (≤ 2 years) |
| Source: Mordor Intelligence | |||
Health hazards linked to synthetic preservatives reducing consumer acceptance
Consumer concerns over health risks associated with synthetic preservatives are driving significant changes in the food preservatives market. Issues such as allergic reactions, hyperactivity in children, and potential long-term effects from additives like benzoates, sorbates, and propionates have led to growing avoidance, particularly among urban millennials and parents who scrutinize product labels. In China, media coverage of preservative-related food scandals has increased demand for "zero additive" claims, prompting brands like Want Want to reformulate by blending lower-dose synthetics with tocopherols or adopting fermentation-derived options to maintain shelf life while meeting consumer expectations. Japan’s strict standards and resistance to "chemical" preservatives have influenced convenience store chains to promote "additive-minimized" products, relying on alternatives like natamycin or vinegar-based methods despite shorter distribution windows. In South Korea, regulatory warnings about synthetic additive overuse have led brands like Ottogi to incorporate rosemary extracts to address consumer concerns while preserving traditional flavor profiles. Indian brands, under pressure from social media campaigns highlighting synthetic residues, are emphasizing natural preservation methods such as mixed tocopherols to balance affordability with health-conscious positioning. Clean-label mandates in Australia and New Zealand have further complicated the use of synthetic preservatives, with brands like Uncle Tobys needing to pair approved synthetics with natural options to meet labeling requirements. In Thailand, rising middle-class demand for clean-eating trends has pushed ready-to-eat brands like Malee to adopt natural preservation methods for export-oriented products. This shift toward natural alternatives is accelerating research and development but also presents challenges due to cost and performance limitations, particularly in humid climates. The evolving landscape reflects a transition from synthetic dominance to hybrid systems as brands address consumer distrust, regulatory scrutiny, and the need to maintain product integrity.
Supply chain and pricing volatility
Stringent regulatory scrutiny in countries such as Japan, Australia, South Korea, and Singapore imposes significant challenges on the introduction and reformulation of synthetic preservatives, requiring manufacturers to navigate prolonged approval processes and incur higher compliance costs. Concurrently, consumer preferences in markets like China, India, Thailand, and Indonesia are increasingly shifting toward clean-label products, pressuring brands to reduce artificial additives despite the limited availability of cost-effective natural alternatives. This creates particular difficulties for price-sensitive manufacturers in populous markets such as India and Indonesia, where balancing affordability with the transition to natural solutions remains a challenge. For example, brands like Gardenia Philippines have introduced shorter-shelf-life product variants to meet clean-label expectations. The reliance on agricultural outputs for natural preservatives adds further complexity, as climatic disruptions in countries like Malaysia and Vietnam impact ingredient availability, leading to supply volatility and heightened cost pressures. These uncertainties discourage small and medium-sized food processors, which are prevalent in Southeast Asia, from adopting premium natural preservatives, resulting in continued reliance on older formulations. Moreover, imported natural preservatives often attract higher duties in markets such as Australia and Japan, increasing input costs and slowing adoption compared to Western markets. The interplay between regulatory caution, evolving consumer preferences, and structural cost challenges creates a cyclical restraint, where brands aiming to innovate face economic and compliance barriers. Even established companies such as CJ Foods in South Korea and Yamazaki Baking in Japan must carefully evaluate shelf-life trade-offs when reducing synthetic preservatives, reflecting the broader regional challenge. In emerging markets across the region, cold-chain limitations further complicate the transition to natural preservatives, as the need for longer shelf life persists despite rising demand for cleaner alternatives. These interconnected factors collectively hinder market transformation and create friction between innovation, regulation, and affordability.
*Our forecasts treat driver/restraint impacts as directional, not additive. The impact forecasts reflect baseline growth, mix effects, and variable interactions.
Asia-Pacific Food Preservatives Market Segment Analysis
By Product Type:
Natural Preservatives Gain Share Despite Synthetic DominanceSynthetic preservatives maintain a dominant position in the food preservatives market, holding approximately 69.62% of the share in 2025. Their widespread use is driven by cost-effectiveness and consistent performance in high-demand categories such as bakery, beverages, and sauces. Sorbates are critical for acidified products like pickles and dressings due to their broad antimicrobial properties at low pH levels. Benzoates are preferred in carbonated drinks and fruit juices for their effectiveness against yeasts and molds in sugar-rich environments. Propionates, particularly calcium and sodium salts, are widely adopted in bakery applications, effectively controlling rope-forming bacteria without altering flavor. Leading brands, such as those in the bakery industry, rely heavily on these preservatives to ensure product quality and extend shelf life across extensive distribution networks. Despite increasing consumer interest in natural and clean-label alternatives, the cost-performance benefits of synthetic preservatives continue to make them the preferred choice for applications requiring long shelf life in high-volume markets.
Natural preservatives are witnessing rapid growth, with an estimated compound annual growth rate of 7.85% through 2031. This growth is supported by rising demand for clean-label products and regulatory limitations on synthetic preservatives in specific categories. Nisin, produced by certain bacterial strains, is widely approved and increasingly used in processed cheese and canned vegetables, with dairy brands expanding its application in innovative products. Natamycin is gaining popularity in fermented dairy and beverage applications, particularly in regions where its use in fermented milks has been approved. Botanical antioxidants, such as rosemary extract and mixed tocopherols derived from vegetable oils, serve as both antioxidants and sources of vitamin E, appealing to health-conscious consumers in premium snack and edible oil categories. Advances in encapsulation and synergistic blend technologies are enhancing the efficacy of natural preservatives, making them essential for portfolio diversification and building consumer trust.

By Application:
Ready Meals Outpace Meat as Convenience Drives ReformulationThe ready meals segment is positioned as a significant growth driver within the food preservatives market, with a projected compound annual growth rate of 6.88% through 2031, outpacing broader market trends. This growth is attributed to the increasing demand for complex, multi-component meals that combine protein, starch, vegetables, and sauces, each requiring distinct preservation solutions. Companies such as House Foods in Japan are addressing the demand for single-serve convenience by employing broad-spectrum antimicrobial systems to manage bacteria, yeasts, and molds, given the varied water activity and pH levels in these meals. The rise in single-person households in Japan and South Korea further supports this trend, as consumers prioritize convenience and portion control over cost. This has driven advancements in preservative blends that ensure microbial safety while aligning with clean-label requirements. Suppliers are responding by offering synergistic solutions that enhance shelf life and sensory quality without compromising label transparency.
The meat and poultry sector accounted for 30.74% of the market share in 2025, underscoring the critical role of preservatives in ensuring pathogen control for high-volume protein products. In Indonesia, government procurement programs focusing on imports from Brazil and India highlight the regional protein supply gap and the need for effective preservatives to maintain the safety of frozen and chilled meat. Processed meat brands, such as Seara in Indonesia, are increasingly incorporating natural compounds like nisin and natamycin to extend shelf life while reducing sodium content from traditional curing salts, catering to health-conscious consumers. Meanwhile, bakery and confectionery segments rely on propionates and sorbates to prevent spoilage, while beverages and dairy segments are innovating with natural preservatives to meet consumer demand for ingredient simplicity and application-specific solutions across the region.
Geography Analysis
China Food Preservatives Market
China accounts for 39.72% of the Asia-Pacific food preservatives market in 2025, reflecting the scale and rapid expansion of its processed food industry. This growth is supported by a robust manufacturing base for bakery products, beverages, sauces, and ready meals, alongside strong domestic consumption and export activity. Companies such as Sanquan Foods exemplify this trend by utilizing preservatives like sorbates and nisin to meet stringent safety standards while managing diverse, high-volume product portfolios. The increasing adoption of modern retail formats and e-commerce by Chinese consumers is further driving demand for preservatives that ensure product freshness across extended supply chains, reinforcing China's critical role in the regional market.
Indonesia Food Preservatives Market
Indonesia is the fastest-growing market in the region, with an expected compound annual growth rate of 7.12% through 2031. This growth is largely influenced by the introduction of mandatory halal certification starting in October 2024, which requires ingredient suppliers and preservative manufacturers to ensure compliance with Islamic dietary laws. This regulatory shift is reshaping product formulations and supply chains. Leading brands such as Sari Roti and Pantai are leveraging halal-compliant preservatives, including propionates and natural extracts, to cater to both domestic and export markets. The competitive landscape, spanning from large corporations to micro-enterprises, is fostering innovation in preservatives to balance efficacy, cost, and halal compliance, enabling manufacturers to meet rising demand while navigating a fragmented manufacturing sector.
Broader APAC Markets
Mature markets like Japan, South Korea, and Australia are driving the adoption of natural preservatives and biopreservation technologies due to clean-label preferences and advanced regulatory frameworks. India’s food processing sector, projected to reach USD 535 billion by 2025-26, offers significant growth opportunities as manufacturers focus on reducing post-harvest losses and expanding exports. Smaller markets, including Thailand, Singapore, and Vietnam, are benefiting from regulatory harmonization within the region, which is attracting investment in plant-based proteins and functional beverages. These products require sophisticated preservative systems that align with clean-label compliance and export-market readiness, shaping a diverse and complex market ecosystem across Asia-Pacific.
Regulatory Landscape
Asia-Pacific preservative regulations are tightening, with regulators moving toward more prescriptive requirements on additive-food pairings, maximum use levels, and labeling. This increases the compliance burden for suppliers serving multi-country portfolios, particularly as authorities update permitted-use conditions for both synthetic systems (including sorbates, benzoates, and propionates) and natural systems (including nisin, natamycin, vinegar, rosemary extract, and mixed tocopherols).
A key inflection point is China’s GB 2760-2024 (National Food Safety Standard for Uses of Food Additives), issued in February 2024 and implemented in February 2025, which reinforces the need for country-specific formulations and documentation. Regulatory updates are also compressing trade and reformulation timelines in import-dependent markets. Hong Kong’s Preservatives in Food (Amendment) Regulation 2024 entered into force on 30 December 2024, with a 24-month transitional period ending 29 December 2026, which creates a defined window for manufacturers to align labeling and permitted-use conditions. Singapore’s Food Regulations were updated as of 29 April 2026, with defined maximum levels for chemical preservatives, while ASEAN’s Annex I on maximum use levels of food additives (April 2026) offers a regional harmonization reference for commonly used preservatives such as acetic acid (INS 260) and calcium acetate (INS 263), supporting exporters standardizing formulations across ASEAN destinations.
Value Chain Analysis
The value chain starts with feedstocks and intermediates for synthetic preservatives, typically petrochemical-derived routes for benzoates and propionates and chemical synthesis pathways for sorbates, alongside agricultural or fermentation inputs for natural systems, such as rosemary and vegetable-oil-derived tocopherols and fermentation-derived antimicrobials including nisin and organic acids. Formulation and blending are increasingly handled through application labs and technical service teams that tailor preservative systems to local processing conditions, packaging formats, and storage realities, especially for ready meals, meat and poultry, and bakery products with fragmented cold chains and long retail logistics.
In distribution, preservatives move through direct contracting with large food manufacturers and through distributors to small and mid-sized processors. Qualification increasingly depends on compliance documentation such as specifications, usage limits, halal status where relevant, and labeling language. The region is also shifting toward a multi-hub manufacturing and service approach to reduce freight risk and speed up customer iterations, reflected in new or expanded Southeast Asia production and application footprints from ingredient and flavor suppliers that frequently co-develop preservation systems with food manufacturers. Supplier selection is increasingly shaped by regulatory change management, traceability, and audit readiness, alongside price and performance, as additive lists and permitted-use matrices are updated more frequently and require rapid reformulation support.
Competitive Landscape
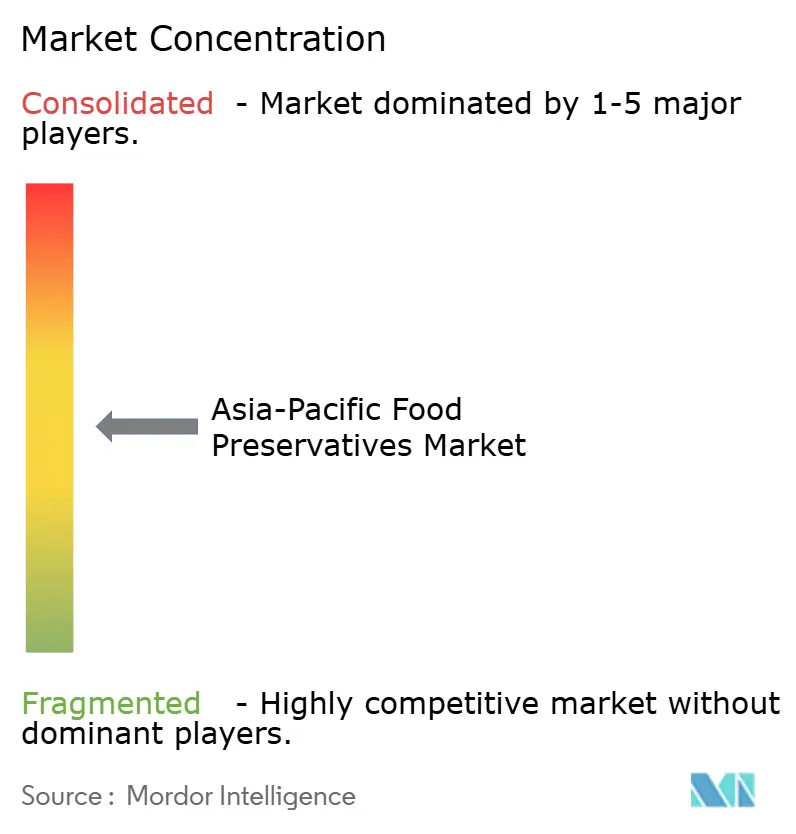
The market for food preservatives in the Asia-Pacific region exhibits moderate fragmentation, characterized by a competitive landscape. This environment features a combination of global ingredient manufacturers and agile regional and biotech firms. Leading multinational companies such as Cargill, Kerry Group, DSM-Firmenich, and Corbion leverage their robust research and development capabilities, regulatory expertise, and extensive product portfolios to meet the demands of large-scale food manufacturers. These companies focus on maintaining quality consistency and regulatory compliance across diverse markets. Their strategies include balancing synthetic and natural preservatives and expanding into high-growth regions such as India and Southeast Asia. For instance, Kerry Group’s investment in fermentation-derived antimicrobials highlights its efforts in vertical integration, enhancing the effectiveness of natural preservatives across various applications. Their global reach and technical expertise position them strongly against regional competitors, driving innovation and adoption in processed food categories.
Regional companies, including Ajinomoto, Fufeng Group, Camlin Fine Sciences, and Hemadri Chemicals, compete by capitalizing on cost advantages, localized market insights, and operational flexibility tailored to small and medium-sized food processors. These firms address specific regional demands by offering cost-effective synthetic preservatives or plant-based extracts while ensuring regulatory compliance. This approach is particularly significant for domestic brands and smaller enterprises in markets such as Indonesia and Vietnam. Ajinomoto’s natural preservative solutions for rice and noodle products exemplify the combination of cost efficiency and technical adaptability. Regional players often address market gaps left by multinational firms, developing hybrid preservative solutions tailored to local climates and consumer preferences. This strategy strengthens their position in fragmented markets where supply chain efficiency and competitive pricing are critical.
Biotech firms are transforming the competitive dynamics by employing advanced fermentation technologies to produce bacteriocins, organic acids, and antimicrobial peptides marketed as fermentation products rather than synthetic additives. These innovations cater to the increasing demand for clean-label products, narrowing the performance gap between synthetic and natural preservatives and intensifying competition. Companies utilizing encapsulation platforms and controlled-release systems, such as Novonesis, enable extended preservative action at lower dosages, supporting clean-label positioning while managing costs. These advancements allow established players to protect their market share through improved formulations and pricing strategies, while emerging firms target premium niches with natural and hybrid preservation solutions. The market continues to evolve, balancing economies of scale with innovation to address the diverse requirements of the food industry in the Asia-Pacific region.
Asia-Pacific Food Preservatives Industry Leaders
-
Cargill Incorporated
-
Kerry Group plc
-
DSM-Firmenich AG
-
Corbion N.V.
-
BASF SE
- *Disclaimer: Major Players sorted in no particular order
Asia-Pacific Food Preservatives Market Companies Covered in this Report
- Cargill Incorporated
- Kerry Group plc
- DSM-Firmenich AG
- International Flavors & Fragrances, Inc.
- Corbion N.V.
- Kemin Industries, Inc.
- Novonesis
- Givaudan SA
- Tate & Lyle plc
- Brenntag AG
- BASF SE
- Ajinomoto Co., Inc.
- Shandong Hongda Group
- Camlin Fine Sciences Ltd.
- Hemadri Chemicals
- Prakash Chemicals International Private Limited
- Matangi Industries LLP
- Fufeng Group Ltd.
- Vedan International Holdings Corp.
- Shandong Freda Biotechnology Co., Ltd.
Market Opportunities and Future Outlook
Clean-label and natural preservation platforms create a space for suppliers to win share by turning regulatory change into practical reformulation support. Australia and New Zealand provide an anchor example, with FSANZ’s 2024 approval expanding the use of rosemary extract as a food additive (antioxidant), which supports substitution programs away from BHA/BHT in categories such as oils, snacks, and ready meals. Separately, innovation pathways are extending beyond traditional botanicals, illustrated by the July 2025 partnership between Novella and Metaphor Foods to commercialize cell-based natural preservatives using AuraCell technology for the Asia-Pacific market, reinforcing momentum toward fermentation-derived and novel bio-based preservation systems.
A second opportunity cluster is cross-border compliance enablement and modular preservation systems for exporters and regional brand owners managing different additive matrices across countries. ASEAN’s April 2026 update to Annex I on maximum use levels of food additives provides a reference point that can be translated into harmonized specifications and country-ready labeling packs, while Singapore’s Food (Amendment) Regulations 2025, effective from 30 January 2026, increases focus on correct additive designation when performing a technological function. Suppliers that bundle preservatives with application guidance, label language, and documentation, including halal-compliant options for Indonesia, are positioned to shorten customer approval cycles in high-throughput segments such as ready meals, sauces and dressings, and processed meat across domestic and export channels.
Recent Industry Developments in Asia-Pacific Food Preservatives Market
- April 2026: Cargill announced an investment to expand its Beijing plant, a regional hub for functional systems and compound food additives used across Asia-Pacific. The investment strengthens local supply and technical support for preservation and food protection solutions, reducing reliance on long-haul shipments and improving responsiveness for customers reformulating to evolving additive rules.
- July 2025: Kerry Group opened an expanded office and Research, Development and Applications facility in South Jakarta, Indonesia, to accelerate innovation for Southeast Asia. The added regional RD&A capacity is intended to support faster localization of food protection and preservation systems for formats such as meat, bakery, and ready meals that need shelf-life extension under complex distribution conditions.
- July 2024: Food Standards Australia New Zealand (FSANZ) issued Notice No. FSC 184, approving chitosan and (1,3)-beta-glucan derived from Agaricus bisporus as permitted food additives for the Australia-New Zealand market. The approval broadened the toolbox for antimicrobial and antioxidant functions, creating new formulation options for manufacturers balancing clean-label goals with shelf-life performance.
Asia-Pacific Food Preservatives Market Report Scope and Research Methodology
Market Definition and Coverage
This market covers preservatives used in food and beverage processing across Asia-Pacific, counted as ingredient sales value in the region, regardless of whether they are added during manufacturing or used in formulated mixes.
Scope exclusions: We exclude equipment for preservation, packaging materials, and non-food uses of preservatives such as cosmetics, feed, and pharmaceuticals.
Segments Covered in This Report
- By Product Type
- Synthetic
- Sorbates
- Benzonates
- Propionates
- Others
- Natural
- Nisin
- Natamycin
- Vinegar
- Rosemary Extract
- Mixed Tocopherols
- Others
- Synthetic
- By Application
- Bakery and Confectionery
- Meat and Poultry
- Ready Meals
- Sweet and Savory Snacks
- Sauces and Dressings
- Edible Oils
- Other Applications
- By Country
- China
- Japan
- India
- Australia
- Thailand
- Singapore
- Indonesia
- South Korea
- Rest of Asia-Pacific
Data Sources, Market Sizing, and Validation
Desk Research
Desk work started with building a clean view of demand-side anchors, so the sizing is tied to real food production and processed food growth in Asia-Pacific. Public references used for context included sources such as FAO food balance and production data, UN Comtrade trade statistics, national statistics offices and food safety regulators in key countries, and published standards and guidance from bodies such as Codex Alimentarius.
On the supply side, we reviewed ingredient makers and distributors through annual reports, investor decks, product literature, and press releases. We then cross-checked pricing and availability signals from reputed industry media and association websites, using those signals to sanity-check gross margins and procurement patterns.
A paid subscription focused on company financials, and another on shipment-level import and export data were used selectively to confirm a few volume and price assumptions where public data was thin. These examples are not exhaustive, and many other sources were also referred to for data collection, validation, and research clarification.
Primary Interviews and Surveys
Primary work focused on filling the gaps that desk research cannot answer well, especially usage rates by application, typical formulation ranges, and how price changes are passed through in different countries. We spoke with a mix of ingredient suppliers, distributors, and food manufacturing stakeholders. Respondent input was then used to confirm product mix, average pricing logic, and country-level adoption differences across APAC before assumptions were finalized.
Distribution of primary research fieldwork respondents
| Company type | Respondent position |
|---|---|
| Top tier: 27% | CXOs: 18% |
| Mid tier: 52% | Functional/Unit leaders: 28% |
| Smaller Players: 21% | Managers: 54% |
Market-Sizing & Forecasting
Sizing was built using a top-down approach where processed food output and category expansion signals were converted into a preservatives demand pool using application-wise usage intensity ranges, which were then priced to value using country-level average selling price bands. To keep the totals realistic, we corroborated results with selective bottom-up approximations such as sampled supplier revenue direction, channel checks on product mix, and a price times volume sense check for a few high-use categories.
Inputs that mattered most included packaged and processed food production trends, trade flows for key preservative chemistries, application mix shifts (for example, meat and poultry versus bakery), the split between synthetic and natural solutions, and observed pricing movements linked to raw material availability and regulatory actions. Forecasts were developed using scenario analysis, where the central case was aligned to what experts expect for processed food growth, reformulation pace, and natural adoption, followed by adjustments for country-specific constraints when adoption indicators looked out of line with consumption signals.
Data Validation & Update Cycle
Model outputs were checked against independent signals like import trends, country-level processed food indicators, and the implied preservative spend per ton in major applications. When large variances appeared, assumptions were re-tested, and respondents were re-contacted if the gap looked structural rather than timing related.
Before sign-off, the numbers go through multi-step analyst reviews that include unit checks, currency conversion timing checks, and a pass to confirm that country rollups match the regional total. The report is refreshed annually, and interim updates are added when material events occur, followed by a final freshness check right before delivery.
Mordor Intelligence's Asia Pacific Preservatives Market Estimate Compared With Other Published Estimates
Published market values for Asia-Pacific food preservatives can look far apart because firms do not always count the same applications, they may treat natural extracts differently, and they often assume different price levels and currency timing for the base year.
The table shows a clear spread in 2025 sizing, and in Mordor Intelligence's model the value is counted as food-preservative ingredient sales across APAC by product type and food application, while adjacent shelf-life inputs that are not preservatives and non-food uses are kept out, which can move totals up or down depending on the source.
Benchmark comparison
| Source | Market Size | Gaps in Research Methodology |
|---|---|---|
| Mordor Intelligence | USD 1.09 B (2025) | |
| Regional Consultancy A | USD 0.69 B (2025) | Uses a narrower counted pool and a longer-dated forecast setup, which can reduce the 2025 value if average prices and application penetration are set conservatively at the country level. |
| Trade Journal B | USD 1.30 B (2025) | Tends to use broader inclusion around shelf-life ingredients, and may apply higher average selling prices or faster natural adoption in the base year without the same application-level usage checks. |
In practice, most of the difference comes from what is included, how application penetration is set, and how prices are translated into USD for the base year. By keeping the steps traceable to food output, usage intensity, and realistic price bands, the final figure stays repeatable and easier to validate when new country data arrives.
Key Questions Answered in the Report
What is the current value of the Asia-Pacific Food Preservatives market?
The market stands at USD 1.16 billion in 2026 and is expected to reach USD 1.58 billion by 2031.
Which preservative type dominates regional demand?
Synthetic preservatives retain the lead with 69.62% market share in 2025 due to their cost-performance advantage.
Which application is growing fastest?
Ready meals are projected to post a 6.88% CAGR through 2031 on the back of rising e-commerce grocery and single-person households.
Why is Indonesia important for suppliers?
Indonesia shows the highest forecast growth at 7.12% CAGR and enforces halal certification, driving demand for documented clean-label solutions.