
Pessary Market Size and Share
Market Overview
| Study Period | 2020 - 2031 |
|---|---|
| Market Size (2026) | USD 494.98 Million |
| Market Size (2031) | USD 620.32 Million |
| Growth Rate (2026 - 2031) | 4.63 % |
| Fastest Growing Market | Asia-Pacific |
| Largest Market | North America |
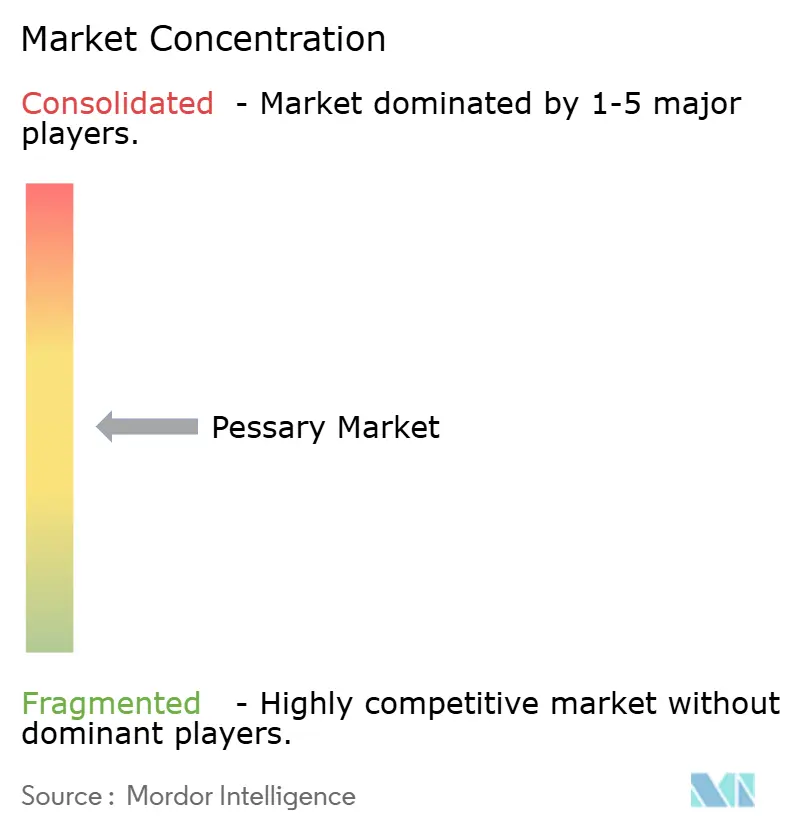
| Market Concentration | Medium |
Major Players *Disclaimer: Major Players sorted in no particular order Image © Mordor Intelligence. Reuse requires attribution under CC BY 4.0. | |
Pessary Market Analysis by Mordor Intelligence
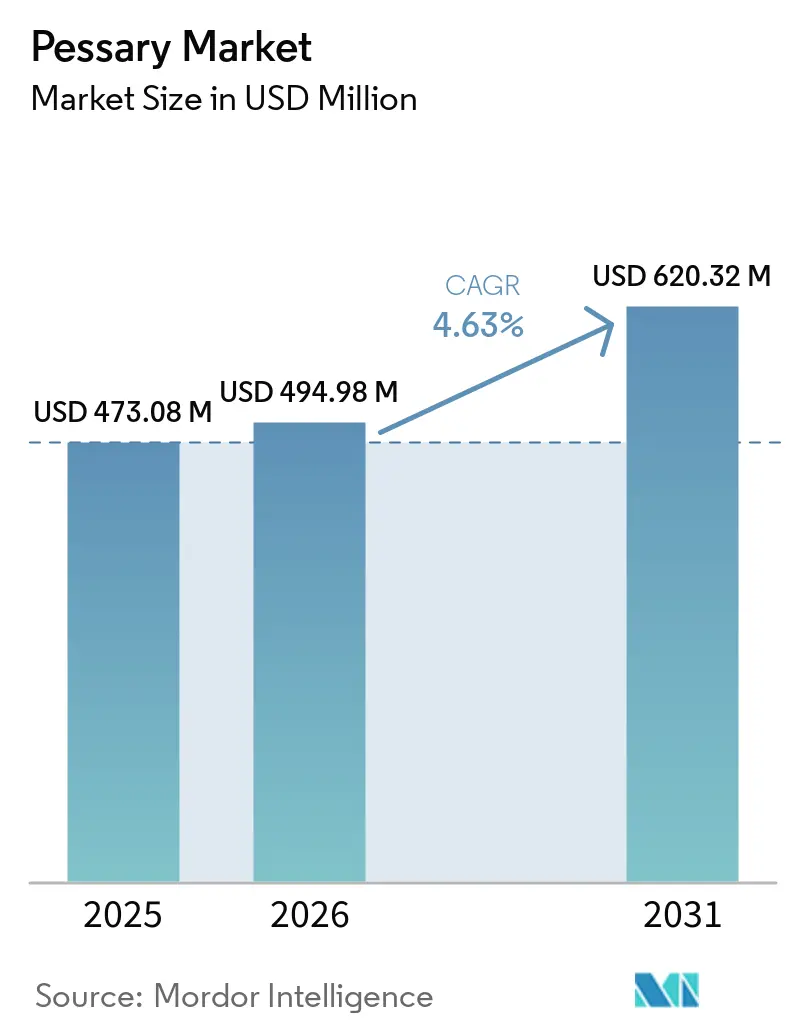
The Pessary Market size is expected to grow from USD 473.08 million in 2025 to USD 494.98 million in 2026 and is forecast to reach USD 620.32 million by 2031 at 4.63% CAGR over 2026-2031.
Population aging, rising pelvic floor disorder incidence, and wider insurance recognition, as illustrated by CMS’s 2024 creation of HCPCS code A4564, form the bedrock of current expansion[1]Centers for Medicare & Medicaid Services, “Healthcare Common Procedure Coding System Level II, 2024 Update,” cms.gov. Device innovation is another force, from collapsible designs that ease self-management to FDA-cleared 3D-printed options that personalize fit. Digitally enabled distribution is lowering access barriers as tele-urogynecology platforms link prescriptions, education, and doorstep fulfillment. Meanwhile, sustainability mandates in the European Union and material breakthroughs in medical-grade silicone keep manufacturers focused on product life-cycle impact alongside patient safety. Supply-chain fragility and reimbursement gaps create headwinds, yet demographic demand, outpatient care shifts, and digital commerce momentum together sustain a resilient growth outlook for the pessary market.
Key Report Takeaways
- By type, ring designs led with 45.98% of pessary market share in 2025, while cube models are forecast to post the fastest 6.12% CAGR to 2031.
- By material, medical-grade silicone commanded 78.02% share of the pessary market size in 2025; latex/rubber is advancing at a 6.45% CAGR through 2031.
- By application, POP Stage I–II treatments accounted for 43.02% of the pessary market size in 2025, whereas stress urinary incontinence is projected to expand at a 7.35% CAGR to 2031.
- By end user, hospitals handled 51.87% of fittings in 2025, whereas ambulatory surgical centers & uro-gyn clinics are projected to grow at a 7.02% CAGR.
- By geography, North America captured 38.11% pessary market share in 2025, yet Asia-Pacific is set to grow the fastest at a 5.18% CAGR during the forecast period.
Note: Market size and forecast figures in this report are generated using Mordor Intelligence’s proprietary estimation framework, updated with the latest available data and insights as of 2026.
Market Trends and Insights
Drivers Impact Analysis of Pessary Market*
| Driver | (~) % Impact on CAGR Forecast | Geographic Relevance | Impact Timeline |
|---|---|---|---|
| Growing prevalence of POP & urinary incontinence | +1.2% | Global, highest in North America & Europe | Long term (≥ 4 years) |
| Shift toward non-surgical outpatient management | +0.8% | North America & EU, expanding into Asia-Pacific | Medium term (2–4 years) |
| Rising awareness & women-health initiatives | +0.6% | Global, policy-led in developed markets | Medium term (2–4 years) |
| Advances in medical-grade silicone & ergonomic design | +0.4% | Global manufacturing hubs, tech transfer to emerging markets | Short term (≤ 2 years) |
| AI-driven 3D-printed custom pessaries | +0.3% | Early adoption in North America & Europe, selective APAC | Long term (≥ 4 years) |
| Tele-urogynecology enabling remote self-management | +0.5% | North America lead, EU following, limited APAC penetration | Medium term (2–4 years) |
| Source: Mordor Intelligence | |||
Growing Prevalence of POP & Urinary Incontinence
Pelvic organ prolapse (POP) cases are projected to climb 46% by 2050, with the steepest gains in women aged 70–79. Quality-of-life studies show 56% of affected women experience incontinence and 52% develop prolapse, highlighting unmet need[2]Taryn Hall, “Pelvic Floor Disorder Symptom Burden Survey,” Frontiers in Public Health, frontiersin.org. Annual U.S. surgical costs already top USD 1.523 billion, heightening payer interest in non-surgical alternatives. Eighty-two percent of prolapse surgeries now occur in ambulatory centers, settings that readily integrate pessary fitting. These clinical and economic facts underpin steady demand for conservative therapy, strengthening the long-term foundation of the pessary market. Source: Taryn Hall, “Pelvic Floor Disorder Symptom Burden Survey,” Frontiers in Public Health, frontiersin.org
Shift Toward Non-Surgical Outpatient Management
Prospective studies record 40% symptom relief in voiding, 38% drop in urgency, and 29% reduction in urge incontinence among pessary users. The American Urogynecologic Society’s 2024 consensus formalized care pathways, addressing earlier guideline gaps. Ergonomic upgrades such as collapsible rings cut insertion pain and support self-care[3]Ashford Hosseini, “Collapsible Pessary Comfort Study,” American Journal of Obstetrics and Gynecology, ajog.org. Tele-urogynecology platforms now permit remote prescribing, with follow-up protocols embedded in software workflows. Reimbursement recognition through HCPCS coding further validates outpatient conservative management as both clinically and economically viable.
Rising Awareness & Women-Health Initiatives
In 2024 the U.S. committed USD 100 million to women’s health research, redirecting funding toward historically underdiagnosed pelvic floor conditions. FemTech’s expected climb to USD 177.05 billion by 2032 fosters broader ecosystems of clinical trials, education and provider training that flow into pessary adoption. Trials such as TOPSY showed self-managed pessaries perform on par with clinic-based care, expanding viable delivery models. Professional societies now issue standardized fitting guidelines, boosting clinician confidence. Social-media advocacy normalizes discussion of intimate health, driving demand for accessible, conservative therapies within the pessary market.
Advances in Medical-Grade Silicone & Ergonomic Design
Material science progress has moved pessaries from generic commodity to precision device. NuSil alone carries more than 700 FDA master files, underscoring stringent quality standards. Mediplus’s 2024 POPY shelf model brings anatomical shaping and 10-year shelf life. Clinical audits link 26.6% of discontinuations to discomfort, so manufacturers have prioritized softer durometers and shape-memory inserts. Autoclavable builds lower per-patient costs while meeting infection-control norms, and R&D into bioplastics targets environmental mandates without compromising biocompatibility. These innovations enhance patient adherence and strengthen the competitive profile of the pessary market.
Restraints Impact Analysis of Pessary Market*
| Restraints Impact Analysis | (~) % Impact on CAGR Forecast | Geographic Relevance | Impact Timeline |
|---|---|---|---|
| Patient discomfort, complications & fear | −0.7% | Global, culturally moderated | Short term (≤ 2 years) |
| Limited reimbursement coverage | −0.5% | Developing markets, uneven in developed economies | Medium term (2–4 years) |
| Medical-grade silicone supply fragility | −0.4% | Global, acute where raw materials are imported | Short term (≤ 2 years) |
| Sustainability pressure on single-use plastics | −0.3% | Europe leading, spreading to North America & Asia-Pacific | Long term (≥ 4 years) |
| Source: Mordor Intelligence | |||
Patient Discomfort, Complications & Fear
Recent multicenter work notes a 21% complication incidence; expulsion makes up 40.8%, and pain 26.6% of those events. Surgical resolution becomes necessary in 34.2% of complex cases, shaping clinicians' caution. Up to 30% of eligible women decline a trial due to anxiety over discomfort or dislodgment. Anatomical constraints, vaginal length under 7.5 cm, predict discontinuation yet require specialized assessment tools not ubiquitous in primary care. Cultural taboos further dampen uptake in certain geographies. Although collapsible and customized devices mitigate many issues, price and practitioner familiarization lag behind technical possibilities.
Limited Reimbursement Coverage
CMS’s disposable-pessary fee schedule averages USD 67.21, but private insurance and Medicaid policies vary widely. Elderly women on fixed incomes often shoulder out-of-pocket costs for fittings and follow-ups. Globally, many payors still view pessaries as discretionary supplies rather than essential medical devices. Continuous care, including adjustments, lacks dedicated billing codes in several systems, discouraging provider engagement. While value-based care could reward outcomes rather than procedures, data infrastructure for shared-risk models remains underdeveloped. Direct-pay e-commerce helps some patients but accentuates economic inequity. These payment hurdles temper the otherwise robust outlook for the pessary market.
*Our forecasts treat driver/restraint impacts as directional, not additive. The impact forecasts reflect baseline growth, mix effects, and variable interactions.
Pessary Market Segment Analysis
By Type:
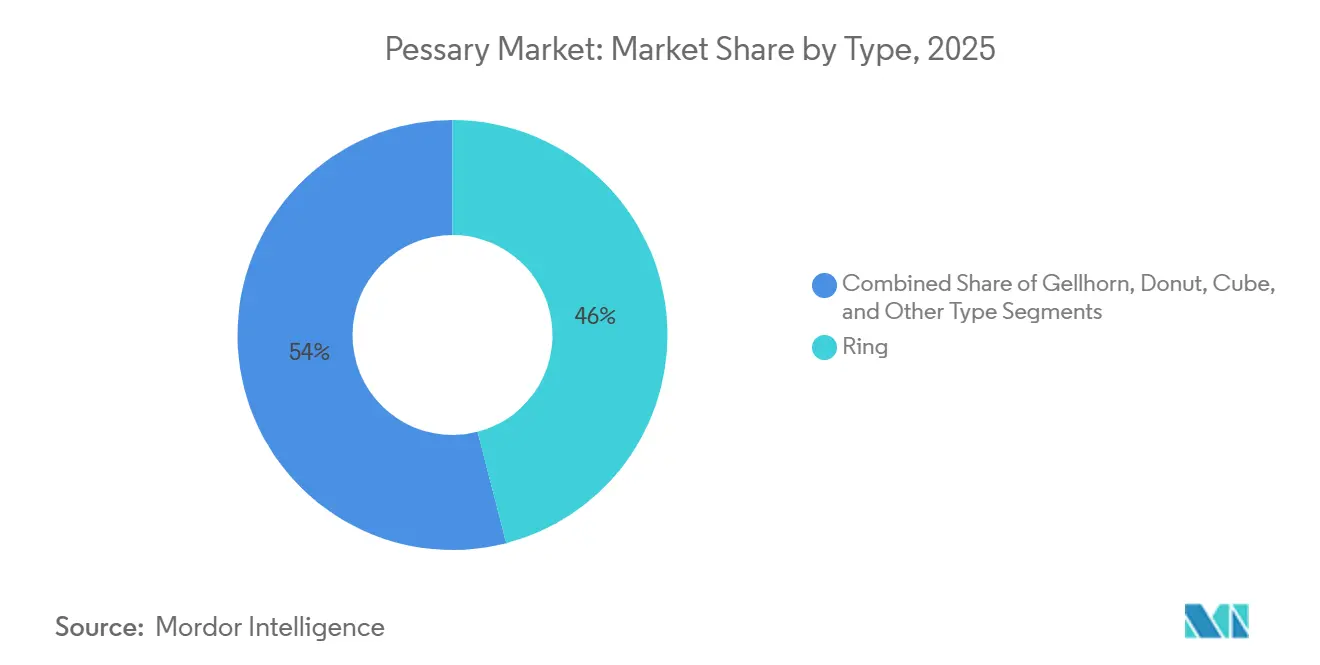
Ring Dominance Faces Custom DisruptionRing pessaries generated 45.98% of pessary market share in 2025, underscoring deep provider familiarity and broad indication coverage. Cube devices, however, are projected to outpace the broader pessary market at a 6.12% CAGR to 2031, favored for advanced prolapse scenarios. Gellhorn and donut variants fill specific anatomical niches, whereas emerging collapsible and 3D-printed models inhabit the technological frontier.
Custom manufacturing is redefining clinical protocols. Cosm Medical’s FDA-cleared Gynethotics platform delivers anatomical imaging, AI-assisted design and in-clinic 3D printing, a process that trims trial-and-error timelines and improves fit. As printing costs fall and clinical data mount, ring dominance could erode. Yet ring designs still benefit from lowest unit cost and entrenched reimbursement coding, positioning them as baseline solutions even as personalization gains ground across the pessary market.



By Material:
Silicone Supremacy Challenged by SustainabilityMedical-grade silicone retained 78.02% of the pessary market size in 2025 owing to unrivaled biocompatibility, tensile resilience, and sterilizability. Latex/rubber’s 6.45% CAGR reflects health-system cost constraints and patient demand for lower-priced options in emerging regions. Thermoplastic elastomers offer recyclability advantages but remain niche. Bio-resorbable polymers and composite 3D-prints lie at the R&D horizon, melding sustainability with individualized geometry.
EU environmental scoring is compelling procurement teams to weigh carbon footprint and end-of-life disposal alongside clinical efficacy. Health systems that adopt lifecycle tenders could gradually divert volume toward greener materials. Nevertheless, silicone’s legacy validation keeps regulatory hurdles low and adoption friction minimal, sustaining its near-term primacy within the pessary market.
By Application:
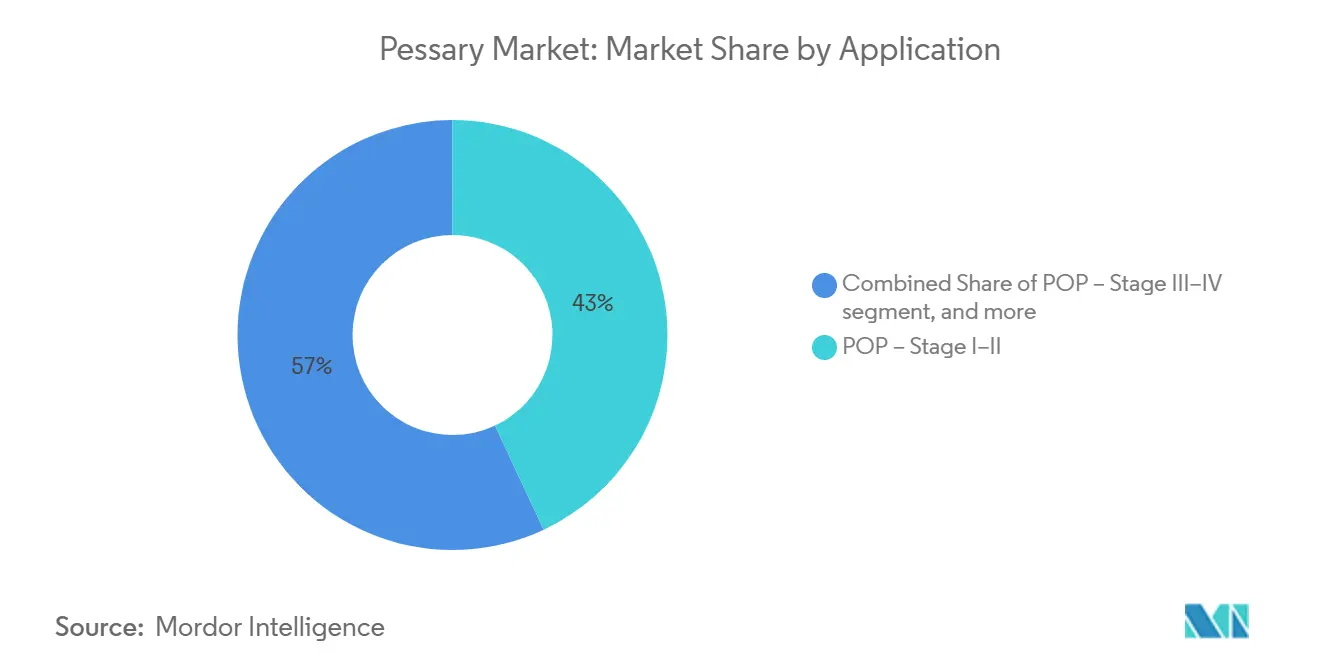
Stress Incontinence Drives Growth AccelerationPOP Stage I–II therapy represented 43.02% of the pessary market size in 2025, mirroring its clinical prevalence. Stress urinary incontinence is forecast to record a 7.35% CAGR, eclipsing other use cases as stigma falls and first-line conservative care gains traction. POP Stage III–IV and specialty indications cervical insufficiency, post-surgical support retain modest but essential roles for high-risk patients.
Digital pelvic-floor training devices augment mechanical support, creating holistic management pathways. Clinical comparisons show app-guided programs delivering superior symptom reduction against unsupervised home routines. Pessary makers that integrate sensors or companion apps can capture cross-selling upside and embed themselves in longitudinal care, further enlarging the pessary market.
By End User:
Digital Transformation Reshapes DistributionHospitals handled 51.87% of fittings in 2025, a reflection of legacy referral pathways and bundled reimbursement. Online pharmacies and direct-to-consumer storefronts are slated for 7.02% CAGR, enabled by telemedicine scripts and streamlined logistics.
Ambulatory centers and uro-gyne clinics are projected to grow at the fastest CAGR owing to the increasing prevalence of pelvic organ prolapse and urinary incontinence among women, leading to higher demand for non-invasive, conservative treatment options. Additionally, rising awareness about minimally invasive procedures and advancements in pessary designs enhances patient acceptance and usage. Growing preference for outpatient settings due to cost-effectiveness and convenience further propels the adoption of pessaries in these end-user facilities.
Geography Analysis
North America Pessary Market
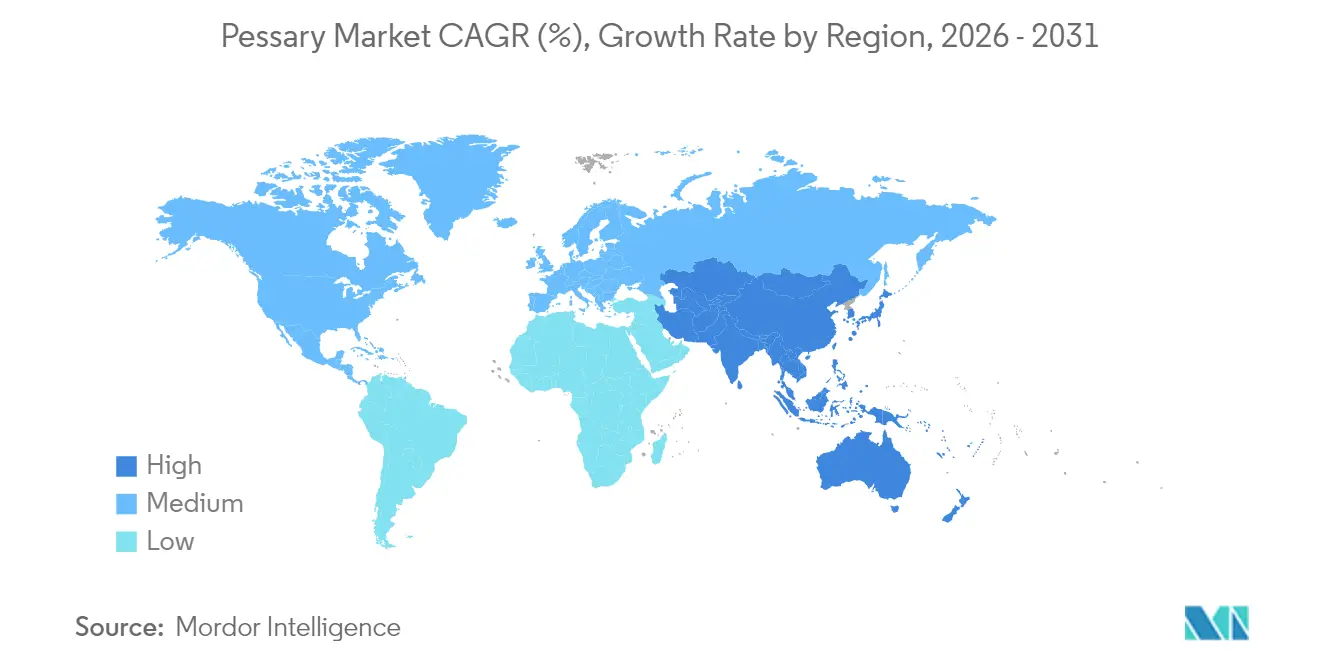
North America led the pessary market with a 38.11% revenue share in 2025, buoyed by widespread urogynecology networks, targeted women-health funding and clear FDA pathways. The U.S. government’s USD 100 million research allocation is fostering clinical trials and provider training that feed demand. CooperSurgical’s 2024 revenue reached USD 1.286 billion, proof that established players can still grow 10% by harnessing clinician relationships and reimbursement savvy. Insurer fee compression and coverage disparities pose lingering obstacles, yet telehealth’s regulatory normalization broadens patient reach. Canada and Mexico add incremental upside through healthcare system modernization.
APAC Pessary Market
Asia-Pacific is forecast to outpace all regions at a 5.18% CAGR to 2031. Aging demographics in Japan and South Korea mirror Western trends, while China’s middle-class expansion and hospital build-outs unlock volume potential. The region’s medtech revenues could touch USD 225 billion by 2030, supplying favorable context for the pessary market. Regulatory heterogeneity and cultural stigma complicate rollout, but social-commerce integration and rising FemTech literacy are easing adoption. Private-equity investment and public infrastructure funding in 2024 fortified domestic supply chains, setting a foundation for sustained gains.
EMEA and South America Pessary Market
Europe’s universal healthcare coverage and evidence-based practice culture support stable, mid-single-digit growth. EU MDR and IVDR quality thresholds elevate compliance costs yet protect incumbents with established QMS footprints. Sustainability directives press manufacturers toward biodegradable inputs and circular-economy packaging, potentially sparking material innovation. Market conditions in the Middle East & Africa and South America remain nascent but promising, dependent on infrastructure upgrades, clinician education and broadened payer coverage to unlock their share of the global pessary market.

Competitive Landscape
Market concentration is moderate: a handful of diversified device firms control legacy product lines, while specialized entrants carve out high-growth niches. CooperSurgical leverages integrated sales forces, educational grants and diversified women-health portfolios to defend share. Integra LifeSciences stumbled in 2024 after FDA warning letters on quality lapses, showing that regulatory compliance remains a make-or-break variable.
Technology is now the main competitive lever. Cosm Medical’s Gynethotics program pairs AI anatomic mapping with in-clinic 3D printing, trimming fitting times and improving comfort—an edge that already secured FDA clearance and fresh venture capital in 2025. Axena Health succeeded in winning an HCPCS code for its Leva digital system, illustrating how savvy reimbursement strategy can expand addressable patients.
Strategic partnerships continue to reshape the field. ConTIPI Medical turned to EVERSANA for U.S. commercialization of its ProVate device, merging device IP with outsourced market-access muscle. BD’s USD 10 million investment in domestic manufacturing boosts resilience against geopolitical shocks. Looking ahead, players that integrate design innovation with digital engagement, supply-chain resilience and payer strategy are positioned to command outsized influence within the pessary market.
Pessary Industry Leaders
CooperSurgical Inc.
Bioteque America, Inc.
Integra LifeSciences
Coloplast A/S
MedGyn Products, Inc.
- *Disclaimer: Major Players sorted in no particular order
Pessary Market Companies Covered in this Report
- The Cooper Companies
- Coloplast
- MedGyn Products
- Bioteque America, Inc.
- Panpac Medical Corp.
- Dr. Arabin
- Artisan Medical (Milex)
- Personal Medical Corp.
- Cosm Medical
- Mediplus Ltd.
- Integra LifeSciences
- Bray Group Ltd.
- Thomas Medical
- Bliss GVS Pharma Ltd.
- Shanghai Medical Corp.
- Cook Group
- FEG Textiltechnik
- Pelican Feminine Healthcare
- Utah Medical Products
- SRS Medical

Recent Industry Developments in Pessary Market
- January 2026: CooperSurgical announced FDA 510(k) clearance (K253698) for Milex incontinence dish pessaries and cube pessaries. The clearance supports portfolio refresh and expands use cases across prolapse and incontinence.
- December 2025: CooperSurgical announced a transition to a direct sales model for its Labor and Delivery portfolio in France, Italy, Germany, and Spain, starting in its fiscal first quarter 2026. The shift improves direct customer coverage and ordering support in key European markets, and it may also strengthen distribution for adjacent women's health device categories sold into the same hospital and clinic accounts.
- January 2024: CMS created HCPCS code A4564 for pessaries, giving payers and providers in the United States a clearer billing handle. Standardized coding can support more consistent reimbursement workflows and reduce administrative barriers for outpatient fitting and ongoing conservative management.


Pessary Market Report Scope and Research Methodology
Market Definition and Coverage
In this study, we define the pessary market as the global sales value of vaginal pessary devices used to manage pelvic organ prolapse and stress urinary incontinence across clinical and at-home use settings, captured through standard healthcare distribution channels.
Scope exclusions: We exclude surgical implants, pelvic floor therapy services, fitting and follow-up visit fees, and drug therapy even when co-prescribed with pessary use.
Segments Covered in This Report
- By Type
- Ring
- Gellhorn
- Donut
- Cube
- Other Types
- By Material
- Medical-grade Silicone
- Thermoplastic Elastomer
- Latex / Rubber
- Bio-resorbable & 3-D printed Composites
- By Application
- POP – Stage I–II
- POP – Stage III–IV
- Stress Urinary Incontinence
- Other Applications
- By End User
- Hospitals
- Ambulatory Surgical Centers & Uro-gyn Clinics
- Other End Users
- Geography
- North America
- United States
- Canada
- Mexico
- Europe
- Germany
- United Kingdom
- France
- Italy
- Spain
- Rest of Europe
- Asia-Pacific
- China
- Japan
- India
- Australia
- South Korea
- Rest of Asia-Pacific
- Middle East & Africa
- GCC
- South Africa
- Rest of Middle East & Africa
- South America
- Brazil
- Argentina
- Rest of South America
- North America
Data Sources, Market Sizing, and Validation
Desk Research
Desk work starts with pinning down the patient pool and care pathway, because pessary demand is closely tied to diagnosis and conservative management practices. We referenced public sources such as the US Centers for Medicare and Medicaid Services for coding and reimbursement signals, the US Food and Drug Administration databases for device classification cues, and the World Health Organization and World Bank for age structure and health system context by country.
To avoid building the model only from broad health statistics, we also used clinical guidance and evidence from peer-reviewed journals (for fitting patterns, replacement intervals, and discontinuation), along with association websites focused on urogynecology and continence care. Company filings, product catalogs, and investor presentations helped us map typical pricing architecture and channel mix, while reputed press and conference coverage added context on product refreshes and adoption timing. In parallel, we used paid subscriptions for company financials and intelligence, patent databases, and news and financials to validate timelines and cross-check commercial traction. The sources listed here are illustrative only, and many other public references were also used for data collection, validation, and clarification.
Primary Interviews and Surveys
Primary work was used to pressure-test the desk assumptions that usually drive the value model, especially average selling price (ASP) ranges, replacement frequency, and the share of demand that moves through hospital, retail, and online pharmacy routes. We spoke with clinicians involved in fitting, channel-side stakeholders, and product or regional leaders, then used follow-up questions to resolve differences by region on coverage, patient compliance, and procurement practices.
Distribution of primary research fieldwork respondents
| Company type | Respondent position | Region |
|---|---|---|
| Top tier: 33% | CXOs: 14% | APAC: 48% |
| Mid tier: 50% | Functional/Unit leaders: 33% | EMEA: 34% |
| Smaller Players: 17% | Managers: 53% | Americas: 18% |
Market-Sizing & Forecasting
Sizing was built using both top-down and bottom-up logic, with the main totals reconstructed from condition prevalence and treated-patient pools, which were then converted into annual device demand using fitting rates and replacement cycles. Once the demand pool was set, value was estimated by applying region-sensitive ASP bands and a typical channel mix, and then corroborated using selective supplier roll-ups and channel checks.
A few variables that matter most in this market were treated as explicit model inputs so the math stays traceable. These included the share of pelvic organ prolapse and stress urinary incontinence patients managed conservatively, clinician fitting and follow-up patterns, replacement or re-fitting cadence, the mix of silicone versus other materials that affects pricing, online pharmacy penetration, and reimbursement availability where relevant. When a country lacked a clean series for one input, we used a proxy based on comparable health system peers and then validated it in interviews before locking it in.
For forecasting, we relied mainly on scenario analysis tied to aging demographics, expected shifts in conservative care adoption, and ASP progression assumptions that reflect mix changes rather than a flat inflation uplift. The scenarios were reviewed with primary respondents and narrowed to a base case that matches observable adoption and pricing behavior across major regions.
Data Validation & Update Cycle
We run variance checks at multiple points so the model does not drift away from real-world signals, including consistency checks across patient pool, unit demand, and implied pricing by channel. Outliers are flagged for re-review, and a second analyst checks the math, assumptions, and unit conversions before the numbers are finalized.
Outputs are compared against independent indicators such as coding and reimbursement changes, product launch activity, and shifts in distribution behavior reported by interviewees. Reports are refreshed annually, and interim updates are made when material events change demand, pricing, or access assumptions. Right before delivery, we do a final refresh pass so clients receive the latest updated view.
Mordor Intelligence's Global Pessary Market Size Measured Against Other Published Estimates
Published market sizes for pessaries often differ because each publisher sets its own scope for what counts as a pessary device, chooses a current-year anchor, and makes different assumptions on replacement cadence and channel pricing. Even when the product definition looks similar, the numbers can drift when ASPs are carried forward too mechanically or when currency timing is not aligned to the year being presented.
When pricing is refreshed close to publication and FX is applied using the same timing window as the stated market year, the final value stays more consistent with what channel participants are actually seeing, which is how the 2026 figure was maintained in Mordor Intelligence.
Benchmark comparison
| Source | Market Size | Gaps in Research Methodology |
|---|---|---|
| Mordor Intelligence | USD 494.98 M (2026) | |
| Global Consultancy A | USD 470.40 M (2025) | Uses a different current year and may carry ASPs forward using a broad growth factor, which can understate recent mix-driven pricing moves and the shift toward higher-priced materials. |
| Industry Publisher B | USD 424.80 M (2024) | Anchors the model on an earlier base year and applies a faster long-run growth curve, which can widen differences if treated-patient uptake and replacement cycles are not re-validated by region. |
Overall, the spread is mostly explained by base-year timing and how replacement cadence and ASP progression are handled rather than by any single market driver. Our approach keeps the value build tied to treated demand, channel behavior, and price bands that can be re-checked with the same steps during the next refresh.


Key Questions Answered in the Report
What is the current size of the pessary market?
The pessary market is valued at USD 494.98 million in 2026 and is projected to grow to USD 620.32 million by 2031.
Which pessary type holds the largest market share?
Ring designs lead with 45.98% of pessary market share in 2025.
Why is stress urinary incontinence the fastest-growing application?
Growing awareness, stigma reduction, and first-line conservative treatment guidelines drive a 7.35% CAGR for stress incontinence applications.
Which region is expected to register the highest growth?
Asia-Pacific is forecast to post the fastest 5.18% CAGR through 2031 due to demographic shifts and expanding healthcare access.
How are digital channels affecting distribution?
Telemedicine scripts and direct-to-consumer e-commerce are projected to lift online channels at a 7.02% CAGR, reshaping how patients obtain pessaries.
What materials dominate pessary manufacturing?
Medical-grade silicone remains the primary material, capturing 78.02% of the pessary market size in 2025 thanks to proven biocompatibility and durability.
Page last updated on:


 Your data is secure and never sold or shared.


