
Macadamia Nuts Market Size and Share
Macadamia Nuts Market Analysis by Mordor Intelligence
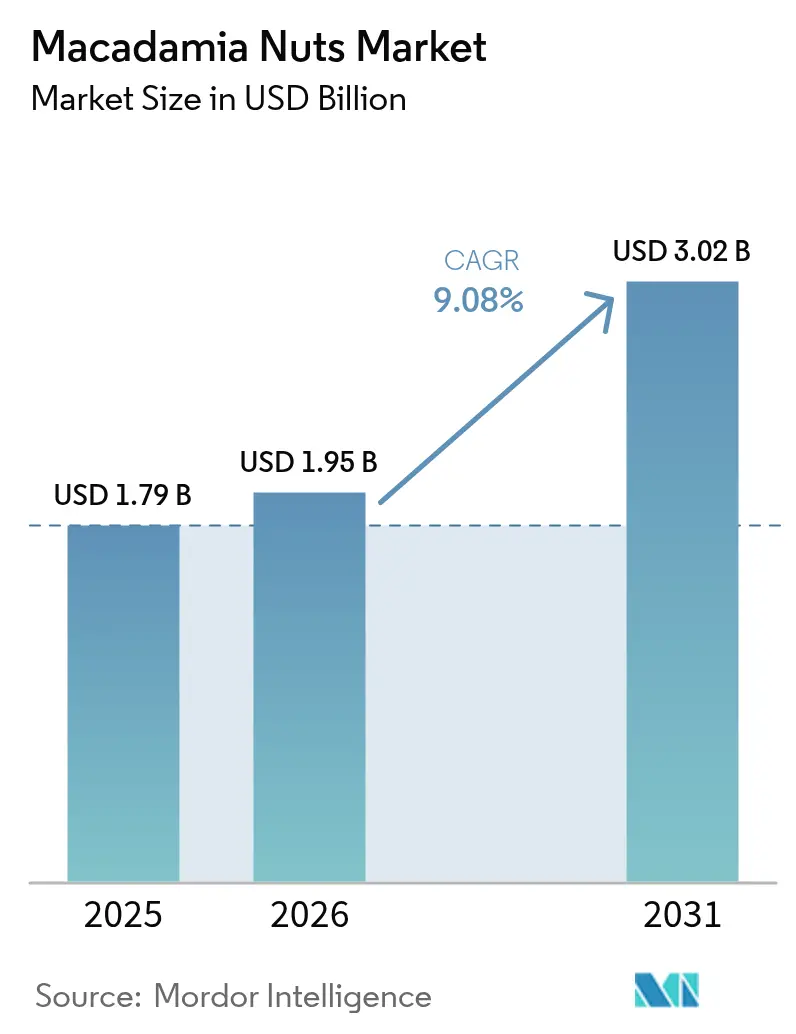
The macadamia nuts market size is anticipated to grow from USD 1.79 billion in 2025 to USD 1.95 billion in 2026 and is forecast to reach USD 3.02 billion by 2031 at 9.08% CAGR over 2026-2031. Robust expansion reflects a widening shift among premium food manufacturers that now favor macadamia kernels when formulating plant-based dairy, confectionery, and nutritious snacks. Kernel fats replicate the lipid profile of human sebum, allowing cosmetic brands to substitute macadamia oil for argan and jojoba while trimming formulation costs. Rapid orchard plantings in Kenya and South Africa, alongside fast-bearing cultivars released in Queensland, signal rising supply momentum. Meanwhile, blockchain traceability platforms win premiums of up to 10% because sustainability officers must prove deforestation-free origins under new European Union rules.
Key Report Takeaways
- By geography, Asia-Pacific accounted for 46.0% share of the macadamia nuts market size in 2025, while Africa records the fastest projected CAGR at 7.7% between 2026 and 2031.
Note: Market size and forecast figures in this report are generated using Mordor Intelligence’s proprietary estimation framework, updated with the latest available data and insights as of 2026.
Global Macadamia Nuts Market Trends and Insights
Drivers Impact Analysis*
| Driver | (~) % Impact on CAGR Forecast | Geographic Relevance | Impact Timeline |
|---|---|---|---|
| Accelerated demand from premium plant-based milk producers | +1.8% | Global, with peak intensity in North America and Asia-Pacific | Medium term (2-4 years) |
| Expanding cosmetic-grade oil applications | +1.5% | Europe and North America core, spillover to Asia-Pacific premium segments | Medium term (2-4 years) |
| Rising popularity of macadamia-based protein concentrates | +1.3% | North America and Asia-Pacific, early adoption in urban Europe | Long term (≥ 4 years) |
| Blockchain-enabled farm-to-shell traceability premiums | +0.9% | Global, concentrated in direct-trade channels serving premium buyers | Short term (≤ 2 years) |
| Carbon-credit monetization for macadamia agro-forestry systems | +0.7% | Africa and South America, with pilot projects in Australia | Long term (≥ 4 years) |
| Genetic rootstock breakthroughs shortening juvenile period | +1.2% | Asia-Pacific and South America emerging origins, spillover to Africa | Long term (≥ 4 years) |
| Source: Mordor Intelligence | |||
Accelerated Demand from Premium Plant-based Milk Producers
Macadamia milk retails between USD 6.50 and USD 9.00 per liter in North America and Europe, fetching a 40-60% premium over almond milk. Producers prefer kernels because a natural emulsion delivers viscosity without hydrocolloids, which simplifies clean-label ingredient decks. Macadamia's natural creamy texture has made them suitable for premium "barista ready" products that serve coffeehouse chains and upscale retailers. Higher retail prices have gradually raised kernel quotations as processors diverted supply from confectionery spot markets. Large dairy-alternative brands now lock in multi-year contracts, reducing visibility on the open market and squeezing small roasters that depend on spot availability. Recent regulatory changes in Europe permit nut milks to use traditional dairy terms, eliminating a significant marketing constraint and creating new opportunities for brand positioning.
Expanding Cosmetic-grade Oil Applications
Macadamia oil's lipid profile mirrors human skin oils, making it valuable for anti-aging skincare products. Clean-beauty brands replaced a portion of argan oil with macadamia oil due to its similarity to human sebum. This change improved skin hydration, increasing its appeal among European formulators. Beauty companies in Asia and Western markets incorporate it into high-end formulations for enhanced hydration and antioxidant protection. Advanced extraction methods increase their effectiveness, enabling premium positioning and enhanced consumer appeal. Wholesale cosmetic-grade macadamia oil averaged USD 18 per kilogram against USD 32 per kilogram for certified-organic argan, creating margin upside for processors. Companies obtain oil from certified orchards to validate sustainability claims and enhance traceability. The oil's value as a coproduct strengthens financial stability for nut processors, who benefit from multiple revenue streams while meeting increased demand in the luxury personal care market.
Blockchain-Enabled Farm-to-Shell Traceability Premiums
Provenance platforms utilizing distributed-ledger technology enable buyers to verify single-estate kernel origins, harvest dates, and processing timestamps, achieving price premiums of 8% to 10% over commodity-grade kernels in direct-trade channels. A pilot blockchain traceability system allows European confectionery buyers to scan QR codes and access orchard-level data, including soil health metrics and water-use efficiency. This level of transparency is particularly valuable to corporate sustainability officers tasked with documenting Scope 3 emissions and ensuring deforestation-free sourcing, in compliance with the European Union Deforestation Regulation requirements. However, smaller processors encounter significant adoption challenges, as blockchain integration costs range from USD 50,000 to USD 150,000 for initial setup, along with annual licensing fees, making it unaffordable for cooperatives processing less than 500 metric tons annually. The technology's influence is anticipated to remain concentrated in premium segments catering to multinational buyers, with minimal impact on spot markets.
Rising Popularity of Macadamia-based Protein Concentrates
Macadamia protein contains 55-65% protein by weight and is free of top-eight allergens, making it ideal for ready-to-drink shakes and bakery blends. Manufacturers are converting macadamia press-cake into high-purity protein concentrates that exceed the performance of other nut-based alternatives. These proteins enhance sports drinks and gluten-free baked goods, providing functional benefits in texture and nutrition. Wholesale prices remain USD 28-35 per kilogram because only a few processors have enzymatic hydrolysis and spray-drying capacity. Manufacturers are increasing production through advanced reactors, improving process efficiency and cost-effectiveness. The protein's adaptability and premium position improve processor margins, encouraging investment in integrated facilities. As plant-based protein demand increases, macadamia concentrates establish a position in health-focused and gourmet food segments, providing an effective alternative to conventional ingredients.
Restraints Impact Analysis*
| Restraint | (~) % Impact on CAGR Forecast | Geographic Relevance | Impact Timeline |
|---|---|---|---|
| Price volatility due to weather-sensitive harvests | -1.4% | Global, with acute impact in Australia and South Africa | Short term (≤ 2 years) |
| Lengthy juvenile period of macadamia trees | -0.9% | Global, particularly affecting smallholder adoption in Africa and South America | Long term (≥ 4 years) |
| Tightening aflatoxin limits in EU and China | -1.1% | Africa and Asia-Pacific exporters, with compliance costs concentrated in processing hubs | Medium term (2-4 years) |
| Container-freight cost spikes disrupting kernel supply | -0.8% | Global, with highest impact on Africa-to-Asia and Australia-to-Europe routes | Short term (≤ 2 years) |
| Source: Mordor Intelligence | |||
Price Volatility due to Weather-sensitive Harvests
El Niño events and tropical cyclones repeatedly devastate Queensland and KwaZulu-Natal orchards, triggering kernel price swings of 20 to 35% within a single crop year and complicating long-term contract negotiations for food manufacturers[1]Source: Australian Bureau of Meteorology, “Tropical Cyclone Jasper Impact Assessment,” bom.gov.au. As of April 2024, average kernel prices experienced a slight increase compared to March, remaining above the USD 8.25/kg level reported in 2023. Cyclone Jasper struck Queensland in December 2023, damaging several hectares of bearing orchards, including macadamia. South Africa faced a similar disruption when unseasonal hail in Mpumalanga province destroyed the pre-harvest crop, tightening global kernel availability and pushing spot prices. This volatility forces buyers to carry higher inventory buffers, raising working-capital costs for confectionery manufacturers who previously operated on just-in-time supply models. Weather risk also deters institutional investment in orchard expansion, as private equity funds require stable cash-flow projections that macadamia cultivation cannot reliably deliver without crop insurance. To mitigate these challenges, buyers source macadamias from diverse regions, including South Africa, Kenya, and Australia.
Tightening Aflatoxin Limits in EU and China
Stricter maximum residue levels for aflatoxins raise testing costs and increase rejected consignments, particularly for African exporters who lack the climate-controlled storage infrastructure to prevent fungal contamination during post-harvest handling. The EU strictly regulates aflatoxin in macadamia nuts, for Aflatoxin B1 and for total aflatoxins. These limits are enforced through stringent testing, especially for imports, in accordance with Commission Regulation (EU) 2023/915[2]Source: European Commission, “Commission Regulation 165/2010 on Aflatoxins,” ec.europa.eu. China's GB 2761 standard imposes a 5 microgram per kilogram limit for aflatoxin B1 in tree nuts, forcing exporters to implement high-performance liquid chromatography testing. Compliance investments in dehumidification equipment and hermetic storage bags add USD 0.40 to USD 0.60 per kilogram to processing costs, eroding margins for smallholder cooperatives that operate on net returns of USD 2.00 to USD 2.80 per kilogram. This regulatory tightening advantages large processors with capital to invest in controlled-atmosphere storage, consolidating market share at the expense of smaller players.
*Our forecasts treat driver/restraint impacts as directional, not additive. The impact forecasts reflect baseline growth, mix effects, and variable interactions.
Geography Analysis
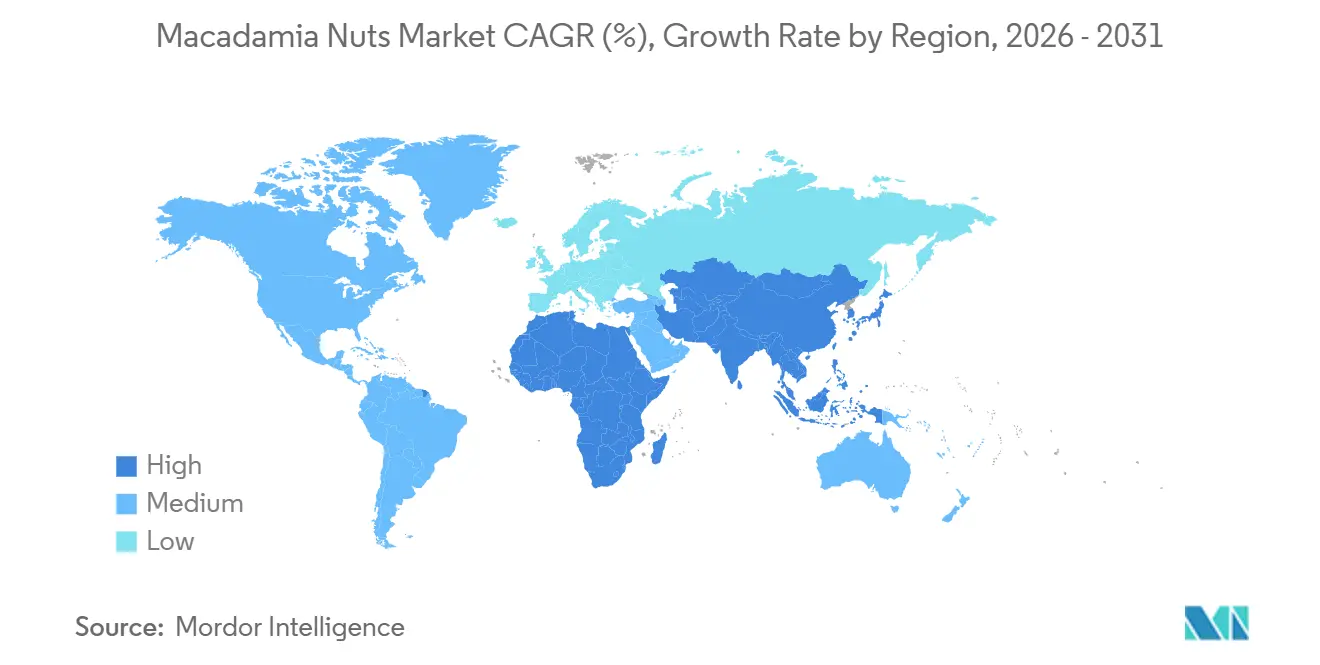
In 2025, Asia-Pacific held 46.0% of the macadamia nuts market share value and is projected to grow steadily. China saw increased imports of kernels, driven by confectionery reformulations that enhanced the status of tree nuts in premium gift boxes. Japan increased its per-capita macadamia consumption, supported by the availability of ready-to-eat nut snacks in convenience stores. Australia remained the leading producer in the region, despite losses due to cyclone-related damage.
Africa, with South Africa and Kenya as key producers, shows the highest regional growth rate at 7.7% CAGR from 2026 to 2031. The region supplies 25% of global kernel production, using advanced sorting technologies to improve export quality. South Africa improved kernel recovery rates, enhancing export competitiveness in the European market. Kenya reduced phytosanitary clearance times, cutting spoilage. Additionally, new orchard financing is accelerating the adoption of agroforestry models that integrate carbon credits with kernel revenue streams.
North America accounted for a notable share of global macadamia consumption in 2025 and is forecast to grow steadily, driven by increasing demand for plant-based dairy alternatives and sports nutrition products. The United States imported a significant volume of kernels, primarily sourced from Australia and South Africa. In Canada, macadamia milk products reflect consumer willingness to pay for creaminess and omega-7 benefits. Europe held a notable share of the macadamia nuts market in 2025 and is projected to grow at a moderate rate. Growth is constrained by mature snack segments, however, Germany and the Netherlands continue to serve as key re-export hubs for African kernels to the wider European Union. Middle Eastern countries consider nuts as essential food items, with Saudi Arabia streamlining import procedures to increase protein source diversity.


Regulatory Landscape
Food safety and contaminant rules shape market access for macadamia kernels and derived ingredients, especially into the EU, China, and the United States. In the EU, Commission Regulation (EU) 2023/915 sets maximum contaminant levels (including mycotoxins), which has reinforced intensified aflatoxin testing and higher rejection risk for non-compliant lots. This increases the need for controlled post-harvest handling and documented quality systems. China applies its GB 2761 contaminant standard for tree nuts and, from June 2026, implements GACC Decree No. 280, tightening customs registration provisions for overseas manufacturers exporting food into China.
Trade and market-ordering policies also create compliance and cost differences by origin. The United States maintains phytosanitary restrictions under 7 CFR 319.56-11, limiting imports of macadamias in the husk or shell (with narrow exceptions), which supports a continued shift toward processed kernel trade for many exporters. In Australia, statutory levies for macadamias are governed by the Primary Industries (Excise) Levies Act 2024 and Primary Industries (Customs) Charges Act 2024, supporting industry R&D and marketing programs that intersect with residue monitoring and export assurance requirements.
Value Chain Analysis
The global macadamia value chain runs from nurseries and orchard establishment through farm production, post-harvest drying, shelling and sorting, and then export distribution in in-shell and kernel formats. Downstream, secondary processing converts these inputs into oil, pastes, confectionery inclusions, and protein ingredients. Key production centers include South Africa, Australia, China, Kenya, Malawi, and other emerging African origins, with trade flows influenced by China demand for in-shell and the United States and EU preference for kernels. The 2025 global macadamia crop was forecast at 343,310 tonnes (in-shell), reflecting the scale that moves through drying and cracking infrastructure.
Value capture concentrates at processing and certification-enabled export stages, where meeting buyer requirements for HACCP-based food safety systems and widely requested facility certifications (BRCGS or FSSC 22000) determines access to premium retail and ingredient channels. In Australia, a statutory levy of 26c/kg of dried kernel (as of 1 January 2025) is managed via Hort Innovation to fund R&D and marketing, which supports upstream productivity and demand creation activities. Quality and compliance systems such as Australias National Residue Survey (NRS) also reinforce export credibility, with the program reporting 98.7% compliance in 2024-2025. Bottlenecks still center on weather-driven supply swings, financing conditions for orchard investments, and smaller operators ability to fund traceability and controlled-storage upgrades.
Competitive Landscape
The macadamia nuts market exhibits moderate concentration, with the top processors controlling a significant portion of the market revenue in 2025. Marquis Macadamias leverages assets across multiple regions to mitigate risks associated with crop fluctuations[3]Source: Marquis Group, “Sustainability and Traceability Initiatives,” marquis-group.com. South African aggregators, Green and Gold Macadamias and Golden Macadamias, channel smallholder production into premium export programs equipped with aflatoxin testing. Horizontal consolidation continues as processors acquire orchards to secure raw material access and protect margins from price volatility.
Protein concentrate remains an under-served niche, with only a few processors operating dedicated enzymatic production lines. Wholesale prices are significantly higher than other protein isolates, but supply bottlenecks limit market penetration to high-end sports nutrition brands. Vietnamese producers aim to offer competitive pricing due to labor cost advantages, though quality challenges persist in humid climates. High capital requirements for cold-press oil units and traceability platforms favor well-funded players.
Technology differentiation is increasingly critical in the macadamia nuts market. Marquis Macadamias has implemented blockchain initiatives to verify product origins and ensure compliance with environmental regulations. Smaller cooperatives face challenges in adopting such systems due to high onboarding costs, widening the gap between large-scale players and smaller suppliers. The adoption of climate-controlled storage further consolidates volumes around tier-one processors. Mid-sized regional specialists primarily focus on marketing organic or single-estate provenance products through direct-to-consumer channels.
Market Opportunities and Future Outlook
Premium demand pull-through continues to create room for higher-value, identity-preserved kernels and ingredients, supported by measurable price premia in direct-trade channels and compliance-driven sourcing programs. Blockchain-enabled traceability platforms have been used to secure 8% to 10% kernel price premiums where orchard-level provenance and processing timestamps are required by multinational buyers. This aligns with the EU Deforestation Regulation documentation burden and reinforces opportunities for processors that can combine digital traceability with audited sustainability claims. At the same time, tightening contaminant controls raises the business case for investments in dehumidification, hermetic storage, and in-house lab capability, which tends to concentrate export-ready volumes among better-capitalized processors. The cited controls include EU contaminant limits under Regulation (EU) 2023/915 and Chinas aflatoxin B1 limit under GB 2761 for tree nuts.
On the supply side, productivity and resilience programs open pathways in genetics, orchard management services, and integrated processing. In Australia, levy-funded R&D activity and multi-year research programs have expanded, including QAAFI work announced in August 2025 applying genomic selection and phenomics to shorten variety release cycles. A five-year project (MC24003) commenced in January 2026 with the Queensland Department of Primary Industries and Griffith University, targeting yield drivers and harvest efficiency. Investor and corporate interest in regenerative and carbon-linked land management provides another route for orchard financing and landscape-scale projects, including Apples confirmation of support for Queensland macadamia orchard regenerative land management projects via the Restore Fund in May 2026 in collaboration with Climate Asset Management.
Recent Industry Developments
- June 2026: China implemented GACC Decree No. 280, revising the customs registration provisions for overseas manufacturers exporting food into the country. The change increased the importance of exporter registration discipline and documentation for macadamia processors targeting China, particularly as trade expands beyond in-shell flows into higher-value kernel formats.
- May 2026: Apple confirmed investment in Queensland macadamia orchard regenerative land management projects via the Restore Fund in collaboration with Climate Asset Management. The move brought additional institutional visibility to macadamia-linked natural capital projects and supported on-farm adoption of practices tied to verified sustainability outcomes that premium buyers increasingly request.
- March 2024: Premier Nut launched value-added macadamia products, including a cold-pressed oil (Sutton Pressed), a roasted macadamia spread (MacaPaste), and flavored roasted kernels (Snackadamia). The launches expanded downstream formats beyond commodity kernels and showed how processors use oil and other derivatives to diversify revenue and improve margin resilience.


Research Methodology Framework and Report Scope
Market Definition and Coverage
This market is defined as the global value of macadamia nuts traded and consumed as edible nuts, tracked across supply, demand, and pricing signals through the year. We treat the market in USD terms and align it with the macadamia nut value chain from producing origins to end consumption.
Scope exclusions: Macadamia-based cosmetics inputs and non-edible derivatives are excluded unless they are explicitly traded as macadamia nuts.
Segmentation Overview
- By Geography
- North America
- United States
- Production Analysis (Production Volume)
- Consumption Analysis (Consumption Value and Volume)
- Import Market Analysis (Import Value, Volume, and Key Supplying Markets)
- Export Market Analysis (Export Value, Volume, and Key Destination Markets)
- Wholesale Price Trend Analysis and Forecast
- Regulatory Framework
- List of Key Players
- Logistics and Infrastructure
- Seasonality Analysis
- Canada
- Production Analysis (Production Volume)
- Consumption Analysis (Consumption Value and Volume)
- Import Market Analysis (Import Value, Volume, and Key Supplying Markets)
- Export Market Analysis (Export Value, Volume, and Key Destination Markets)
- Wholesale Price Trend Analysis and Forecast
- Regulatory Framework
- List of Key Players
- Logistics and Infrastructure
- Seasonality Analysis
- United States
- South America
- Brazil
- Production Analysis (Production Volume)
- Consumption Analysis (Consumption Value and Volume)
- Import Market Analysis (Import Value, Volume, and Key Supplying Markets)
- Export Market Analysis (Export Value, Volume, and Key Destination Markets)
- Wholesale Price Trend Analysis and Forecast
- Regulatory Framework
- List of Key Players
- Logistics and Infrastructure
- Seasonality Analysis
- Colombia
- Production Analysis (Production Volume)
- Consumption Analysis (Consumption Value and Volume)
- Import Market Analysis (Import Value, Volume, and Key Supplying Markets)
- Export Market Analysis (Export Value, Volume, and Key Destination Markets)
- Wholesale Price Trend Analysis and Forecast
- Regulatory Framework
- List of Key Players
- Logistics and Infrastructure
- Seasonality Analysis
- Brazil
- Europe
- Netherlands
- Production Analysis (Production Volume)
- Consumption Analysis (Consumption Value and Volume)
- Import Market Analysis (Import Value, Volume, and Key Supplying Markets)
- Export Market Analysis (Export Value, Volume, and Key Destination Markets)
- Wholesale Price Trend Analysis and Forecast
- Regulatory Framework
- List of Key Players
- Logistics and Infrastructure
- Seasonality Analysis
- France
- Production Analysis (Production Volume)
- Consumption Analysis (Consumption Value and Volume)
- Import Market Analysis (Import Value, Volume, and Key Supplying Markets)
- Export Market Analysis (Export Value, Volume, and Key Destination Markets)
- Wholesale Price Trend Analysis and Forecast
- Regulatory Framework
- List of Key Players
- Logistics and Infrastructure
- Seasonality Analysis
- United Kingdom
- Production Analysis (Production Volume)
- Consumption Analysis (Consumption Value and Volume)
- Import Market Analysis (Import Value, Volume, and Key Supplying Markets)
- Export Market Analysis (Export Value, Volume, and Key Destination Markets)
- Wholesale Price Trend Analysis and Forecast
- Regulatory Framework
- List of Key Players
- Logistics and Infrastructure
- Seasonality Analysis
- Germany
- Production Analysis (Production Volume)
- Consumption Analysis (Consumption Value and Volume)
- Import Market Analysis (Import Value, Volume, and Key Supplying Markets)
- Export Market Analysis (Export Value, Volume, and Key Destination Markets)
- Wholesale Price Trend Analysis and Forecast
- Regulatory Framework
- List of Key Players
- Logistics and Infrastructure
- Seasonality Analysis
- Netherlands
- Asia-Pacific
- China
- Production Analysis (Production Volume)
- Consumption Analysis (Consumption Value and Volume)
- Import Market Analysis (Import Value, Volume, and Key Supplying Markets)
- Export Market Analysis (Export Value, Volume, and Key Destination Markets)
- Wholesale Price Trend Analysis and Forecast
- Regulatory Framework
- List of Key Players
- Logistics and Infrastructure
- Seasonality Analysis
- Australia
- Production Analysis (Production Volume)
- Consumption Analysis (Consumption Value and Volume)
- Import Market Analysis (Import Value, Volume, and Key Supplying Markets)
- Export Market Analysis (Export Value, Volume, and Key Destination Markets)
- Wholesale Price Trend Analysis and Forecast
- Regulatory Framework
- List of Key Players
- Logistics and Infrastructure
- Seasonality Analysis
- Vietnam
- Production Analysis (Production Volume)
- Consumption Analysis (Consumption Value and Volume)
- Import Market Analysis (Import Value, Volume, and Key Supplying Markets)
- Export Market Analysis (Export Value, Volume, and Key Destination Markets)
- Wholesale Price Trend Analysis and Forecast
- Regulatory Framework
- List of Key Players
- Logistics and Infrastructure
- Seasonality Analysis
- Japan
- Production Analysis (Production Volume)
- Consumption Analysis (Consumption Value and Volume)
- Import Market Analysis (Import Value, Volume, and Key Supplying Markets)
- Export Market Analysis (Export Value, Volume, and Key Destination Markets)
- Wholesale Price Trend Analysis and Forecast
- Regulatory Framework
- List of Key Players
- Logistics and Infrastructure
- Seasonality Analysis
- China
- Middle East
- Saudi Arabia
- Production Analysis (Production Volume)
- Consumption Analysis (Consumption Value and Volume)
- Import Market Analysis (Import Value, Volume, and Key Supplying Markets)
- Export Market Analysis (Export Value, Volume, and Key Destination Markets)
- Wholesale Price Trend Analysis and Forecast
- Regulatory Framework
- List of Key Players
- Logistics and Infrastructure
- Seasonality Analysis
- Saudi Arabia
- Africa
- South Africa
- Production Analysis (Production Volume)
- Consumption Analysis (Consumption Value and Volume)
- Import Market Analysis (Import Value, Volume, and Key Supplying Markets)
- Export Market Analysis (Export Value, Volume, and Key Destination Markets)
- Wholesale Price Trend Analysis and Forecast
- Regulatory Framework
- List of Key Players
- Logistics and Infrastructure
- Seasonality Analysis
- Kenya
- Production Analysis (Production Volume)
- Consumption Analysis (Consumption Value and Volume)
- Import Market Analysis (Import Value, Volume, and Key Supplying Markets)
- Export Market Analysis (Export Value, Volume, and Key Destination Markets)
- Wholesale Price Trend Analysis and Forecast
- Regulatory Framework
- List of Key Players
- Logistics and Infrastructure
- Seasonality Analysis
- South Africa
- North America
Data Sources, Market Sizing, and Validation
Desk Research
For the desk work, we start with the factual base on supply, trade, and pricing, then map it to demand signals by region. Useful public inputs include FAOSTAT for crop and tree-nut series, UN Comtrade for import and export flows, USDA and other agriculture statistics portals for demand and price context, and customs or port authority releases where shipment patterns are discussed.
We also use company annual reports, investor presentations, and credible press coverage to track capacity moves, orchard development timelines, and product mix changes that can shift the pricing curve. Select paid subscriptions for company financials and intelligence, patent databases, and shipment-level trade databases are used to fill gaps where public datasets lag. The sources listed above are illustrative, and we also relied on additional public documents and datasets for data collection, cross-checking, and clarification.
Primary Interviews and Surveys
Primary discussions are used to sanity check the trade-led picture against what growers, processors, traders, and large buyers are seeing in the most recent selling season. Since this is a global market, we balance inputs across producing origins and major consuming regions, and we revisit assumptions on kernel recovery, contract versus spot pricing behavior, and the pace of new orchard supply as conditions change.
Distribution of primary research fieldwork respondents
| Company type | Respondent position | Region |
|---|---|---|
| Top tier: 39% | CXOs: 12% | APAC: 49% |
| Mid tier: 44% | Functional/Unit leaders: 40% | EMEA: 32% |
| Smaller Players: 17% | Managers: 48% | Americas: 19% |
Market-Sizing & Forecasting
Sizing starts with a top-down build where production, trade, and wholesale pricing series are stitched together to reconstruct the edible macadamia nut demand pool by region and year. The model is then corroborated with selective bottom-up approximations such as sampled price per kilogram by grade and channel, along with supplier and buyer checks on typical contract volumes. Totals are adjusted if the first pass appears inconsistent with the trade and pricing inputs.
Key inputs used in the model include reported production volumes in metric tons, import and export volumes and values, wholesale price trends, estimated shell-to-kernel recovery rates where needed for comparability, and region-level consumption shifts linked to bakery, confectionery, and snack demand. When a data series is missing or lagged for a country, we bridge it using nearby origin trade flows, seasonality patterns, and pricing spreads that were confirmed in interviews.
For the forecast, scenario analysis is used so that supply ramp-ups, price normalization, and demand elasticity can be tested together without overfitting the history. Assumptions for yield cycles, new orchard maturity timelines, and expected pricing progression are taken from expert consensus and applied consistently across regions.
Data Validation & Update Cycle
Outputs are checked against independent signals like trade balance consistency, implied per-capita consumption direction, and price-volume relationships expected to hold across seasons. When the model shows a sudden jump that cannot be explained by production or trade, we run variance checks, re-open the underlying drivers, and, if needed, re-contact sources to confirm whether it was a reporting change or a real market move.
Before sign-off, the work goes through a multi-step analyst review where assumptions, conversions, and year alignment are rechecked, followed by a final numbers pass close to delivery. The report is refreshed annually, and interim updates are triggered when material events occur, such as major crop shortfalls, policy changes affecting trade, or sharp wholesale price swings.
Mordor Intelligence's Global Macadamia Market Sizing Compared With Other Published Estimates
Published market sizes for macadamia often differ because researchers do not all count the same products, and the same year can be anchored to different price points. Differences also show up when one estimate leans on retail value for packaged nuts, while another stays closer to bulk trade and wholesale prices.
The main gap drivers in this market are whether non-edible uses like cosmetics are included, how in-shell versus kernel conversions are handled, and how import and export values are normalized when currencies and contract terms shift. Another common reason is refresh cadence, because a single season of price volatility can move the value estimate materially, and it helps to validate the change with trade flows and wholesale pricing signals before locking the year, which is how the 2026 value is treated in Mordor Intelligence.
Benchmark comparison
| Source | Market Size | Gaps in Research Methodology |
|---|---|---|
| Mordor Intelligence | USD 1.95 B (2026) | |
| Global Consultancy A | USD 3.01 B (2024) | Uses a broader macadamia scope that appears to include non-edible applications and channel-led value capture, which can lift the total above an edible nut and wholesale-price anchored view, and it also anchors on a different base year. |
| Industry Publisher B | USD 2.60 B (2025) | Builds the total using form and retail channel splits that can embed downstream margins, and the year selection and price timing can differ from a trade and wholesale price normalized approach. |
Across the three published figures, the spread is mostly explained by scope and pricing basis rather than disagreement on underlying demand direction. By keeping the value tied to trade, production, and wholesale price checks, and by re-validating conversion and season effects through interviews, the estimate stays traceable to clear variables and repeatable steps for year-over-year updates.


Key Questions Answered in the Report
What is the forecast value of the macadamia nuts market in 2031?
The macadamia nuts market is projected to reach USD 3.02 billion by 2031.
Which region currently consumes the most macadamias?
Asia-Pacific leads with 46.0% of global volume in 2025, driven by Chinese demand.
Why are macadamias favored in plant-based dairy products?
Their high monounsaturated-fat content creates a creamy texture that reduces the need for additives.
How long does a macadamia orchard take to achieve full yields?
Trees generally attain full productivity about 15 years after planting.
How does blockchain add value to supply chains?
Distributed-ledger systems let buyers verify orchard-level data which secures 8-10% price premiums in direct trade channels.
Page last updated on:




