
Avocado Market Size and Share
Avocado Market Analysis by Mordor Intelligence
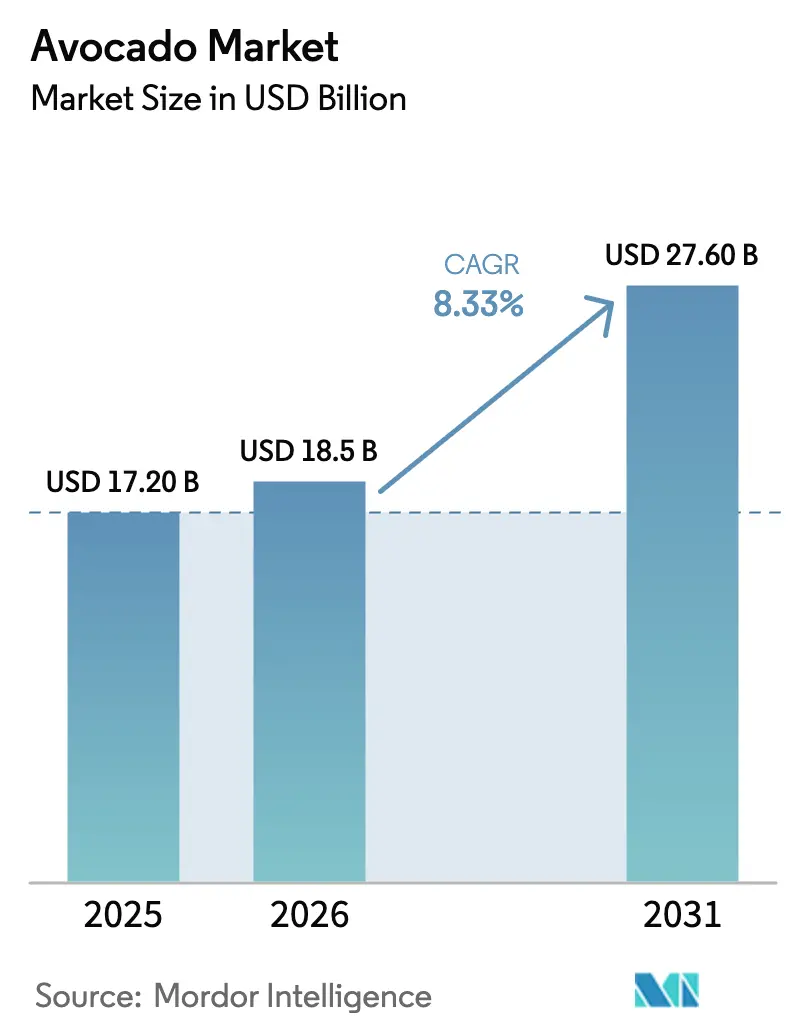
The avocado market size is projected to expand from USD 17.2 billion in 2025 and USD 18.5 billion in 2026 to USD 27.6 billion by 2031, registering a CAGR of 8.33% between 2026 to 2031. This growth is fueled by a rising consumer shift towards plant-based diets, an increase in ready-to-eat offerings in both retail and foodservice sectors, and strategic cold-chain investments that ensure fruit quality over extended supply routes[1]. Quick-service restaurants are increasingly featuring avocados on their menus, bolstered by traceability programs that command sustainability premiums and high-density orchard practices that boost yields. Controlled-atmosphere shipping safeguards producer margins while tariff reductions pave the way for new markets, particularly in Asia. The competitive landscape is characterized by moderate rivalry as vertically integrated leaders adeptly blend multi-origin sourcing with exclusive ripening networks, curbing the bargaining power of fragmented growers. Suppliers stand to gain by certifying organic produce, harnessing blockchain for traceability, or focusing on counter-seasonal exports to address supply voids in northern-hemisphere markets.
Key Report Takeaways
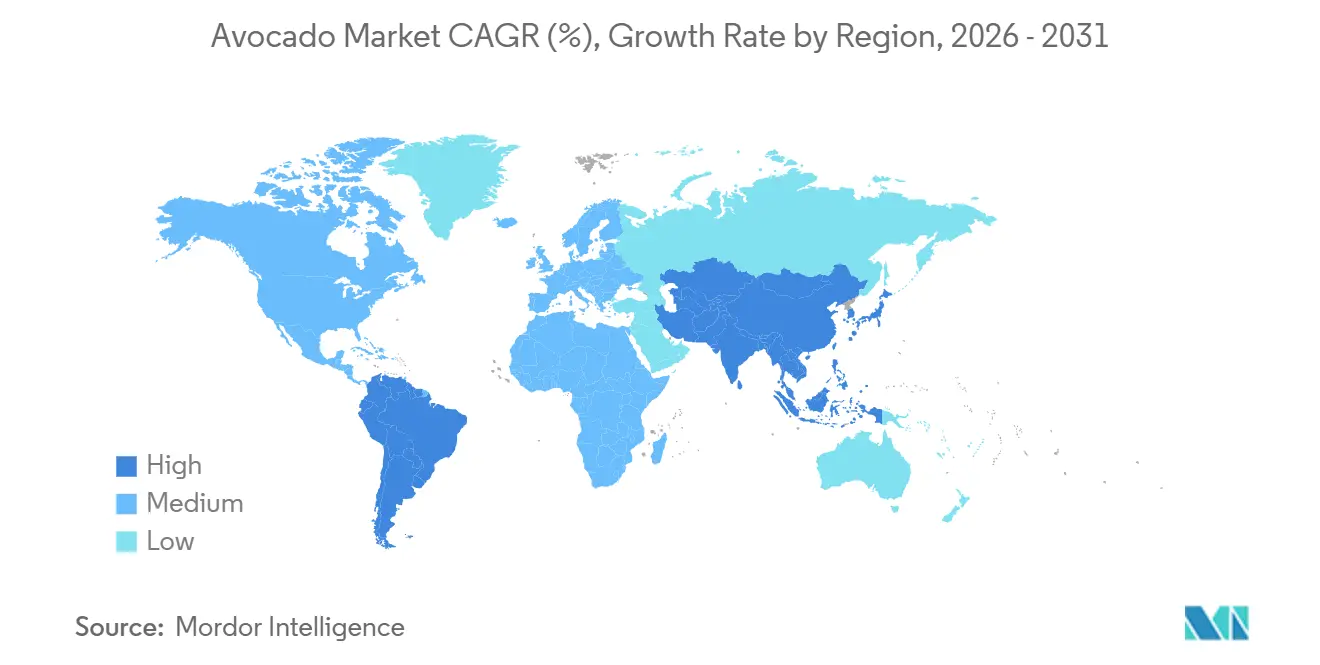
- By geography, North America led with 35% of the avocado market size in 2025. The Asia-Pacific region is projected to expand at a 9.4% CAGR through 2031, the fastest among all regions.
Note: Market size and forecast figures in this report are generated using Mordor Intelligence’s proprietary estimation framework, updated with the latest available data and insights as of January 2026.
Global Avocado Market Trends and Insights
Drivers Impact Analysis*
| Driver | (~) % Impact on CAGR Forecast | Geographic Relevance | Impact Timeline |
|---|---|---|---|
| Rising global consumer preference for healthy fats and plant-based diets | +2.1% | Global, with strongest uptake in North America, Europe, and urban Asia-Pacific | Medium term (2-4 years) |
| Strong growth of guacamole and ready-to-eat avocado products in foodservice and retail | +1.8% | North America, Europe, and emerging South American urban centers | Short term (≤ 2 years) |
| Expanding trade liberalization and lower tariffs among major importers | +1.4% | Asia-Pacific (China, Japan), Europe (EU-Peru FTA), and North America (USMCA) | Long term (≥ 4 years) |
| Continuous yield gains via high-density planting and drip irrigation | +1.2% | South America (Peru, Chile, Colombia), Mexico, and South Africa | Medium term (2-4 years) |
| Controlled-atmosphere maritime shipping extending shelf-life | +0.9% | Global, with highest adoption on Peru and Mexico-to-Europe routes | Medium term (2-4 years) |
| Blockchain-enabled origin traceability unlocking premium pricing | +0.6% | Europe, North America, and high-value Asia-Pacific markets (Japan, South Korea) | Long term (≥ 4 years) |
| Source: Mordor Intelligence | |||
Rising Global Consumer Preference for Healthy Fats and Plant-Based Diets
Avocados have transitioned from a niche produce to a daily staple, driven by an increased emphasis on wellness. In 2024, the United States' per-capita avocado consumption exceeded 9 pounds, driven by the growing popularity of the fruit among millennials and Generation Z in ketogenic and Mediterranean diets. Germany and the United Kingdom led Europe in a surge of demand, both reporting double-digit increases in imports. This uptick was largely due to vegan meal kits highlighting avocados as a substitute for mayonnaise and butter. Meanwhile, in China, urban centers adopted the Western trend, spurred by social media influencers championing avocado toast. With health considerations now central to purchasing decisions, avocado demand remains steady even amidst economic downturns. Thus, the avocado market's growth aligns more with wellness trends than with traditional commodity cycles.
Strong Growth of Guacamole and Ready-to-Eat Avocado Products in Foodservice and Retail
Quick-service restaurants have popularized avocado by incorporating it into burritos, burgers, and breakfast sandwiches. In 2024, Chipotle Mexican Grill, under multi-year contracts, sourced over 130 million pounds of avocado, ensuring stable income for growers. Subway's introduction of spreadable avocado at 20,000 United States outlets spurred an additional demand of 15 million pounds. Meanwhile, McDonald's European pilots hint at wider rollouts. Retailers now offer vacuum-sealed avocado halves and single-serve guacamole cups, boasting a 21-day freshness. This innovation not only curbs household waste but also transforms occasional users into regular buyers. These moves expand avocado's appeal beyond the classic guacamole dip, steering the market towards consistent, repeat purchases of these items.
Expanding Trade Liberalization and Lower Tariffs Among Major Importers
High-growth destinations have seen historic barriers dismantled due to tariff rollbacks. The United States-Mexico-Canada Agreement solidified Mexico's 85% share of the United States' imports by eliminating remaining duties, ensuring a seamless supply chain. Meanwhile, the European Union-Peru Free Trade Agreement is projected to eliminate tariffs by 2024, positioning Peru to capture 35% of the European Union's avocado imports. In a significant move, China approved the entry of Mexican Hass avocados in 2024 after finalizing phytosanitary protocols. This decision not only broadened Mexico's market access but also marked a shift in a territory previously dominated by Chile. With lowered tariffs compressing landed costs, exporters are reinvesting these savings in cold-chain infrastructure, paving the way to previously distant markets. As a testament to the benefits of such tariff eliminations, Colombia witnessed a 60-70% increase in exports to Japan in 2024.
Continuous Yield Gains via High-Density Planting and Drip Irrigation
By adopting systems with 400 to 600 trees per hectare, producers are boosting output without expanding acreage. These systems deliver harvestable fruit in the third year and increase mature yields by 25%. In Peru, most orchards have switched to drip irrigation, resulting in a 40% reduction in water use and enhanced caliber consistency. Chile's use of soil-moisture sensors has resulted in an 18% reduction in input costs, enabling the maintenance of steady yields in 2024, even during a prolonged drought. In Mexico, fertigation programs have cut fertilizer waste by 22% and reduced production costs by USD 0.08 per kilogram. These innovations not only safeguard grower margins but also cater to the rising demand in the avocado market.
Restraints Impact Analysis*
| Restraint | (~) % Impact on CAGR Forecast | Geographic Relevance | Impact Timeline |
|---|---|---|---|
| Climate variability and intensified drought risk in key producing zones | -1.6% | Mexico (Michoacán), California, Peru (Ica, La Libertad), Chile (Valparaíso) | Short term (≤ 2 years) |
| Volatile ocean-freight costs compressing exporter margins | -1.1% | Global, with the highest exposure on South America-to-Europe and South America-to-Asia-Pacific routes | Short term (≤ 2 years) |
| Heightened deforestation scrutiny that may trigger stricter import rules | -0.8% | Europe , North America (NGO campaigns), and the emerging in Asia-Pacific | Long term (≥ 4 years) |
| Farm-labor shortages and rising wages inflating production costs | -0.7% | Mexico, Chile, Peru, South Africa, and California | Medium term (2-4 years) |
| Source: Mordor Intelligence | |||
Heightened Deforestation Scrutiny that may Trigger Stricter Import Rules
Starting in December 2025, the European Union's Deforestation Regulation requires chain-of-custody proof for all imports[2]. Buyers in North America are increasingly adopting similar voluntary standards due to growing pressure from consumer advocates. Exporters that fail to implement geospatial audits face a significant risk of being excluded from the market. Rising compliance costs are likely to create challenges for small cooperatives, potentially forcing them out of the market. This situation could drive further consolidation in the avocado industry, as larger players absorb smaller entities that struggle to meet the new requirements.
Farm-Labor Shortages and Rising Wages Inflating Production Costs
Labor supply tightened as rural migration declined. In the 2024 harvest season, Chile and Peru reported a 15% wage increase to address labor shortages. Mexican growers increased wages to retain pickers during overlapping strawberry harvests. California operations faced challenges due to competition from higher-paying almond orchards. Mechanization options remain limited because fruits bruise easily, which continues to make labor a critical cost driver in the avocado market.
*Our forecasts treat driver/restraint impacts as directional, not additive. The impact forecasts reflect baseline growth, mix effects, and variable interactions.
Geography Analysis
North America held 35% of the avocado market share in 2025, largely due to its geographical advantages. Orchards in Michoacán can deliver fruit to distribution centers in Texas within 48 hours, outpacing maritime shipments from South America by over a week. The United States-Mexico-Canada Agreement, with zero tariffs, reduces landed costs. Controlled-ripening warehouses situated near Chicago and New York City ensure retail chains receive consistently high-quality produce. Canada, though starting from a smaller base, is witnessing nearly double-digit growth, fueled by an increasing immigrant population that is incorporating avocados into their traditional dishes.
Asia-Pacific is the fastest-growing regional segment, projected to post a 9.4% CAGR through 2031. In 2024, imports into China rose significantly, driven by e-commerce platforms bundling avocados with cooking tutorials and other related content. Japan followed with notable imports, supported by the rollouts of convenience stores and innovations related to sushi. These factors establish Asia-Pacific as a key growth area for the avocado market.
South America serves as the main counter-seasonal supplier for Europe and Asia. In 2024, Peru exported significant volumes after the lifting of drip-irrigation subsidies, which increased yields during droughts[3]. Chile managed to export substantial quantities despite facing water stress. They achieved this by shifting production to cooler coastal valleys that retained moisture, enabling exporters to command higher prices for larger fruit sizes. Meanwhile, Colombia's newer orchards, now at full productivity, contributed additional volumes, marking a shift from their traditional coffee revenue.
Spain and the Netherlands predominantly influence Europe's market share. In 2024, Spanish farms in Andalusia produced significant quantities, meeting local summer demand and reducing the need for imports. The port of Rotterdam handled large volumes, re-exporting a notable portion within just 36 hours, supported by advanced ripening centers. Moving forward, exporters with blockchain or satellite proof of forest-free orchards will have an edge under the European Union's deforestation mandate.
While the Middle East and Africa hold significant growth potential. In 2024, Kenya exported notable quantities to the European Union and the UAE, capitalizing on two annual harvests made possible by bimodal rainfall. South Africa, emphasizing premium certified fruits, achieved a price premium through organic and Fairtrade certifications. Meanwhile, Israel, leveraging its expertise in drip irrigation, maintains robust yields in its arid regions and caters to both domestic and select European markets.
Mordor Intelligence provides coverage of the avocado market across other key regional markets. Detailed country-level analysis extends to Spain and Japan incorporating local coverage and market participation, as required.
Regulatory Landscape
Global avocado trade is shaped by phytosanitary and food-safety market-access requirements that differ by importer, with increasing emphasis on systems-based compliance and documented traceability. In the United States, USDA APHIS sets commodity import requirements through instruments such as the ACIR database and operational workplans. This includes Central American supply updates, with APHIS authorizing Hass avocado imports from Guatemala in November 2024, followed by revised Guatemala requirements in April 2025 to address stem weevil (Copturus aguacatae) risk under an operational workplan.
In Europe, the European Commission plant-health framework requires inspections and phytosanitary documentation for non-EU plant products, and compliance pressure has increased around sustainability and border checks. Starting in December 2025, the EU Deforestation Regulation requires chain-of-custody evidence for imports, and in 2026 the EU also updated frequency rates for plant import controls that include avocado (Persea americana) from non-EU countries, reinforcing routine identity and physical checks alongside phytosanitary oversight. Trade-policy debates continue to affect North America, with California industry groups advocating for seasonal tariff-rate quotas for Mexican avocados during the California marketing window, reflecting heightened scrutiny across import policy and inspection regimes.
Value Chain Analysis
The avocado value chain runs from nursery inputs (rootstock/seedlings), through farm production (irrigation, fertigation, crop protection, labor) and harvesting, to packing and grading, export documentation and phytosanitary clearance, and cold-chain logistics (pre-cooling and controlled-atmosphere containers). After import clearance, the fruit moves to ripening and then downstream distribution to retail and foodservice, with growing volumes of minimally processed formats such as pulp, guacamole, and oil.
Coordination sits with a mix of fragmented growers, cooperatives, and vertically integrated marketers and packers that manage multi-origin sourcing and ripening networks, including embedded roles for industry bodies and regulators such as APEAM and USDA APHIS in North America export protocols. Value capture and risk concentrate around post-harvest handling and logistics, where quality outcomes depend heavily on ripening infrastructure near demand centers and on controlled-atmosphere maritime shipping that extends shelf life by up to 21 days. In 2025, major route bottlenecks cited across the market include inspection-related delays, adverse weather impacts, road and port congestion, and periodic supply saturation in primary import markets, which increases the value of diversified origin programs (Mexico, Peru, Chile, Colombia, Kenya, South Africa) and resilient cold-chain capacity. Sustainability verification has also become part of core chain requirements, with the Mexican industrys Path to Sustainability program and subsequent zero-deforestation commitments aligning exporters, packers, and buyers around geospatial and chain-of-custody documentation and supporting more formalized, auditable supply chains.
Competitive Landscape
Moderate competitive intensity characterizes the market, with vertically integrated leaders seamlessly blending multi-country orchards, packing facilities, and ripening centers to align with customer delivery windows. In the third quarter of 2024, Mission Produce reported revenue of USD 324.0 million. Additionally, the company expanded its Oxnard warehouse by 120,000 square feet to enhance its controlled-atmosphere capacity, which is anticipated to meet the rising demand. Major firms, through direct contracts with ocean carriers, secure controlled-atmosphere shipping, ensuring predictable freight pricing and optimal fruit ripeness upon arrival. In contrast, smaller cooperatives in regions such as Kenya and Colombia face the potential for marginalization, as they lack the capital to implement blockchain traceability or meet the rising costs of wages.
Technology adoption stands out as the key differentiator in the industry. For instance, pilots by IBM Food Trust achieved a notable 7% premium in European supermarkets as shoppers engaged with QR codes for orchard data. Furthermore, precision-agriculture start-ups utilize satellite imagery in irrigation models, achieving a reduction in water use and forecasting harvest volumes with 90% accuracy. This capability allows integrated packers to secure retail promotions months in advance. A surge in mergers, joint ventures, and partnerships is anticipated as mid-tier exporters aim to share cold-chain infrastructure and negotiate collective freight contracts to navigate rate fluctuations.
Market Opportunities and Future Outlook
Compliance-led differentiation is a practical opportunity across exporting origins as importers tighten environmental and phytosanitary requirements. With the EU Deforestation Regulation taking effect from December 2025, importers are pushing for geospatially verified, forest-free supply, and Mexico has moved to formalize this pathway. In April 2026, APEAM signed a Zero Deforestation Agreement with SEMARNAT and PROFEPA, providing exporters and packers with a framework to standardize evidence and maintain access to higher-value channels that place price weight on sustainability and traceability. Blockchain-enabled traceability has also been tested in-market, with IBM Food Trust pilots cited as achieving a 7% premium in European supermarkets when shoppers used QR codes for orchard data.
Another near-term whitespace is the expansion of new or scaled supply and category formats that reduce friction for consumers and foodservice. US imports reached 2.87 billion pounds in 2025, with Mexico supplying 83% of the volume, which anchors the size of existing demand and the commercial value of diversification, counter-seasonal sourcing, and ripening capacity that protects quality and reduces waste. Origin expansion gives buyers more options for managing risk and seasonality, and Brazil is highlighted in trade reporting for a larger Hass harvest footprint in 2026 (around 60,000 metric tons supported by roughly 10,000 to 11,000 hectares). On the demand side, growth in ready-to-eat offerings such as vacuum-sealed halves and single-serve guacamole, plus large QSR procurement programs (including Chipotles 2024 sourcing volumes under multi-year contracts), continues to favor suppliers that deliver consistent sizing, managed ripening, and value-added processing close to import markets.
Recent Industry Developments
- May 2026: Mission Produce completed its acquisition of Calavo Growers, combining sourcing, packing, and distribution assets across North America. The transaction strengthens multi-origin supply flexibility and expands the scale of vertically integrated ripening and logistics networks that large retail and foodservice buyers rely on.
- April 2026: APEAM formalized a Zero Deforestation Agreement with SEMARNAT and PROFEPA for Mexican avocados destined for export. The agreement operationalizes sustainability compliance as part of market access, accelerating adoption of auditable chain-of-custody and land-use verification across growers and packers.
- November 2024: USDA APHIS authorized the importation of Hass avocados from Guatemala into the United States under specified phytosanitary measures. This approval broadened the pool of eligible origins for US buyers and increased competitive pressure on existing supply corridors by adding an additional nearby sourcing option.
Research Methodology Framework and Report Scope
Market Definition and Coverage
For this study, we size the avocado market as the value created from avocados sold into the formal supply chain, combining domestic consumption and trade flows across producing and importing countries. Values are built from measurable volumes and observable price signals, so the totals reflect real market activity.
Scope exclusions: We exclude informal backyard or wild-harvested fruit that does not enter organized commercial channels.
Segmentation Overview
- By Geography
- North America
- United States
- Production Analysis (Area Harvested, Yield, and Production Volume)
- Consumption Analysis (Consumption Value and Volume)
- Import Market Analysis (Import Value, Volume, and Key Supplying Markets)
- Export Market Analysis (Export Value, Volume, and Key Destination Markets)
- Wholesale Price Trend Analysis and Forecast
- Regulatory Framework
- List of Key Players
- Logistics and Infrastructure
- Seasonality Analysis
- Mexico
- Production Analysis (Area Harvested, Yield, and Production Volume)
- Consumption Analysis (Consumption Value and Volume)
- Import Market Analysis (Import Value, Volume, and Key Supplying Markets)
- Export Market Analysis (Export Value, Volume, and Key Destination Markets)
- Wholesale Price Trend Analysis and Forecast
- Regulatory Framework
- List of Key Players
- Logistics and Infrastructure
- Seasonality Analysis
- United States
- Europe
- Morocco
- Production Analysis (Area Harvested, Yield, and Production Volume)
- Consumption Analysis (Consumption Value and Volume)
- Import Market Analysis (Import Value, Volume, and Key Supplying Markets)
- Export Market Analysis (Export Value, Volume, and Key Destination Markets)
- Wholesale Price Trend Analysis and Forecast
- Regulatory Framework
- List of Key Players
- Logistics and Infrastructure
- Seasonality Analysis
- Spain
- Production Analysis (Area Harvested, Yield, and Production Volume)
- Consumption Analysis (Consumption Value and Volume)
- Import Market Analysis (Import Value, Volume, and Key Supplying Markets)
- Export Market Analysis (Export Value, Volume, and Key Destination Markets)
- Wholesale Price Trend Analysis and Forecast
- Regulatory Framework
- List of Key Players
- Logistics and Infrastructure
- Seasonality Analysis
- Netherlands
- Production Analysis (Area Harvested, Yield, and Production Volume)
- Consumption Analysis (Consumption Value and Volume)
- Import Market Analysis (Import Value, Volume, and Key Supplying Markets)
- Export Market Analysis (Export Value, Volume, and Key Destination Markets)
- Wholesale Price Trend Analysis and Forecast
- Regulatory Framework
- List of Key Players
- Logistics and Infrastructure
- Seasonality Analysis
- Russia
- Production Analysis (Area Harvested, Yield, and Production Volume)
- Consumption Analysis (Consumption Value and Volume)
- Import Market Analysis (Import Value, Volume, and Key Supplying Markets)
- Export Market Analysis (Export Value, Volume, and Key Destination Markets)
- Wholesale Price Trend Analysis and Forecast
- Regulatory Framework
- List of Key Players
- Logistics and Infrastructure
- Seasonality Analysis
- Morocco
- Asia-Pacific
- India
- Production Analysis (Area Harvested, Yield, and Production Volume)
- Consumption Analysis (Consumption Value and Volume)
- Import Market Analysis (Import Value, Volume, and Key Supplying Markets)
- Export Market Analysis (Export Value, Volume, and Key Destination Markets)
- Wholesale Price Trend Analysis and Forecast
- Regulatory Framework
- List of Key Players
- Logistics and Infrastructure
- Seasonality Analysis
- Philippines
- Production Analysis (Area Harvested, Yield, and Production Volume)
- Consumption Analysis (Consumption Value and Volume)
- Import Market Analysis (Import Value, Volume, and Key Supplying Markets)
- Export Market Analysis (Export Value, Volume, and Key Destination Markets)
- Wholesale Price Trend Analysis and Forecast
- Regulatory Framework
- List of Key Players
- Logistics and Infrastructure
- Seasonality Analysis
- China
- Production Analysis (Area Harvested, Yield, and Production Volume)
- Consumption Analysis (Consumption Value and Volume)
- Import Market Analysis (Import Value, Volume, and Key Supplying Markets)
- Export Market Analysis (Export Value, Volume, and Key Destination Markets)
- Wholesale Price Trend Analysis and Forecast
- Regulatory Framework
- List of Key Players
- Logistics and Infrastructure
- Seasonality Analysis
- Indonesia
- Production Analysis (Area Harvested, Yield, and Production Volume)
- Consumption Analysis (Consumption Value and Volume)
- Import Market Analysis (Import Value, Volume, and Key Supplying Markets)
- Export Market Analysis (Export Value, Volume, and Key Destination Markets)
- Wholesale Price Trend Analysis and Forecast
- Regulatory Framework
- List of Key Players
- Logistics and Infrastructure
- Seasonality Analysis
- India
- South America
- Brazil
- Production Analysis (Area Harvested, Yield, and Production Volume)
- Consumption Analysis (Consumption Value and Volume)
- Import Market Analysis (Import Value, Volume, and Key Supplying Markets)
- Export Market Analysis (Export Value, Volume, and Key Destination Markets)
- Wholesale Price Trend Analysis and Forecast
- Regulatory Framework
- List of Key Players
- Logistics and Infrastructure
- Seasonality Analysis
- Colombia
- Production Analysis (Area Harvested, Yield, and Production Volume)
- Consumption Analysis (Consumption Value and Volume)
- Import Market Analysis (Import Value, Volume, and Key Supplying Markets)
- Export Market Analysis (Export Value, Volume, and Key Destination Markets)
- Wholesale Price Trend Analysis and Forecast
- Regulatory Framework
- List of Key Players
- Logistics and Infrastructure
- Seasonality Analysis
- Chile
- Production Analysis (Area Harvested, Yield, and Production Volume)
- Consumption Analysis (Consumption Value and Volume)
- Import Market Analysis (Import Value, Volume, and Key Supplying Markets)
- Export Market Analysis (Export Value, Volume, and Key Destination Markets)
- Wholesale Price Trend Analysis and Forecast
- Regulatory Framework
- List of Key Players
- Logistics and Infrastructure
- Seasonality Analysis
- Peru
- Production Analysis (Area Harvested, Yield, and Production Volume)
- Consumption Analysis (Consumption Value and Volume)
- Import Market Analysis (Import Value, Volume, and Key Supplying Markets)
- Export Market Analysis (Export Value, Volume, and Key Destination Markets)
- Wholesale Price Trend Analysis and Forecast
- Regulatory Framework
- List of Key Players
- Logistics and Infrastructure
- Seasonality Analysis
- Brazil
- Africa
- South Africa
- Production Analysis (Area Harvested, Yield, and Production Volume)
- Consumption Analysis (Consumption Value and Volume)
- Import Market Analysis (Import Value, Volume, and Key Supplying Markets)
- Export Market Analysis (Export Value, Volume, and Key Destination Markets)
- Wholesale Price Trend Analysis and Forecast
- Regulatory Framework
- List of Key Players
- Logistics and Infrastructure
- Seasonality Analysis
- Kenya
- Production Analysis (Area Harvested, Yield, and Production Volume)
- Consumption Analysis (Consumption Value and Volume)
- Import Market Analysis (Import Value, Volume, and Key Supplying Markets)
- Export Market Analysis (Export Value, Volume, and Key Destination Markets)
- Wholesale Price Trend Analysis and Forecast
- Regulatory Framework
- List of Key Players
- Logistics and Infrastructure
- Seasonality Analysis
- South Africa
- Middle East
- United Arab Emirates
- Production Analysis (Area Harvested, Yield, and Production Volume)
- Consumption Analysis (Consumption Value and Volume)
- Import Market Analysis (Import Value, Volume, and Key Supplying Markets)
- Export Market Analysis (Export Value, Volume, and Key Destination Markets)
- Wholesale Price Trend Analysis and Forecast
- Regulatory Framework
- List of Key Players
- Logistics and Infrastructure
- Seasonality Analysis
- Saudi Arabia
- Production Analysis (Area Harvested, Yield, and Production Volume)
- Consumption Analysis (Consumption Value and Volume)
- Import Market Analysis (Import Value, Volume, and Key Supplying Markets)
- Export Market Analysis (Export Value, Volume, and Key Destination Markets)
- Wholesale Price Trend Analysis and Forecast
- Regulatory Framework
- List of Key Players
- Logistics and Infrastructure
- Seasonality Analysis
- United Arab Emirates
- North America
Data Sources, Market Sizing, and Validation
Desk Research
Desk research starts with building a clean fact base on production, trade, and consumption signals. We rely on public sources such as FAOSTAT for crop output, UN Comtrade for import and export values and volumes, USDA datasets for produce market context, and national statistics offices in key producing and importing countries. For price and market behavior context, we also review association releases and technical publications, along with peer reviewed papers on yields and post-harvest losses.
To translate volumes into value, we cross-check shipment mixes and seasonality using sources like customs bulletins and port level reporting where available, and we use company filings and investor presentations for directional checks on category revenue exposure. In a few steps, paid subscriptions are used only for items like company financials and intelligence, patent lookups around processing methods, and shipment-level import-export records to validate trade splits. The sources listed here are illustrative, and many other references are used during data collection, validation, and clarification.
Primary Interviews and Surveys
Primary work is used to pressure-test the desk inputs and to close gaps that show up when volumes and prices move in opposite directions. We speak with growers, exporters, importers, distributors, and large buyers across the main producing basins and demand markets, and then we re-check assumptions with logistics and cold-chain specialists where volatility is high. These discussions help us confirm realistic price bands, loss rates, varietal mix shifts, and the timing of demand swings by region.
Distribution of primary research fieldwork respondents
| Company type | Respondent position | Region |
|---|---|---|
| Top tier: 28% | CXOs: 18% | APAC: 40% |
| Mid tier: 50% | Functional/Unit leaders: 36% | EMEA: 36% |
| Smaller Players: 22% | Managers: 46% | Americas: 24% |
Market-Sizing & Forecasting
The core sizing is built using a top-down approach where production, consumption, and trade data are reconstructed into a consistent demand pool, and then translated into value using region-appropriate price series. Since avocados are price sensitive and seasonal, we track indicators such as harvested area and yield, exportable surplus, import dependency in major consuming countries, post-harvest loss allowances, and the spread between farmgate, wholesale, and retail benchmarks (where disclosed). When the data is thin, gaps are handled by using nearby country proxies and by keeping assumptions tied to observable trade behavior.
Once the total is formed, we corroborate it with selective bottom-up approximations, including sampled price per kilogram multiplied by traded volumes, plus distributor channel checks to validate the implied value by major routes. For forecasting, scenario analysis is used to balance supply expansion plans with demand growth signals, and expert feedback is applied to variables like yield improvements, weather risk, and expected price normalization following tight supply seasons.
Data Validation & Update Cycle
Validation is done in multiple passes so the model does not overreact to a single noisy data point. We compare outputs against independent signals like net trade balances, per capita consumption trends in large markets, and price movements across seasons, and then investigate any variance that looks out of line. Before sign-off, a second analyst reviews assumptions and recalculations, and follow-up calls are triggered if a key metric shifts or if a country series is revised.
The report is refreshed annually, and interim updates are made when material events occur, such as major crop disruptions, trade policy changes, or sharp currency moves in large exporting countries. Right before delivery, the latest public releases are checked again so clients receive an updated view based on the newest available information.
Mordor Intelligence's Avocado Market Size Versus Other Published Estimates
Published avocado market values often differ, even when they are trying to describe the same crop. The differences usually come from what is counted in the market boundary, which price level is used, and whether the numbers represent farmgate, wholesale, or retail value.
In this study, refresh cadence and currency timing matter because avocado prices can swing within a season and trade flows can re-route quickly, and those choices change the value total more than most people expect. By updating FX conversion timing, re-checking average selling price logic against recent trade unit values, and confirming volume reality through importer and exporter validation checks, Mordor Intelligence reduces drift when the market moves fast.
Benchmark comparison
| Source | Market Size | Gaps in Research Methodology |
|---|---|---|
| Mordor Intelligence | USD 18.5 B (2026) | |
| Global Research Publisher A | USD 15.83 B (2023) | Uses a base year earlier in the cycle and is more centered on fresh fruit revenue, which can undercount value added from minimally processed formats and later-period price shifts. |
| Industry Data Platform B | USD 21 B (2024) | Values are stated at producer and importer revenue level in nominal wholesale terms, with logistics and retail margin excluded, which can push the number away from a consumer-facing value view. |
The spread across the three figures is mainly explained by price level selection, coverage of minimally processed products, and how quickly assumptions are refreshed when prices and FX rates move. Our approach keeps the sizing steps traceable to trade and production volumes, and it ties value conversion to clearly stated price logic that can be re-checked each update cycle.
Key Questions Answered in the Report
What is the current value of the avocado market and how fast is it growing?
The avocado market size was valued at USD 18.5 billion in 2026 and is projected to reach USD 27.6 billion by 2031, registering a CAGR of 8.33% during the forecast period of 2026-2031.
Which region commands the largest demand for avocados in 2025?
North America leads with a 35% share in 2025, supported by strong United States consumption and close proximity to Mexican orchards.
Which region is expanding fastest in avocado consumption?
Asia-Pacific is the fastest, expected to rise at a 9.4% compound annual growth rate through 2031 as China and Japan accelerate imports.
How are controlled-atmosphere containers impacting avocado trade?
They extend shelf life by up to 21 days, enabling exporters to reach distant markets such as East Asia without compromising fruit quality.