Market Overview
| Study Period | 2021 - 2031 |
|---|---|
| Forecast Data Period | 2026 - 2031 |
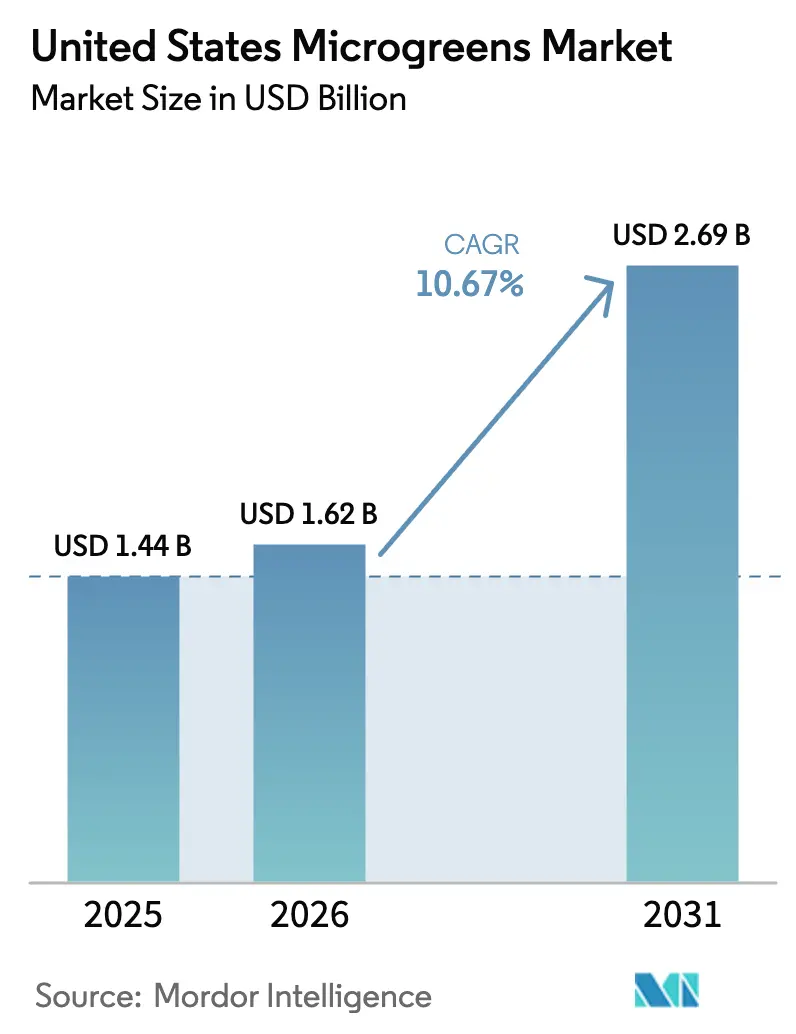
| Base Year Market Size (2025) | USD 1.44 Billion |
| Market Size (2026) | USD 1.62 Billion |
| Market Size (2031) | USD 2.69 Billion |
| Growth Rate (2026 - 2031) | 10.67% CAGR |
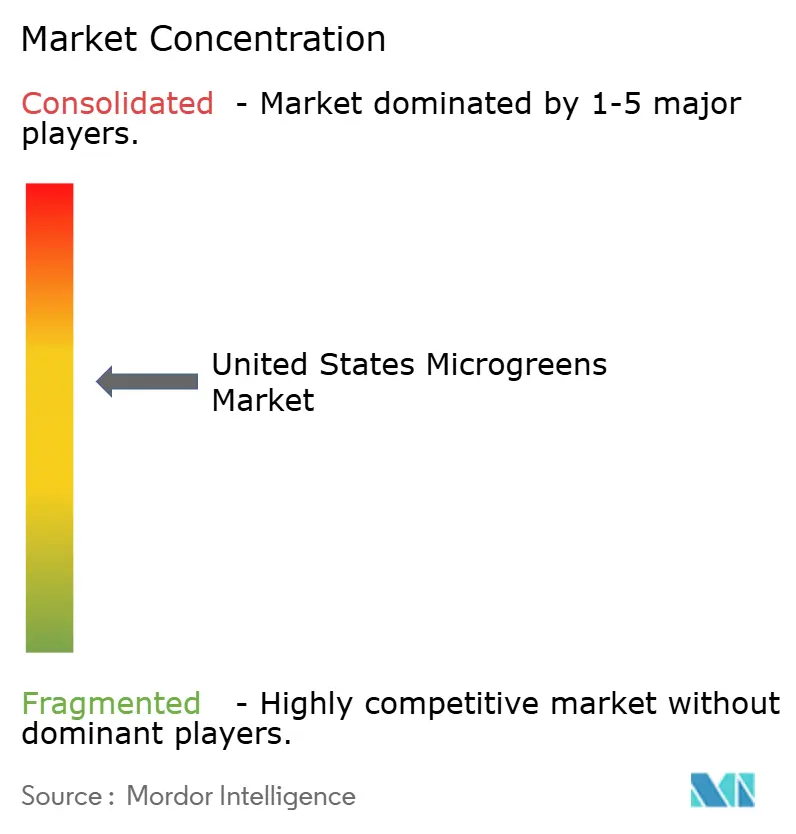
| Market Concentration | Medium |
Major Players *Disclaimer: Major Players sorted in no particular order Image © Mordor Intelligence. Reuse requires attribution under CC BY 4.0. | |
United States Microgreens Market Analysis by Mordor Intelligence
The United States microgreens market is projected to expand from USD 1.44 billion in 2025 and USD 1.62 billion in 2026 to USD 2.69 billion by 2031, registering a CAGR of 10.67% between 2026 to 2031. Advancements in protected cultivation technologies, the increasing adoption of functional foods, and cost reductions achieved through automation drive this growth.
Vertical farming makes a significant contribution to national output, underscoring its importance in meeting urban demand while conserving resources such as land and water. Broccoli microgreens lead the market, supported by studies linking glucoraphanin content to sulforaphane bioavailability, which appeals to premium consumers and product developers. Retailers are expanding private-label offerings, while online grocery platforms are reducing the time from harvest to table to just a few hours, ensuring fresher products and minimizing waste. Despite challenges such as energy price fluctuations and food safety compliance, the integration of artificial intelligence (AI) controls, renewable energy contracts, and federal grants is helping to stabilize margins and attract new investments.
Key Report Takeaways
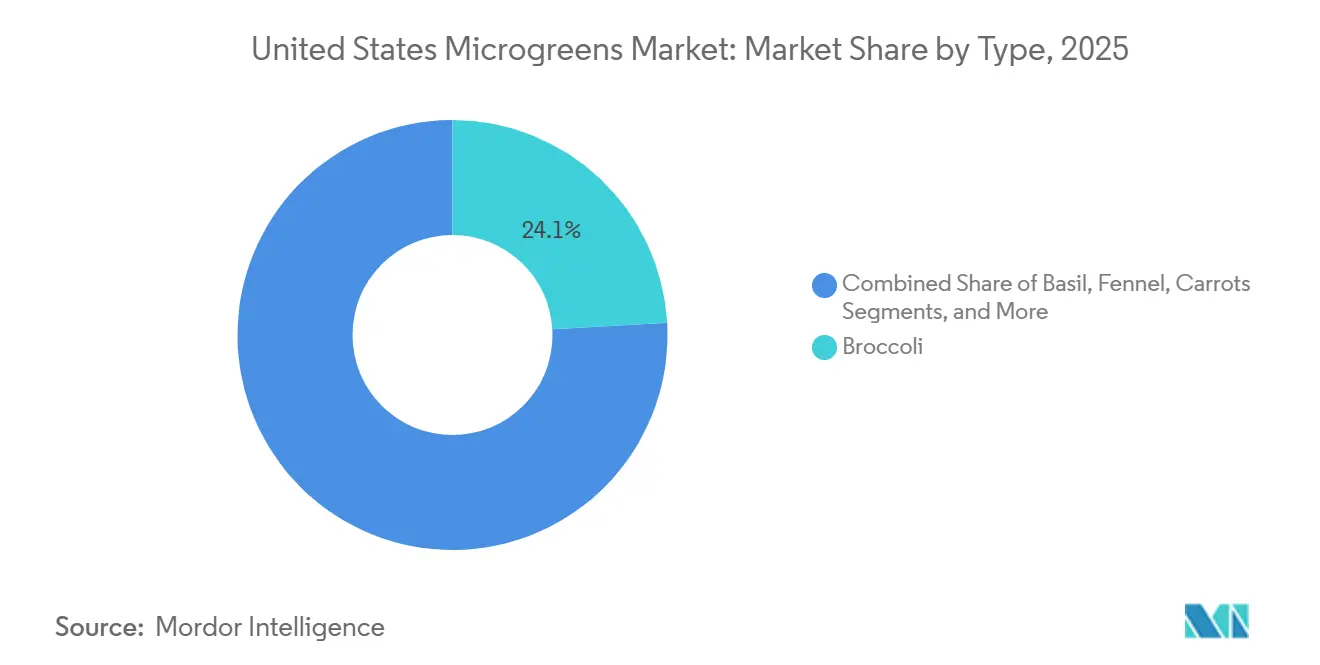
- By type, broccoli microgreens led with 24.1% of the United States microgreens market share in 2025, and amaranth microgreens are projected to expand at a 12.8% CAGR through 2031.
- By sales channel, hypermarkets and supermarkets captured 33.6% of the United States microgreens market size in 2025, while online grocery sales are projected to advance at a 10.2% CAGR through 2031.
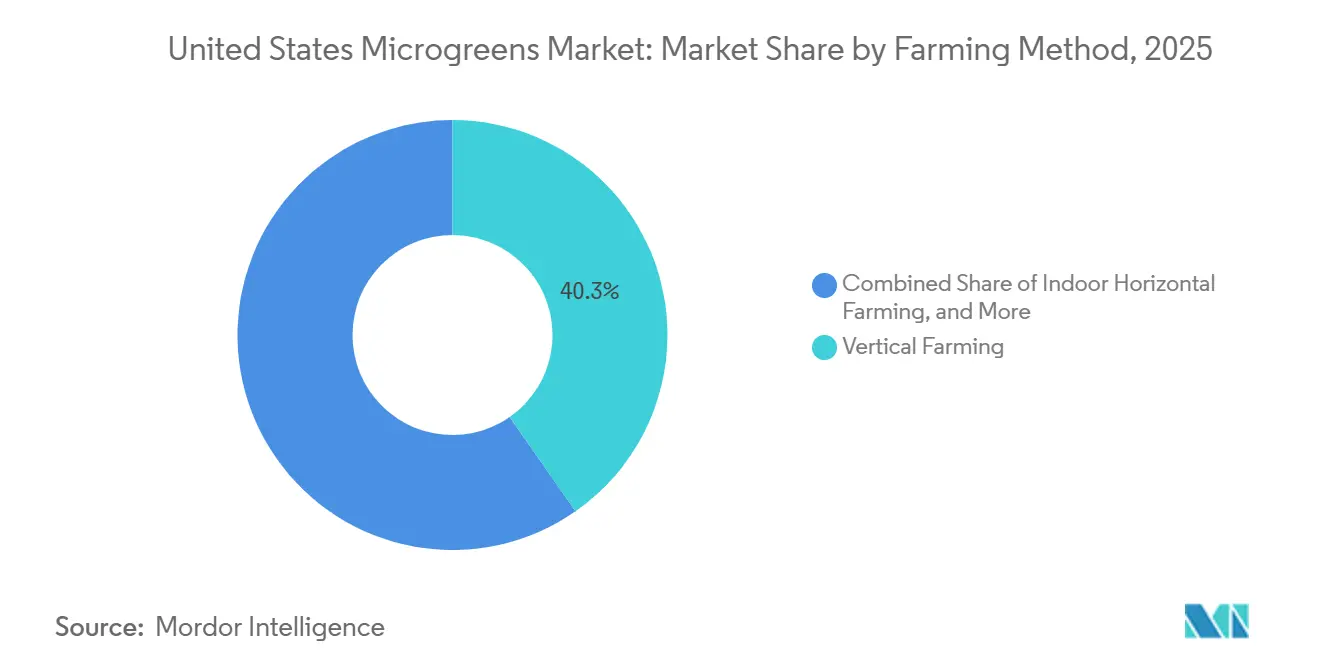
- By farming method, vertical farming accounted for 40.3% of the 2025 capacity and is forecasted to grow at an 11.4% CAGR through 2031.
- The top five players, Fresh Origins, LLC (Sun Capital Partners), AeroFarms, Inc., Bowery Farming, Inc., Perfect Foods, Inc., and BrightFarms, Inc. (Cox Enterprises, Inc.), together accounted for a majority of market share in 2025.
Note: Market size and forecast figures in this report are generated using Mordor Intelligence’s proprietary estimation framework, updated with the latest available data and insights as of January 2026.
United States Microgreens Market Trends and Insights
Drivers Impact Analysis*
| Driver | (~) % Impact on CAGR Forecast | Geographic Relevance | Impact Timeline |
|---|---|---|---|
| Accelerated shift toward protected cultivation infrastructure | +1.9% | Pennsylvania, New York, California, and Ohio | Medium term (2–4 years) |
| Rising demand from health-conscious consumers and functional-food brands | +1.8% | Major coastal and urban metros nationwide | Short term (≤2 years) |
| Expansion of farm-to-table restaurant partnerships | +1.2% | Chicago, New York, San Francisco, and Portland | Medium term (2–4 years) |
| Supermarket private-label roll-outs boosting retail shelf space | +1.5% | Nationwide with leadership by Whole Foods, Kroger, Albertsons, and Walmart | Short term (≤2 years) |
| Surging adoption of freeze-dried microgreens as nutrient concentrates | +0.8% | Domestic with export potential to Canada and Mexico | Long term (≥4 years) |
| AI-driven yield-optimization platforms lowering unit costs | +1.6% | Large-scale vertical farms nationwide | Medium term (2–4 years) |
| Source: Mordor Intelligence | |||
Accelerated Shift Toward Protected Cultivation Infrastructure
Federal and state incentive programs are allocating significant funding to greenhouses and vertical farms, reducing transportation distances and enabling year-round production. Pennsylvania has allocated USD 3 million through its Redevelopment Capital Assistance Program for a 1.5-million-square-foot BrightFarms greenhouse, slated for completion in 2024. This greenhouse will replace lettuce currently transported from Arizona with locally grown produce near Philadelphia. Little Leaf Farms, LLC, announced plans in June 2025 for a USD 75 million campus in Tennessee, projected to open in 2026 and create 318 regional jobs[1]Source: Pennsylvania Governor’s Office, “Grand Opening of Pennsylvania’s Largest Indoor-Grown Leafy Greens Facility,” pa.gov. The United States Department of Agriculture's Urban Agriculture and Innovative Production grants support investments in climate-control systems, irrigation infrastructure, and post-harvest cooling equipment, which would otherwise pose financial challenges. These initiatives have collectively reduced shelf-arrival times from five days to less than twenty-four hours, while protecting growers from risks such as western droughts and wildfire smoke that threaten open-field agriculture. As more states implement controlled-environment tax credits, the United States microgreens market is projected to continue concentrating near major population centers, reflecting broader structural shifts observed across the global microgreens market.
Rising Demand From Health-Conscious Consumers and Functional-Food Brands
Consumers seeking nutrition supported by scientific evidence are increasingly turning to microgreens, which offer higher concentrations of vitamins, minerals, and phytochemicals per gram compared to mature plants. In 2023, a human trial conducted at Oregon State University identified sulforaphane metabolites in urine within three hours of consuming a single 16-gram serving. Functional food brands are incorporating freeze-dried microgreens into powders and nutrition bars, with claims that one teaspoon provides the nutritional equivalent of eight cups of vegetables. The United States microgreens market is benefiting from an increase in repeat purchases among health-conscious households. Retailers and online platforms are further driving this trend through educational displays, social media cooking tutorials, and loyalty program incentives, which encourage trial and foster habitual consumption.
Expansion of Farm-to-Table Restaurant Partnerships
Chefs increasingly seek hyper-local produce that can be delivered within hours of harvest, retaining vibrant colors and supporting sustainable sourcing initiatives. In January 2026, Grand Geneva Resort and Spa reduced delivery times to just twelve hours by partnering with a regional grower, a collaboration prominently featured in its menus and social media content. Similarly, Chicago-based Closed Loop Farms fulfills same-day orders for multiple restaurants while maintaining a presence at farmers' markets, enhancing brand recognition among diners. Larger indoor growers, such as Shenandoah Growers, Inc., utilize proprietary trucking fleets to transport both their own herbs and third-party produce, optimizing logistics by reducing empty miles and generating additional revenue. These partnerships enable chefs to create seasonal tasting menus, enhance provenance storytelling, and reduce spoilage through just-in-time ordering. The United States microgreens market benefits from consistent supply volumes, stable contracts, and increased visibility when prominent restaurants advocate for local farms.
AI-Driven Yield-Optimization Platforms Lowering Unit Costs
In December 2024, the United States Department of Agriculture awarded Cornell University a grant to develop machine-learning models that optimize light spectra, nutrient dosing, and climate setpoints. These advancements are projected to reduce electricity consumption by up to 30%[2]Source: Cornell College of Agriculture and Life Sciences, “USDA Grant to Advance Indoor Agriculture Through AI,” cals.cornell.edu AeroFarms, Inc. has reported achieving 40% lower water usage compared to hydroponic farms by adjusting aeroponic mist intervals using proprietary software. Additionally, computer-vision harvest robots have reduced labor hours per tray, addressing technician shortages while improving crop uniformity. These improvements result in cost savings of USD 0.50–1.00 per kilogram when regional electricity prices are approximately USD 0.12 per kilowatt-hour. As algorithms continue to advance, predictive analytics are anticipated to identify disease risks early, minimizing crop losses. These cumulative cost efficiencies are positioning vertical farms as a key component of the United States microgreens market in the coming decade.
Restraints Impact Analysis*
| Restraint | (~) % Impact on CAGR Forecast | Geographic Relevance | Impact Timeline |
|---|---|---|---|
| Pest and pathogen susceptibility in dense indoor production | −1.3% | High-humidity regions and facilities lacking robust sanitation | Short term (≤2 years) |
| Volatile supply of certified-organic seeds | −0.9% | California, Oregon, and European import corridors | Medium term (2–4 years) |
| Grid-energy price volatility undermining vertical-farm margins | −1.6% | Northeast and California | Short term (≤2 years) |
| Scarcity of skilled technicians and agronomists | −1.1% | Rural areas with limited technical-education pipelines | Medium term (2–4 years) |
| Source: Mordor Intelligence | |||
Pest and Pathogen Susceptibility in Dense Indoor Production
Dense canopy layers, warm temperatures, and high humidity increase the likelihood of bacterial and fungal outbreaks, which can lead to costly product recalls. The Food and Drug Administration's Produce Safety Rule requires zero detectable generic Escherichia coli in 100 milliliters of irrigation water by 2025 for large farms, with phased deadlines for smaller farms[3]Source: United States Food and Drug Administration, “Produce Safety Rule Final,” fda.gov. According to Penn State Extension, damping-off diseases caused by Rhizoctonia and Botrytis are the primary threats to yields in commercial microgreens production. Mitigation strategies include the use of ultraviolet-treated water, redundant filtration systems, beneficial insects, and ATP bioluminescence swabs, which add USD 0.10–0.20 per kilogram to operating costs. Additionally, supermarkets are increasingly requiring third-party audits, which many undercapitalized farms find difficult to afford. This has led to a concentration of distribution among larger, well-funded players, thereby limiting the overall growth of the United States microgreens market.
Volatile Supply of Certified-Organic Seeds
The United States Department of Agriculture's National Organic Program requires growers to use certified organic seeds, unless such seeds are not commercially available. The global availability of organic seeds remains limited. Organic seeds are typically 30% to 50% more expensive than conventional seeds, and drought-related failures in regions like California and Europe have caused shipment delays. These delays can lead growers to either leave trays idle or risk non-compliance with regulations. While multiyear seed contracts with price ceilings offer some relief, they require accurate demand forecasting and tie up working capital. Some large farms are considering in-house seed production for high-volume varieties, but this approach increases agronomic complexity and diverts focus from core cultivation activities. As a result, volatility in organic seed supply constrains growth in the organic segment, a high-margin portion of the United States microgreens market that could otherwise expand more rapidly.
*Our forecasts treat driver/restraint impacts as directional, not additive. The impact forecasts reflect baseline growth, mix effects, and variable interactions.
Segment Analysis
By Type: Broccoli Dominance Anchored in Sulforaphane Science
Broccoli microgreens accounted for 24.1% of the United States microgreens market share in 2025, establishing themselves as the largest variety-based contributor. Their short fifteen-day crop cycle, high yields, and mild flavor facilitate efficient production planning and seamless integration into menus. Peer-reviewed studies indicate that a 16-gram serving provides approximately 100 micromoles of sulforaphane equivalent, enhancing its appeal among functional food consumers. Retailers often pair broccoli microgreens with avocado or chickpea spreads in ready-to-eat packs, which command price premiums of USD 0.50–0.75 per ounce. Additionally, restaurants use these microgreens as garnishes to increase nutrient density without affecting texture, further driving volume growth.
Amaranth microgreens are anticipated to achieve the fastest growth, with a 12.8% CAGR from 2026 to 2031. Their nutritional profile, including iron levels of approximately 1.7 milligrams per 100 grams and vitamin C concentrations exceeding 35 milligrams per 100 grams, appeals to formulators targeting anti-anemia and immune-support claims. The bright red stems and earthy flavor make amaranth a visually appealing garnish, particularly popular among health-conscious millennials. While growers report slightly uneven germination compared to broccoli, higher average selling prices offset potential yield losses. The increasing use of amaranth in smoothie powders and athlete meal plans is projected to drive its adoption in direct-to-consumer subscription boxes, further expanding its presence in the United States microgreens market.


By Sales Channel: Hypermarkets and Supermarkets Anchor Volume While Online Grocery Accelerates
Hypermarkets and supermarkets accounted for 33.6% of the United States microgreens market size in 2025, driven by large-volume private-label commitments. AeroFarms, Inc. captured a significant market share after Whole Foods standardized packaging and merchandising across 2,000 stores, utilizing end-caps as key educational spaces. Little Leaf Farms, LLC operates a Pennsylvania mega-facility to restock 8,000 grocery locations within 48 hours, leveraging shelf-life extensions to minimize product shrinkage.
Online grocery is the fastest-growing segment, with a projected CAGR of 10.2% through 2031. Same-day delivery platforms, such as Amazon Fresh, Instacart, and DoorDash, reduce delivery times to under four hours, thereby maintaining product freshness and enabling real-time inventory adjustments. Subscription models offer weekly boxes featuring a mix of broccoli, radishes, and specialty microgreens, providing consistent farm income despite annual churn rates nearing 30%. The shift toward an omnichannel approach is anticipated to drive the United States microgreens market toward integrated supply chains that combine operational efficiency with personalized consumer experiences.
By Farming Method: Vertical Farming Leads on Space Efficiency and Automation
Vertical farms accounted for 40.3% of the market share in 2025, establishing them as the leading contributor to the United States microgreens market based on production methods. Multilevel rack systems enhance yield per square foot by up to twenty times compared to greenhouse benches, while sealed rooms help prevent pest infiltration. AeroFarms, Inc. utilizes aeroponic sprayers to mist nutrient-rich solutions directly onto the roots, resulting in approximately 90% reduction in water usage compared to open-field cultivation. In October 2025, Little Leaf Farms, LLC commissioned a forty-acre, fully automated greenhouse in Pennsylvania, integrating sowing, germination, and packing through conveyor belts, which reduced labor time per clamshell to just a few minutes.
Vertical farms are also projected to experience the highest growth rate, with a CAGR of 11.4% through 2031, driven by artificial intelligence-powered lighting systems that optimize energy consumption and increase yield per square foot. Meanwhile, horizontal hydroponic greenhouses remain a viable option in sun-rich states, offering 40% to 60% lower electricity costs but with greater seasonal variability. Hybrid models, which combine greenhouse skylights during summer with supplemental LED lighting in winter, provide a year-round supply while mitigating exposure to fluctuations in energy prices. The United States microgreens market is anticipated to increasingly adopt these hybrid formats as investors seek a balanced approach to risk and return.
Geography Analysis
Production nodes in the Northeast and Mid-Atlantic regions benefit from their proximity to dense consumer clusters, which reduces freight distances and leverages state incentive programs. Pennsylvania is home to the world’s largest indoor leafy-greens farm, which opened in October 2025. This facility supplies grocery depots in New York City and Washington, D.C., within one day of harvest. In 2024, BrightFarms, Inc. (Cox Enterprises, Inc.) received township approval for a 1.5 million-square-foot greenhouse in the area, supported by USD 3 million in state grants. This development further strengthens the region's position as a key hub in the United States microgreens market. Additionally, rooftop greenhouses in Brooklyn, New York, optimize unused commercial real estate and benefit from renewable energy credits.
The Southeast is rapidly expanding its high-tech greenhouse infrastructure to meet the demands of growing populations in cities such as Atlanta, Nashville, and Miami. Little Leaf Farms, LLC is also establishing a campus in Tennessee, capitalizing on the availability of affordable land and moderate power costs. State development boards in the region are accelerating site selection by offering property tax abatements and workforce grants.
Midwestern states offer competitive electricity rates, averaging as low as USD 0.08 per kilowatt-hour, which can reduce production costs by 20% to 30% compared to coastal facilities. However, the region faces challenges such as longer transportation distances to densely populated coastal areas, which increase freight costs and the risk of product damage. Additionally, the availability of skilled technicians in the Midwest can be limited. Despite these challenges, the region remains an important contributor to the microgreens market. California and the Pacific Northwest continue to play a role in supplying organic seeds and greenhouse expertise. However, rising water costs and land prices are prompting new investments to shift eastward. As the United States microgreens market evolves, operators are increasingly adopting a hub-and-spoke model. This approach places large-scale farms within one trucking day of major metropolitan areas while establishing smaller satellite farms to ensure last-mile freshness.
Competitive Landscape
The United States microgreens market remains moderately concentrated in 2025, with the top five producers accounting for a significant share of the market. AeroFarms, Inc. strengthened its market presence through an eight-year supply agreement with Whole Foods, as well as secondary placements at Ahold Delhaize, Harris Teeter, and H-E-B. Little Leaf Farms, LLC holds approximately half of the controlled-environment packaged salad segment and operates the largest indoor leafy greens facility in the country, providing it with strong negotiating power with national grocery chains.
Strategic maneuvers revolve around vertical integration, technological differentiation, and regional expansion. Shenandoah Growers, Inc. (Soli Organic Inc.) operates a private trucking fleet that hauls its own herbs, as well as third-party produce, monetizing back-haul capacity and ensuring cold-chain control. Bowery Farming Inc. pairs computer-vision harvest arms with low-touch packaging lines to slash labor minutes per tray. White-space opportunities include freeze-dried powders aimed at sports nutrition, micro-subscription boxes for affluent millennials, and cross-border sales into Canada and Mexico.
Private equity interest persists despite the 2023 bankruptcy of Kalera, which cited energy costs and under-utilization. In 2023, Sandton Capital Partners acquired Kalera’s assets and now funds new cultivar research and retail partnerships. Venture funds channel capital into sensor-driven lighting firms and biological pest-control startups, expecting royalties or long-term supply contracts. Regulatory tightening under the Food and Drug Administration's Produce Safety Rule raises compliance costs, tilting the playing field toward well-capitalized incumbents and spurring consolidation that will likely increase the United States' microgreens market concentration ratio over the next five years.
United States Microgreens Industry Leaders
Fresh Origins, LLC (Sun Capital Partners)
Bowery Farming Inc.
AeroFarms, Inc.
Perfect Foods, Inc.
BrightFarms, Inc. (Cox Enterprises, Inc.)
- *Disclaimer: Major Players sorted in no particular order

Recent Industry Developments
- January 2026: Luya Tech Inc., an AI technology company based in Princeton, introduced the world's first AI-powered microgreens nutrition system at CES 2026. This innovation offers households a convenient way to grow fresh, nutrient-rich microgreens at home. The system utilizes AI, cameras, and environmental sensors to continuously monitor plant growth and development. It automatically adjusts light, temperature, humidity, and nutrient delivery in real-time, enhancing nutrient density by 30% to 50% compared to traditional home-growing techniques.
- April 2025: AeroFarms, Inc. introduced the first commercially available micro bok choy in United States retail stores. This product, a mild, sweet, and nutrient-rich green, is suitable for salads, sandwiches, stir-fries, and smoothies. It is available at major retailers, including Whole Foods, Giant Food, and H Mart, as part of the company's FlavorSpectrum line. This launch highlights AeroFarms' role in advancing sustainable vertical farming and controlled-environment agriculture.
- March 2025: 80 Acres Farms has expanded its operations by acquiring three indoor vertical farms and associated intellectual property previously owned by Kalera, Inc. These farms are strategically located in Georgia, Texas, and Colorado. With the increasing demand for fresh, local, and pesticide-free produce, 80 Acres Farms is utilizing over a decade of industry experience to acquire and enhance existing vertical farming facilities.
- January 2025: AeroFarms, Inc. has launched and fully commercialized its patented technology for producing nutrient-dense microgreens on a global scale. This patented system combines aeroponics with advanced automation and AI to deliver a "climate-agnostic" farming solution.


Research Methodology Framework and Report Scope
Market Definitions and Key Coverage
Our analysts define the United States microgreens market as the sale value of freshly harvested vegetable and herb seedlings clipped after the cotyledon stage and shipped within the country through retail, food-service, direct subscription, and farmers-market channels. We track output grown in indoor horizontal beds, vertical racks, and commercial greenhouses, valuing produce at the first point of trade.
Scope exclusion: sprouts, baby leaves, and field-grown herbs are not counted.
Segmentation Overview
- By Type
- Broccoli
- Lettuce and Chicory
- Basil
- Fennel
- Carrots
- Radish
- Amaranth
- Arugula
- Beets
- Mustard
- Kale
- Cress and Chard
- By Sales Channel
- Hypermarkets and Supermarkets
- Restaurants and Foodservice
- Direct-to-Consumer Subscription
- Farmers Markets
- Online Grocery
- By Farming Method
- Indoor Horizontal Farming
- Vertical Farming
- Commercial Greenhouses
- Hydroponic Grow Cabinets
Detailed Research Methodology and Data Validation
Primary Research
Mordor analysts conducted structured interviews with indoor farm operators, seed suppliers, specialty produce distributors, and executive chefs across the Midwest, California, and the Northeast. These discussions clarified live yield rates, input costs, and channel-specific average selling prices, while short web-based surveys of household purchasers confirmed emerging direct-to-consumer adoption.
Desk Research
We gathered foundational numbers from publicly available sources such as the USDA Census of Agriculture, National Agricultural Statistics Service weekly specialty-crop price sheets, United States International Trade Commission tariff data, and peer-reviewed articles in the Journal of Agricultural Science. Additional context came from trade bodies such as the Produce Marketing Association, indoor-farming patents indexed on Questel, and curated company financials on D&B Hoovers. Subscription news via Dow Jones Factiva helped flag capacity expansions and price shifts. The sources cited above illustrate our reference set and are not exhaustive; many other public records and proprietary notes supported the desk build.
A separate scan of restaurant menu databases, large grocery flyers, and state organic-certification lists let us gauge demand momentum and retail mark-ups, which proved useful when crosschecking primary inputs.
Market-Sizing & Forecasting
A top-down model begins with USDA acreage and tray-equivalent production data, which are then paired with average yield per tray and weighted wholesale ASPs to create the 2024 demand pool. Bottom-up spot checks, supplier roll-ups, and sampled ASP × volume invoices validate totals and adjust for unreported urban container farms. Key variables include indoor farming footprint, seed cost index, chef menu-penetration ratio, retail price spread, and electricity cost trends. Multivariate regression combined with ARIMA smoothing projects each driver to 2030 and informs our base, optimistic, and conservative scenarios. Any bottom-up gaps are filled through triangulated midpoint estimates agreed upon during expert calls.
Data Validation & Update Cycle
Model outputs run through variance rules that flag shifts over two standard deviations from historical patterns. Senior reviewers replicate calculations, compare findings with external trade volumes, and sign off before release. The update cadence is annual, with interim refreshes triggered by material events such as subsidy changes or major facility launches. A final pre-publication sweep ensures clients receive the latest view.
Why Mordor's United States Microgreens Baseline Earns Trust
Published estimates often differ because firms choose wider crop baskets, apply retail mark-ups, or refresh data irregularly. We isolate true microgreens, apply farm-gate values, and refresh every year, which keeps our figure stable and transparent.
Benchmark comparison
| Market Size | Anonymized source | Primary gap driver |
|---|---|---|
| USD 0.59 B (2025) | Mordor Intelligence | - |
| USD 0.64 B (2023) | Regional Consultancy A | Includes sprouting seeds and uses inflation lifts without interview checks |
| USD 1.74 B (2024) | Global Consultancy B | Applies retail ASPs, counts baby greens, and minimal primary validation |
The table shows how wider scopes or price multipliers inflate values.
By anchoring the market to verified production and channel splits, Mordor Intelligence supplies a balanced, reproducible baseline that decision-makers can rely on.


Key Questions Answered in the Report
What is the current value of the United States microgreens market?
The United States microgreens market size stood at USD 1.62 billion in 2026.
How fast is the United States microgreens market projected to grow?
The market is projected to reach USD 2.69 billion by 2031, advancing at a 10.67% CAGR.
Which variety leads sales in the United States microgreens market in 2025?
Broccoli microgreens hold the largest share at 24.1% in 2025 owing to strong sulforaphane science.
Which sales channel is expanding fastest for microgreens?
Online grocery platforms are growing at a 10.2% CAGR through 2031, driven by same-day delivery.
Why are vertical farms important to microgreens supply?
Vertical farms supply 40.3% of capacity in 2025 and are forecast to grow at an 11.4% CAGR through 2031 due to space efficiency and artificial-intelligence cost controls.
What key restraint could limit market growth?
High electricity costs in regions such as California can erode margins, slowing vertical-farm expansion.
Page last updated on:


