Football Clubs Market Size and Share
Market Overview
| Study Period | 2020 - 2031 |
|---|---|
| Forecast Data Period | 2026 - 2031 |
| Historical Data Period | 2020 - 2024 |
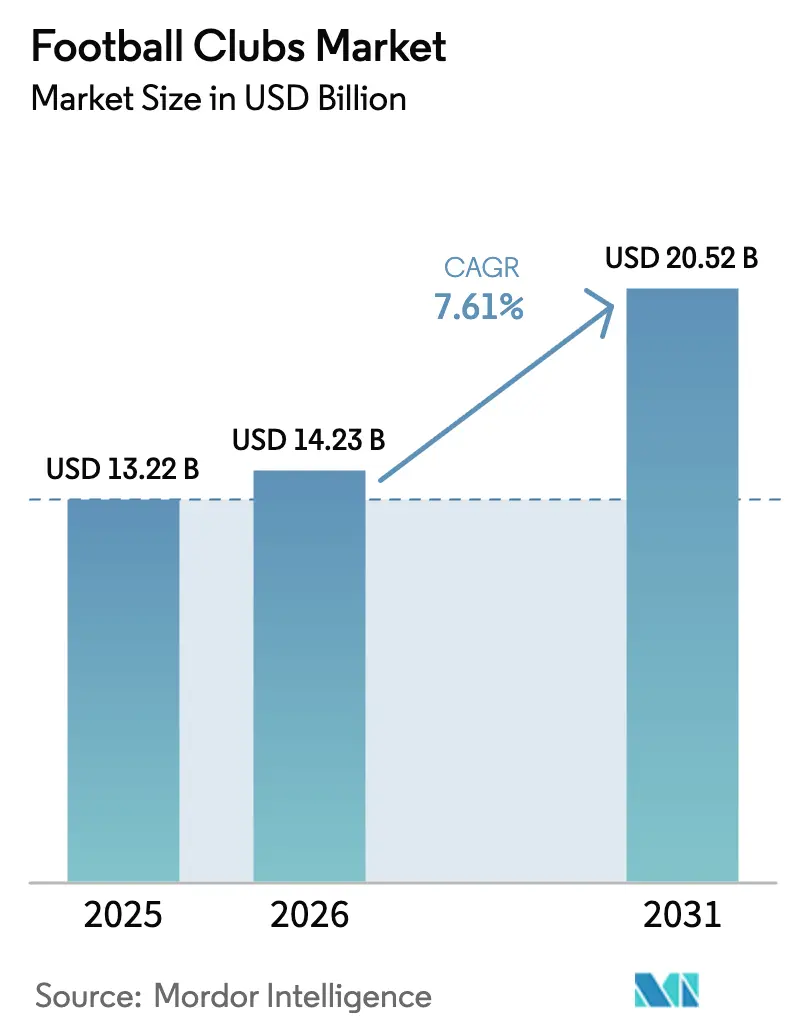
| Market Size (2026) | USD 14.23 Billion |
| Market Size (2031) | USD 20.52 Billion |
| Growth Rate (2026 - 2031) | 7.61% CAGR |
| Market Concentration | Low |
Major Players *Disclaimer: Major Players sorted in no particular order Image © Mordor Intelligence. Reuse requires attribution under CC BY 4.0. | |
Football Clubs Market Analysis by Mordor Intelligence
The football clubs market size is expected to grow from USD 13.22 billion in 2025 to USD 14.23 billion in 2026 and is forecast to reach USD 20.52 billion by 2031 at 7.61% CAGR over 2026-2031. The football clubs market continues to expand steadily, driven by sustained growth in broadcast revenues, premium hospitality offerings, and increasingly sophisticated digital fan engagement strategies. Revenue models are evolving beyond traditional matchday income and sponsorship cycles, as clubs invest in direct-to-consumer streaming platforms and explore emerging digital channels to build more stable, diversified income streams. Leading European leagues and top-tier clubs are generating stronger commercial returns, reflecting a broader shift toward higher monetization efficiency at the elite level of the sport. At the same time, stricter financial governance under UEFA’s Financial Sustainability Regulations is encouraging clubs to maintain wage discipline and align squad costs more closely with revenue performance. In this environment, clubs that successfully diversify their commercial portfolios while maintaining operational efficiency are likely to secure a sustained competitive advantage within the global football clubs market.
Key Report Takeaways
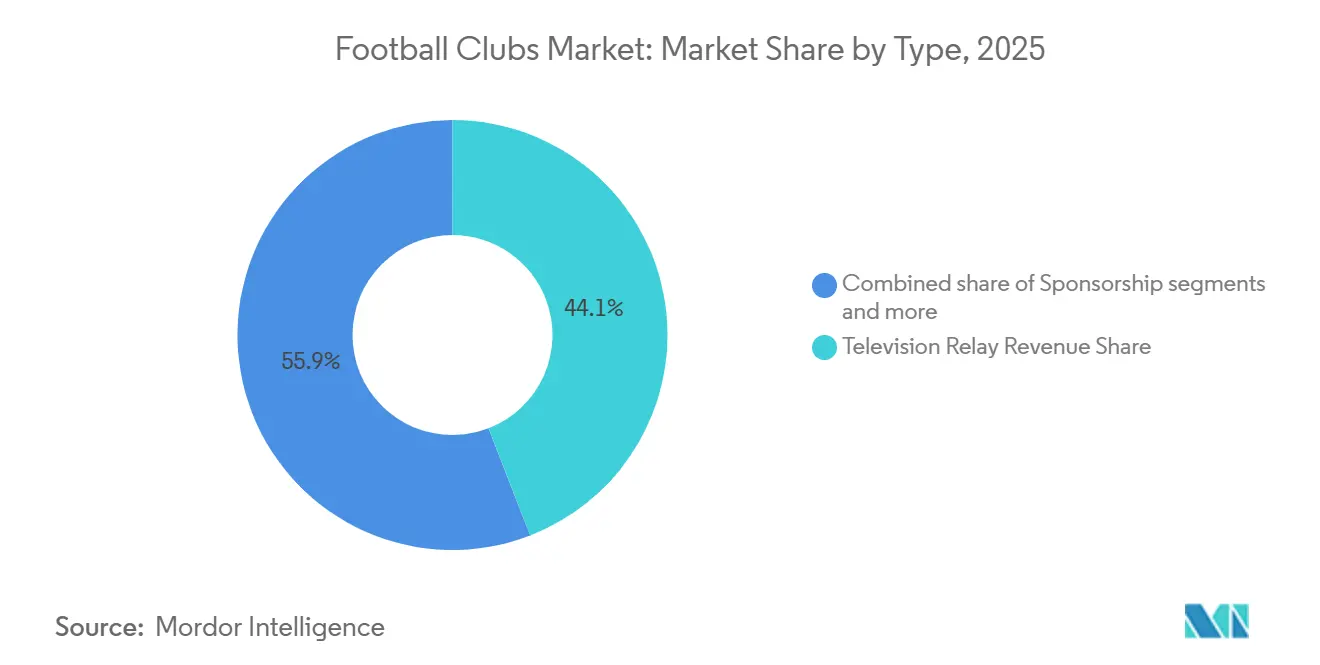
- By type, television relay revenue led with 44.12% of football clubs' market share in 2025, whereas other business receipts anchored by digital assets are projected to grow at a 16.12% CAGR through 2031.
- By application, the Premier League captured 21.34% of the football clubs market size in 2025, yet clubs outside the Big Five leagues are expanding at a 7.68% CAGR to 2031.
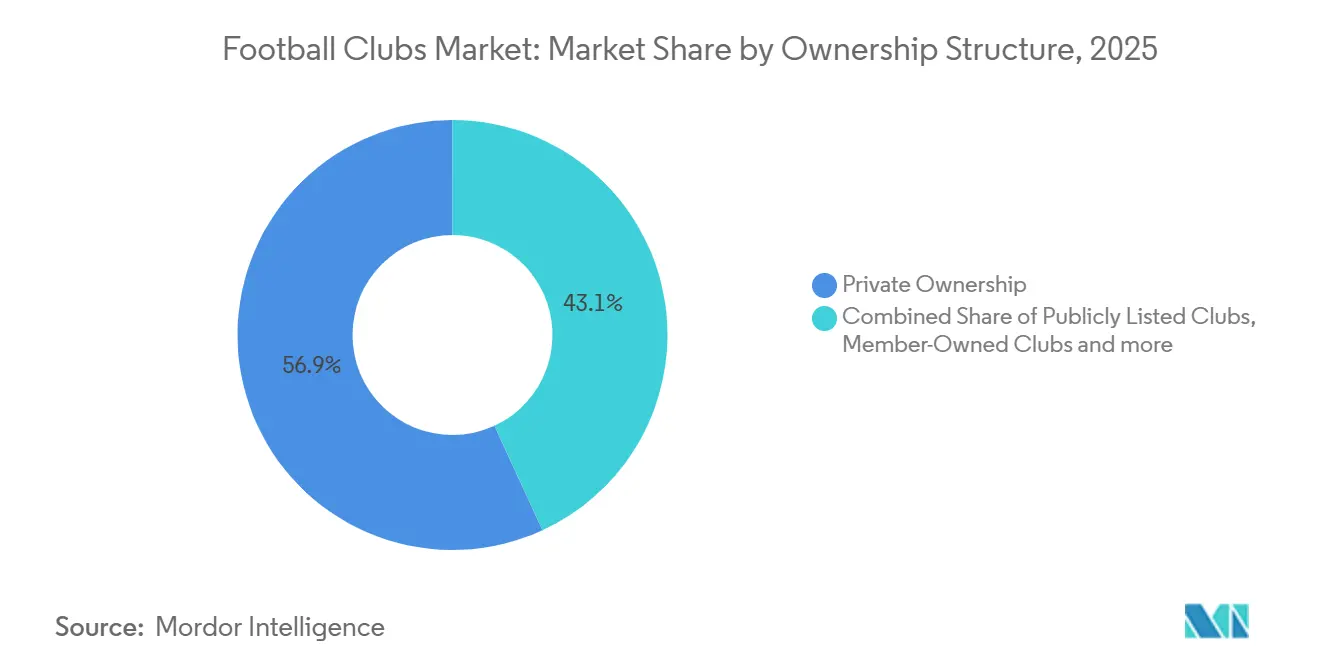
- By ownership structure, private entities accounted for a 56.88% share of the football clubs market size in 2025, while publicly listed clubs are advancing at an 8.17% CAGR through 2031.
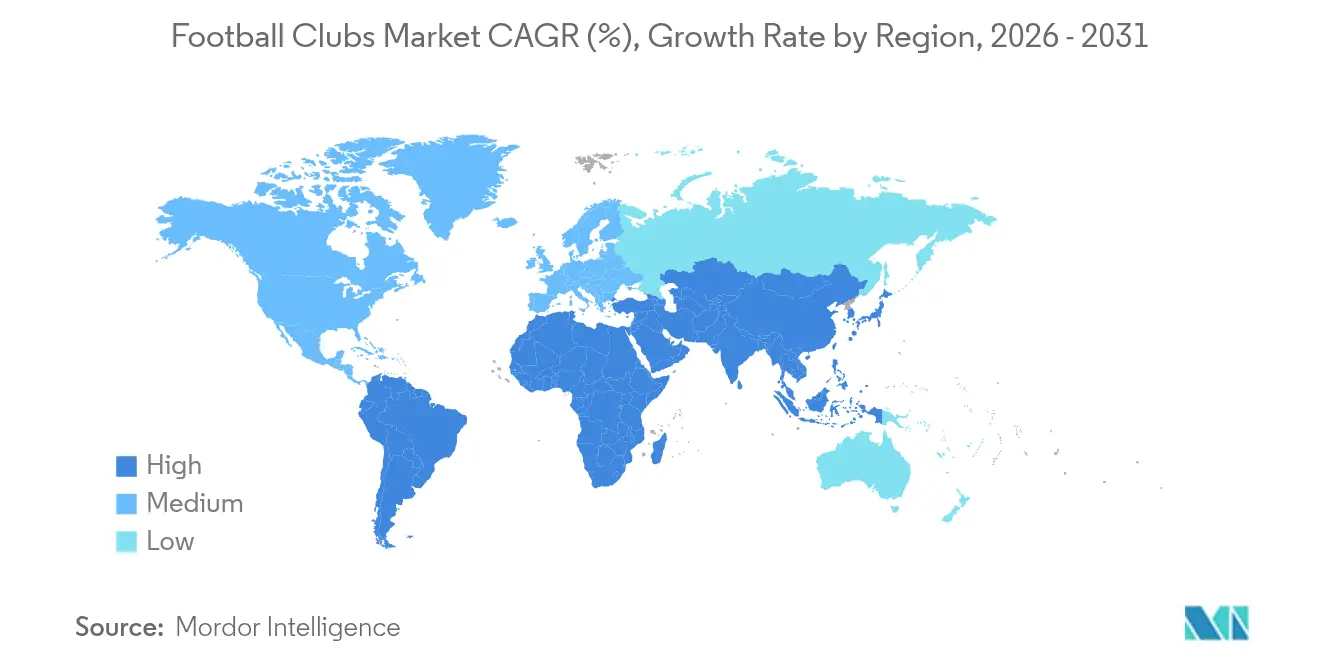
- By geography, Europe dominated with a 52.12% share of the football clubs market size in 2025; Asia-Pacific is forecast to register the fastest 8.61% CAGR over the outlook period.
Note: Market size and forecast figures in this report are generated using Mordor Intelligence’s proprietary estimation framework, updated with the latest available data and insights as of 2026.
Global Football Clubs Market Trends and Insights
Drivers Impact Analysis*
| Driver | (~) % Impact on CAGR Forecast | Geographic Relevance | Impact Timeline |
|---|---|---|---|
| Rapidly Rising Global Broadcast Rights Costs | +1.8% | Global, led by Premier League and LaLiga, with plateauing in Serie A and Ligue 1 | Medium term (2-4 years) |
| Club-Owned D2C Streaming Platforms Gain Traction | +0.9% | APAC core, spill-over to MEA; early traction in France | Short term (≤ 2 years) |
| Growth of Women’s Football Viewership & Sponsorship | +0.7% | Europe and North America, with APAC expansion | Medium term (2-4 years) |
| Dynamic Ticket-Pricing & Premium Hospitality Innovation | +1.3% | Europe and North America | Short term (≤ 2 years) |
| Multi-Club Ownership Groups Pooling Commercial Assets | +1.1% | Global, with high United States investor participation | Medium term (2-4 years) |
| Rise of Fan-Token & Web3 Revenue Channels | +0.6% | Global, with Europe regulatory progress | Long term (≥ 4 years) |
| Source: Mordor Intelligence | |||
Rapidly Rising Global Broadcast Rights Costs
The Premier League’s latest commercial cycle highlights the accelerating inflation in global broadcast rights, with total revenue for the 2025–28 rights cycle rising to approximately USD 16.48 billion, representing a 17% increase compared to the previous cycle. International media rights are now worth around USD 8.74 billion, surpassing domestic rights for the first time and underscoring the league’s expanding global footprint across nearly 200 countries[1] Source: SportsPro, “Premier League revenue, TV rights, and sponsorship overview,” SportsPro, sportspro.com. LaLiga locked in USD 7.20 billion (Euro 6.135 billion) for the 2027-2032 domestic cycle, a 9% uplift that includes specific gains in HORECA distribution and expanded LaLiga Hypermotion content. The contrast with Serie A’s domestic rights, which showed a 3% decline to USD 1.06 billion (Euro 900 million) per season, and with Ligue 1’s collapsed deal that led to a league-controlled D2C platform, illustrates that only a few elite properties can secure robust inflation while others pivot toward different models[2]Source: LaLiga, “La Asamblea de LALIGA,” LaLiga, laliga.com. In Germany, the Bundesliga’s USD 5.26 billion (Euro 4.484 billion) domestic package for 2025/26-2028/29 marked a modest 2% increase, pointing to maturation in rights values across established European markets[3]Source: Omdia, “Bundesliga scores an increase in new domestic media rights tender defying trend in other European markets,” Omdia, omdia.tech.informa.com. This divergence encourages clubs to target international audiences, supplement legacy contracts with premium tiers, and explore hybrid models that rebalance reach against direct monetization in the football clubs market.
Club-Owned D2C Streaming Platforms Gain Traction
Ligue 1+ surpassed one million subscribers in its first month and created a structured revenue split across clubs, which confirmed that direct models can activate fans when traditional partners undervalue domestic rights. The platform’s economics combine equal distributions with performance and engagement metrics, which align broadcaster incentives with on-pitch and digital outcomes. Premier League clubs are tracking these experiments as regulatory limits on gambling sponsorships and plateauing domestic rights increase the appeal of direct channels that capture superfans and ancillary inventory. In parallel, leagues are maintaining a broad reach through international partnerships, as seen with LaLiga’s long-term ESPN agreement in the United States and the Bundesliga’s expanded DAZN inventory for 2025/26-2028/29. These hybrid strategies allow clubs and leagues to protect audience scale while building flexible layers of direct monetization that improve earnings resilience across the football clubs market.
Growth of Women’s Football Viewership & Sponsorship
The top 15 women’s football clubs generated USD 185.3 million (Euro 158 million) in 2024/25 revenue, which was a 35% year-on-year increase and largely anchored by commercial income’s 72% share[4]Source: IUSPORT, “Los principales clubes femeninos generan en 2025 más de 150 millones,” IUSPORT, iusport.com. Spain’s Liga F distributed USD 20 million (Euro 17 million) to clubs in 2024/25, a 37% rise, while domestic audiences and stadium attendance grew at double-digit rates, validating greater sponsor appetite[5]Source: AS, “La Liga F mantiene su crecimiento económico,” AS, as.com/futbol/segunda/la-liga-f-mantiene-su-crecimiento-economico-f202602-n/. Investment groups, including dedicated vehicles, have moved to secure controlling stakes in European women’s teams, which supports infrastructure and leadership capacity that can scale commercial reach. Transfer records and FIFA’s tracked transfer flows are rising, adding depth to the talent market and driving higher media interest and new brand partnerships. Together, these trends indicate women’s football is transitioning into a growth pillar that complements men’s competitions and broadens the revenue base across the football clubs market.
Dynamic Ticket-Pricing & Premium Hospitality Innovation
Dynamic ticket-pricing and premium hospitality strategies are reshaping how football clubs generate matchday revenue. Renovated stadiums and upgraded seating options are driving higher income from both games and non-matchday events. Personal seat license programs allow clubs to secure committed revenue during redevelopment periods, providing greater financial stability. German clubs have demonstrated the benefits of targeted arena upgrades in boosting overall matchday performance. Multi-purpose stadium projects, such as those planned in Milan, aim to maximize revenue per seat while supporting a variety of events beyond football. These initiatives reduce reliance on broadcast and sponsorship income, creating more resilient and diversified revenue streams. Overall, asset-backed matchday and hospitality innovations are becoming a critical growth driver in the football clubs market.
Restraints Impact Analysis*
| Restraint | (~) % Impact on CAGR Forecast | Geographic Relevance | Impact Timeline |
|---|---|---|---|
| Escalating Player-Salary To Revenue Ratio | -1.4% | Europe-wide, with acute strain in Italy and France, better ratios in Germany | Medium term (2-4 years) |
| Stricter Financial Sustainability Regulations (e.g., UEFA FSR) | -0.8% | Europe-wide, with alignment toward a 70% squad cost ratio | Medium term (2-4 years) |
| Fragmented Media-Rights Antitrust Pushbacks | -0.6% | Germany and potential EU ripple effects | Long term (≥ 4 years) |
| Macro-Economic Pressure On Discretionary Spend In Key Markets | -0.9% | Europe and China with potential matchday and merchandise sensitivity | Short term (≤ 2 years) |
| Source: Mordor Intelligence | |||
Escalating Player-Salary to Revenue Ratio
In Italy, top-tier clubs dedicated a sizable share of income to personnel costs during 2024/25 yet still reported sizable combined losses, which indicates an ongoing structural mismatch between wage outlays and sustainable revenues. This position diverges from Germany, where personnel costs accounted for close to one-third of income and the league as a whole maintained positive EBITDA, signaling consistent cost discipline. UEFA’s rules on squad cost ratios and broader financial sustainability have already led to enforcement actions and accelerated wage adjustments across several major clubs. Paris Saint-Germain reduced its wage-to-turnover ratio below two-thirds in 2025, demonstrating that compliance can be achieved through both revenue initiatives and payroll optimization. Persistent misalignment can threaten European participation for offenders, which in turn compresses broadcast and commercial income and heightens the need for balanced cost structures across the football clubs market.
Fragmented Media-Rights Antitrust Pushbacks
Germany’s competition authority affirmed the permissibility of the Bundesliga’s 50+1 rule in 2025, while mandating adjustments to preserve member control and transparent voting, thereby stabilizing governance and limiting speculative capital[6]Source: Beck, “50+1-Regel: Zulässig,” Beck, beck.de. UEFA’s evolving framework requires positive equity positions and minimum liquidity buffers, and together these rules increase pressure on overleveraged models to reset their financial base. Leagues with greater reliance on owner injections face greater scrutiny as investment cycles end and interest rates remain elevated, prompting more cautious squad-building and operating budgets. Debt metrics in Italy rose during 2024/25, highlighting uneven resilience across several clubs and signaling that balance-sheet repair will be a priority as rights growth slows. The new environment favors clubs that invest in stadium infrastructure, commercial diversification, and cash-generating assets that align with financial thresholds in the football clubs market.
*Our forecasts treat driver/restraint impacts as directional, not additive. The impact forecasts reflect baseline growth, mix effects, and variable interactions.
Segment Analysis
By Type: Commercial Diversification Accelerates Beyond Broadcast
Television relay revenue share accounted for 44.12% of market value in 2025, and other business receipts are projected to grow at a 16.12% CAGR through 2031, indicating a rebalancing as clubs widen their commercial mix across the football clubs market size. Sponsorship stays significant but is adjusting to regulatory and brand shifts, which opens space for categories like airlines, telecom, and finance. Premium hospitality is expanding margins as clubs deploy dynamic ticketing, seat licensing, and non-matchday programming to capture higher yield. Germany’s professional clubs generated USD 703 million (Euro 599 million) in matchday revenue in 2024/25, which reflects how facility investments translate into higher per-fan spend and improved resilience. These patterns strengthen the preference for repeatable, asset-backed cash flows that protect against variability in player trading and tournament dependence.
The gains tied to modernized venues are visible in specific club outcomes, including large percentage increases after targeted renovations and technology upgrades. In Italy, structural constraints and older venues have limited matchday upside for several clubs, which preserves a wide gap with peers that have secured venue control or completed major rebuilds. Conversely, Spain’s steady attendance and high occupancy ratios point to durable demand that supports bundled ticketing and robust hospitality pipelines. The transition away from some legacy shirt categories in England is accelerating a move toward broader partner rosters and longer-term deals that span global brand campaigns. Combined, these shifts reinforce a multi-line approach to revenue where broadcast remains core but no longer singular in the football clubs market.


By Application: Premier League Maintains Lead; Emerging Leagues Gain Momentum
The Premier League held 21.34% in 2025, supported by strong domestic rights, a deep international footprint, and premium sponsorship and retail economics within the football clubs market. LaLiga’s top clubs have lifted revenue through a mix of matchday, media, and commercial, which narrows the gap with other major European properties. Germany achieved a record revenue year in 2024/25, underscoring the effectiveness of financial discipline and fan-centric operations. France’s top club reported record turnover in 2024/25, even as the league pivoted to a direct streaming solution for its domestic property. These performance profiles show that leading leagues set global benchmarks while others adopt hybrid models and facility-led strategies to improve their competitive position.
Other clubs outside the top five leagues are advancing at a 7.68% CAGR through 2031, enabled by rising valuations and broadcast appetite across North America, the Middle East, and parts of Asia in the football clubs market. Expanded international tournaments and a broader Champions League field create additional media inventory and prize pools that benefit a wider set of clubs. In the Bundesliga, clubs are capturing upside from improved stadium experiences and strong engagement, which improves retention across memberships and season plans. In France, the early D2C transition shows how leagues can manage through a reset and rebuild revenue architecture around subscriber economics. The application mix is evolving as value migrates toward organizations that execute well beyond the pitch and build layers of direct access to fans.
By Ownership Structure: Private Dominance Persists; Public Listings Attract Institutional Capital
Private ownership accounted for 56.88% in 2025, while publicly listed clubs are projected to grow at an 8.17% pace through 2031 as institutional capital targets liquid exposure to the football clubs market size. In Germany, Borussia Dortmund’s consistent reporting and shareholder returns highlight how public companies can manage transparency with competitive intent. Member-owned structures maintain control and identity across many clubs in Germany and Spain, but they face constraints when competing with sovereign-backed or corporate-backed peers. The 50+1 framework in Germany was confirmed as compliant with competition law in 2025 with added governance safeguards, which provides clarity for the next investment cycle. State-backed and corporate portfolios continue to scale multi-club networks to leverage shared services, data, and media bundling that drive commercial returns in the football clubs market.
Public markets have also enabled strategic minority investments into well-known clubs, which support large-scale venue projects and digital transformations without full control changes. Sovereign-backed investments at leading clubs have accelerated brand development and international reach, which strengthens sponsorship pricing and content monetization. Corporate-owned examples have created proof points for cross-market synergies, talent mobility, and aggregated sponsorship value that mid-size clubs can replicate in scaled networks. Portfolio data shows consistent United States investor participation in Europe’s top tiers, which brings practices from other sports that emphasize data, operations, and fan engagement. The football clubs market continues to balance tradition with capital access as governance frameworks converge on common financial safeguards.
Geography Analysis
Europe held a 52.12% share in 2025, supported by major domestic and international rights deals and strong matchday economics, while Asia-Pacific is growing at an 8.61% CAGR, widening the regional footprint of the football clubs market. Germany delivered record revenue in 2024/25 and continues to emphasize sustainable growth through fan-first operations and prudent cost management. Italy’s broad revenue base coexists with margin pressure from wage structures, which signals ongoing reforms to align spending with long-term income. France’s D2C launch helps cushion the shift in domestic rights, and early traction with subscribers indicates room to optimize pricing and content. North America, the Middle East, and South America present growth pockets where clubs benefit from venue growth, investor interest, and rising broadcaster engagement.
International rights and strategic partnerships reinforce the regional mosaic that underpins the football clubs market. LaLiga’s United States deal extends reach into one of the largest media economies, and the Bundesliga’s Saturday conference and Sunday match package builds continuity across the calendar. Tournament expansions add fresh inventory and keep clubs in competitive cycles that feed broadcast and sponsorship value across geographies. Saudi Arabia’s program to elevate league quality through investments and marquee signings has shifted regional attention and bidding power for talent and content. Governance harmonization continues, although enforcement intensity varies by jurisdiction and can create short-term arbitrage for clubs with different ownership and regulatory profiles.
North America will be buoyed by a packed cycle that includes a major international tournament in 2026 and strong franchise valuations in MLS. Asia-Pacific is expected to keep drawing international tours and sponsorship commitments as broadcasters and platforms expand local content menus. South American clubs are advancing governance and stadium programs that open the door to private capital and new commercial operations, even as currency volatility requires careful planning. The Middle East is leveraging coordinated investment approaches that grow domestic league quality and build international event portfolios. These moves together support a broadening demand base and deepen the commercial structure of the football clubs market.

Competitive Landscape
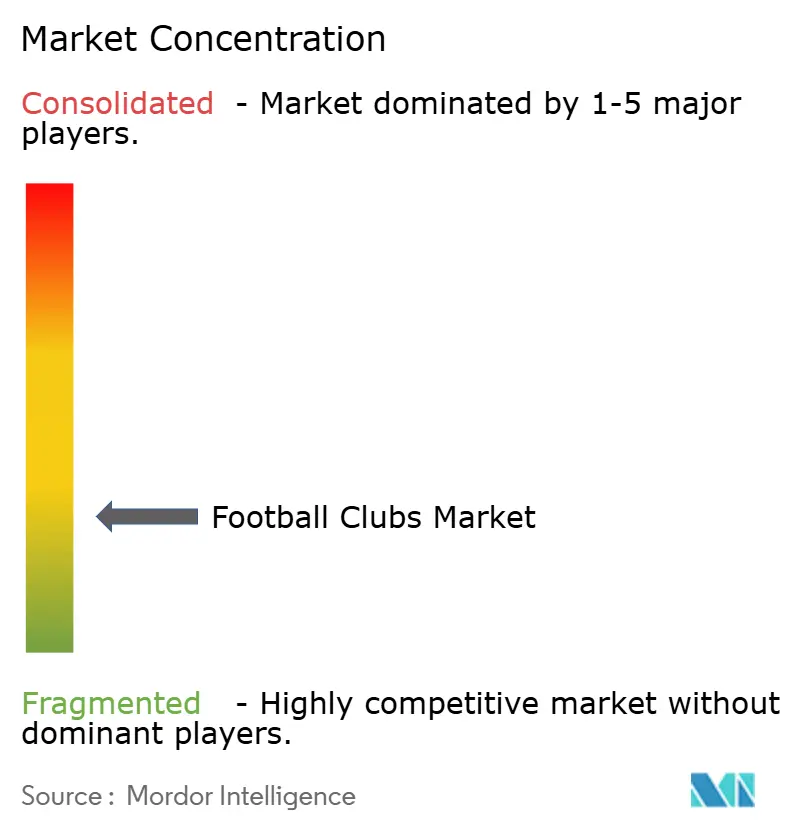
The football clubs market remains globally fragmented, with concentration occurring mainly at the league level and among top-revenue clubs. While elite clubs capture the majority of broadcast and sponsorship flows, many professional organizations operate with more limited access to these resources. Multi-club ownership is reshaping strategies by creating synergies in sponsorship, data, and talent management, while consolidating commercial negotiating power. Lessons from Germany show that disciplined cost management and fan-focused operations can sustain positive financial performance across a league. In contrast, some markets reveal the ongoing need for capital allocation and governance reforms to better align costs and revenues.
Strategic priorities for clubs continue to focus on premium infrastructure, diversified commercial partnerships, and international expansion. Leading clubs are demonstrating how investment in modern stadiums and venue redevelopment can significantly enhance matchday and non-matchday revenue. Venue transformations, including multi-purpose event hosting, help smooth seasonal fluctuations and reduce dependence on team performance. Clubs that strengthen direct-to-consumer channels and premium fan experiences are building more defensible and predictable cash flows. These approaches also support compliance with evolving financial regulations while reinforcing long-term commercial sustainability.
Competition in the market is increasingly defined by multi-revenue performance rather than purely sporting outcomes. Stable broadcast arrangements and strong matchday operations provide planning certainty for clubs, while direct fan engagement strategies empower leagues to own the consumer relationship. Regulatory oversight and antitrust actions, though introducing execution risk, improve transparency and tender processes. Investment from international stakeholders brings operational expertise and analytics capabilities that can benefit clubs across different leagues. Overall, governance, venue strategy, and digital monetization are becoming critical factors in determining outperformance in the football clubs market.
Football Clubs Industry Leaders
Real Madrid CF
Manchester City FC
Paris Saint-Germain FC
FC Barcelona
Manchester United FC
- *Disclaimer: Major Players sorted in no particular order

Recent Industry Developments
- January 2026: LaLiga’s General Assembly gave strong approval to the league’s consolidated financial statements for the 2024/25 season and the proposed budget for 2025/26. The overwhelming support from member clubs underscores confidence in LaLiga’s financial management and strategic planning. This endorsement reflects the league’s commitment to transparency, sustainability, and long-term stability.
- June 2025: Germany’s Bundeskartellamt ruled the Bundesliga’s 50+1 ownership rule permissible under cartel law but mandated reforms, including open member access for all clubs and transparent committee voting procedures. The decision preserves member control while closing loopholes that favored legacy exemptions, shaping the league’s investment landscape for the next decade.
- January 2025: Ligue 1 launched Ligue 1+, a direct-to-consumer streaming platform, after DAZN’s domestic broadcast deal collapsed. The service surpassed one million subscribers in its first month and distributed USD 166.6 million (Euro 142 million) to clubs for the 2025 season, though this fell short of prior broadcast cycles, forcing French clubs to explore alternative revenue streams, including international expansion and premium hospitality.
- May 2025: Hankook Tire has signed a multi-season official sponsorship agreement with Saudi Pro League club Al Ittihad, enhancing its sports marketing presence in the Middle East by leveraging the club’s high profile and globally recognized players to increase brand visibility, fan engagement, and promotional activities in the region.


Global Football Clubs Market Report Scope
In association football, a football club is a sports club that acts as an entity through which association football teams organize their sporting activities. The club can exist either as an independent unit or as part of a larger sports organization as a subsidiary of the parent club or organization.
The global football clubs market is segmented by type (ticket and corporate hospitality sales, television relay revenue share, sponsorship, and other business receipts), by application (the Premier League, La Liga, Serie A, Bundesliga, Ligue 1, other clubs (out of the five leagues), and by geography (North America, Europe, Asia-Pacific, Latin America, the Middle East, and Africa).
The report offers market size and forecasts for the global football clubs market in value (USD) for all the above segments.
| Ticket and Corporate Hospitality Sales |
| Television Relay Revenue Share |
| Sponsorship |
| Other Business Receipts |
| The Premier League |
| La Liga |
| Serie A |
| Bundesliga |
| Ligue 1 |
| Other Clubs (Out of The Five League) |
| Private Ownership |
| Member-Owned Clubs |
| Publicly Listed Clubs |
| State-Backed Clubs |
| Corporate-Owned Clubs |
| North America | Canada |
| United States | |
| Mexico | |
| South America | Brazil |
| Peru | |
| Chile | |
| Argentina | |
| Rest of South America | |
| Europe | United Kingdom |
| Germany | |
| France | |
| Spain | |
| Italy | |
| BENELUX (Belgium, Netherlands, and Luxembourg) | |
| NORDICS (Denmark, Finland, Iceland, Norway, and Sweden) | |
| Rest of Europe | |
| Asia-Pacific | India |
| China | |
| Japan | |
| Australia | |
| South Korea | |
| South East Asia (Singapore, Malaysia, Thailand, Indonesia, Vietnam, and Philippines) | |
| Rest of Asia-Pacific | |
| Middle East and Africa | United Arab Emirates |
| Saudi Arabia | |
| South Africa | |
| Nigeria | |
| Rest of Middle East and Africa |
| By Type | Ticket and Corporate Hospitality Sales | |
| Television Relay Revenue Share | ||
| Sponsorship | ||
| Other Business Receipts | ||
| By Application | The Premier League | |
| La Liga | ||
| Serie A | ||
| Bundesliga | ||
| Ligue 1 | ||
| Other Clubs (Out of The Five League) | ||
| By Ownership Structure | Private Ownership | |
| Member-Owned Clubs | ||
| Publicly Listed Clubs | ||
| State-Backed Clubs | ||
| Corporate-Owned Clubs | ||
| By Geography | North America | Canada |
| United States | ||
| Mexico | ||
| South America | Brazil | |
| Peru | ||
| Chile | ||
| Argentina | ||
| Rest of South America | ||
| Europe | United Kingdom | |
| Germany | ||
| France | ||
| Spain | ||
| Italy | ||
| BENELUX (Belgium, Netherlands, and Luxembourg) | ||
| NORDICS (Denmark, Finland, Iceland, Norway, and Sweden) | ||
| Rest of Europe | ||
| Asia-Pacific | India | |
| China | ||
| Japan | ||
| Australia | ||
| South Korea | ||
| South East Asia (Singapore, Malaysia, Thailand, Indonesia, Vietnam, and Philippines) | ||
| Rest of Asia-Pacific | ||
| Middle East and Africa | United Arab Emirates | |
| Saudi Arabia | ||
| South Africa | ||
| Nigeria | ||
| Rest of Middle East and Africa | ||


Key Questions Answered in the Report
What is the current football clubs market size and growth outlook through 2031?
The football clubs market is expected to grow from USD 13.22 billion in 2025 to USD 14.23 billion in 2026 and is forecast to reach USD 20.52 billion by 2031 at 7.61% CAGR over 2026-2031.
Which revenue categories are growing fastest across clubs?
Other business receipts, including digital content, stadium tours, and fan-token initiatives, are projected to grow at a 16.12% CAGR through 2031, outpacing traditional media and matchday lines.
Which competition segment holds the largest share today?
The Premier League led application share at 21.34% in 2025 due to premium domestic rights, strong international deals, and robust sponsorship economics.
Which regions are expanding most quickly?
Asia-Pacific is advancing at an 8.61% CAGR through 2031 as investment, marquee signings, and broadcaster demand increase, while Europe remains the largest region by share.
How are regulations shaping club strategies in 2026?
UEFA’s Financial Sustainability Regulations enforce a 70% squad cost-to-revenue ratio from 2025/26, which prioritizes wage discipline and pushes clubs toward recurring commercial income.
What strategies help clubs offset mature broadcast markets?
Clubs are scaling D2C streaming, dynamic pricing, PSLs, and non-matchday events, while modern stadiums and portfolio sponsorships drive steadier revenue and higher margins.
Page last updated on:


