Market Overview
| Study Period | 2020 - 2031 |
|---|---|
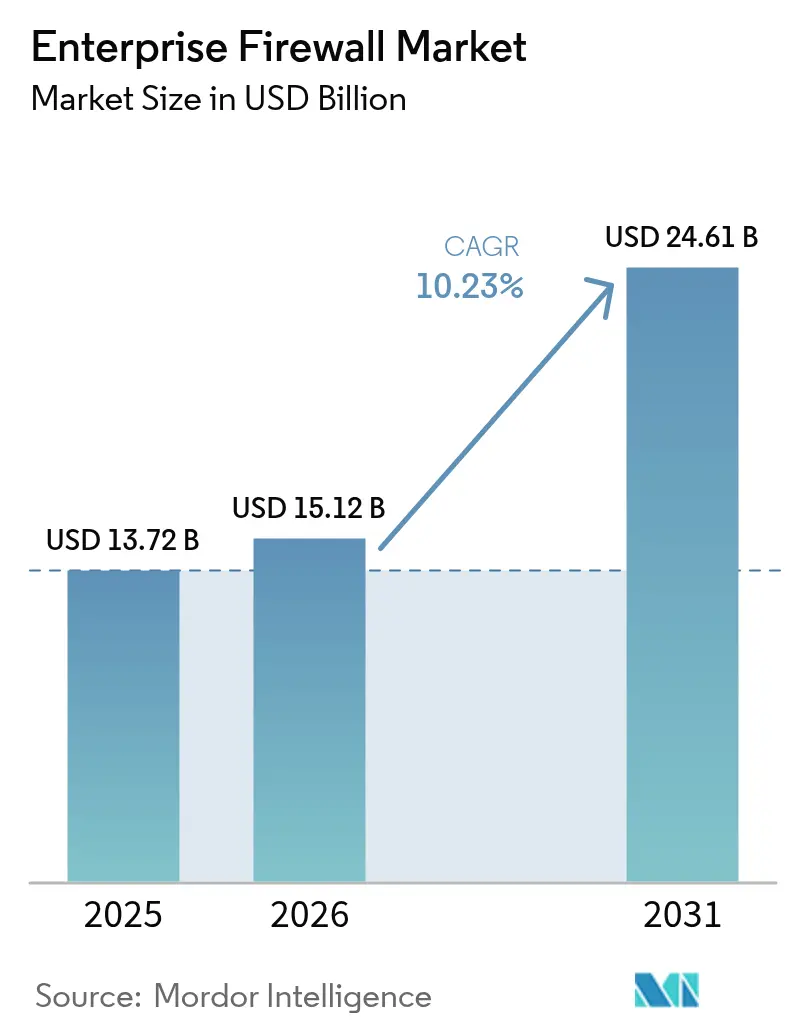
| Market Size (2026) | USD 15.12 Billion |
| Market Size (2031) | USD 24.61 Billion |
| Growth Rate (2026 - 2031) | 10.23% CAGR |
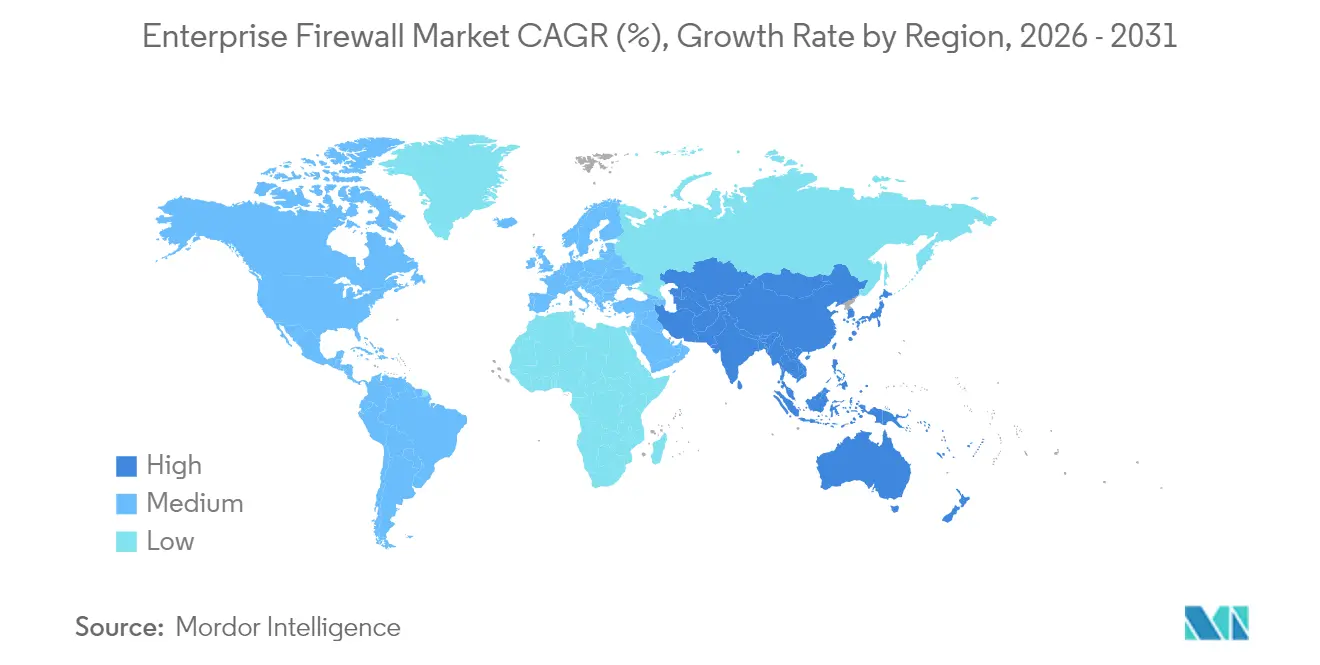
| Fastest Growing Market | Asia-Pacific |
| Largest Market | North America |
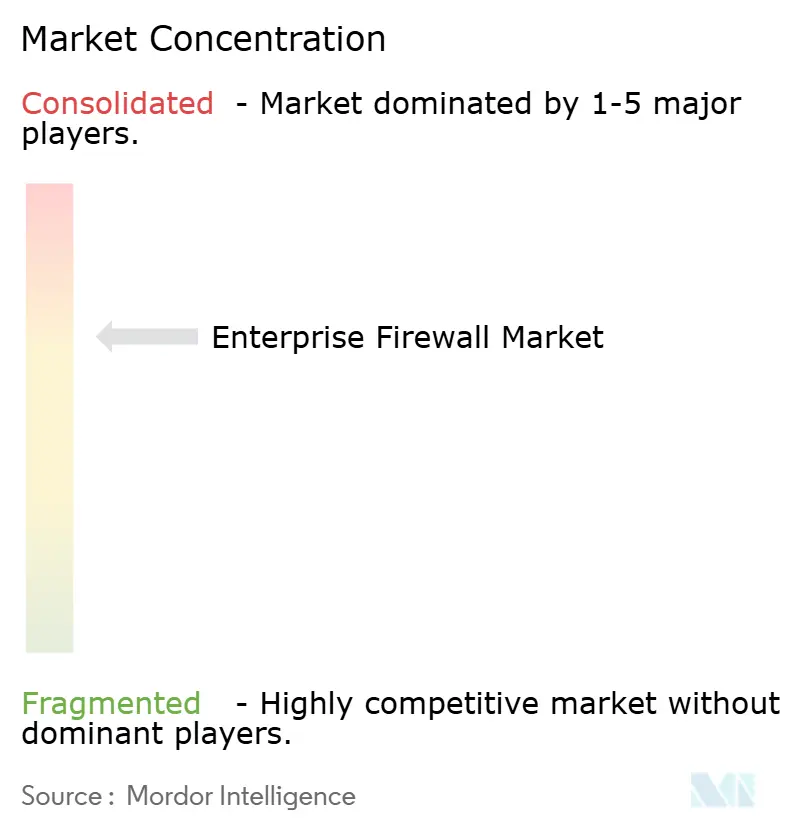
| Market Concentration | Medium |
Major Players *Disclaimer: Major Players sorted in no particular order Image © Mordor Intelligence. Reuse requires attribution under CC BY 4.0. | |
Enterprise Firewall Market Analysis by Mordor Intelligence
The Enterprise Firewall Market size in 2026 is estimated at USD 15.12 billion, growing from 2025 value of USD 13.72 billion with 2031 projections showing USD 24.61 billion, growing at 10.23% CAGR over 2026-2031. Hybrid work models add urgency, pushing buyers toward Firewall-as-a-Service to protect remote users while reducing hardware overhead. [1]Microsoft, “What Is Azure Firewall?” Microsoft.com Vendors respond with unified platforms that blend network and security functions, while compliance frameworks such as PCI DSS and DORA increase demand for continuous policy enforcement and audit reporting. Semiconductor cost inflation and skills shortages constrain short-term hardware rollouts, yet subscription revenues keep margins resilient as platformization gains pace.
Key Report Takeaways
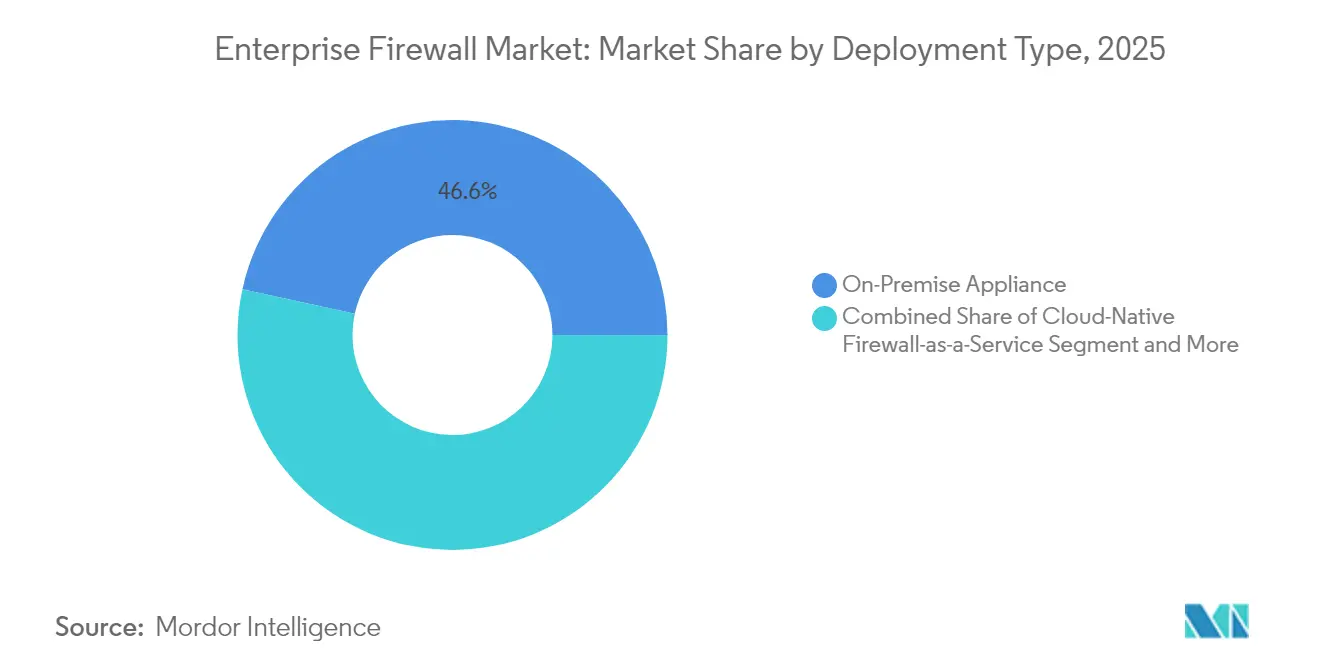
- By deployment type, on-premise appliances held 46.58% of the enterprise firewall market share in 2025, while cloud-native Firewall-as-a-Service is forecast to grow at a 13.68% CAGR through 2031.
- By component, hardware appliances contributed 47.65% revenue share in 2025; managed and professional services are projected to expand at a 13.52% CAGR to 2031.
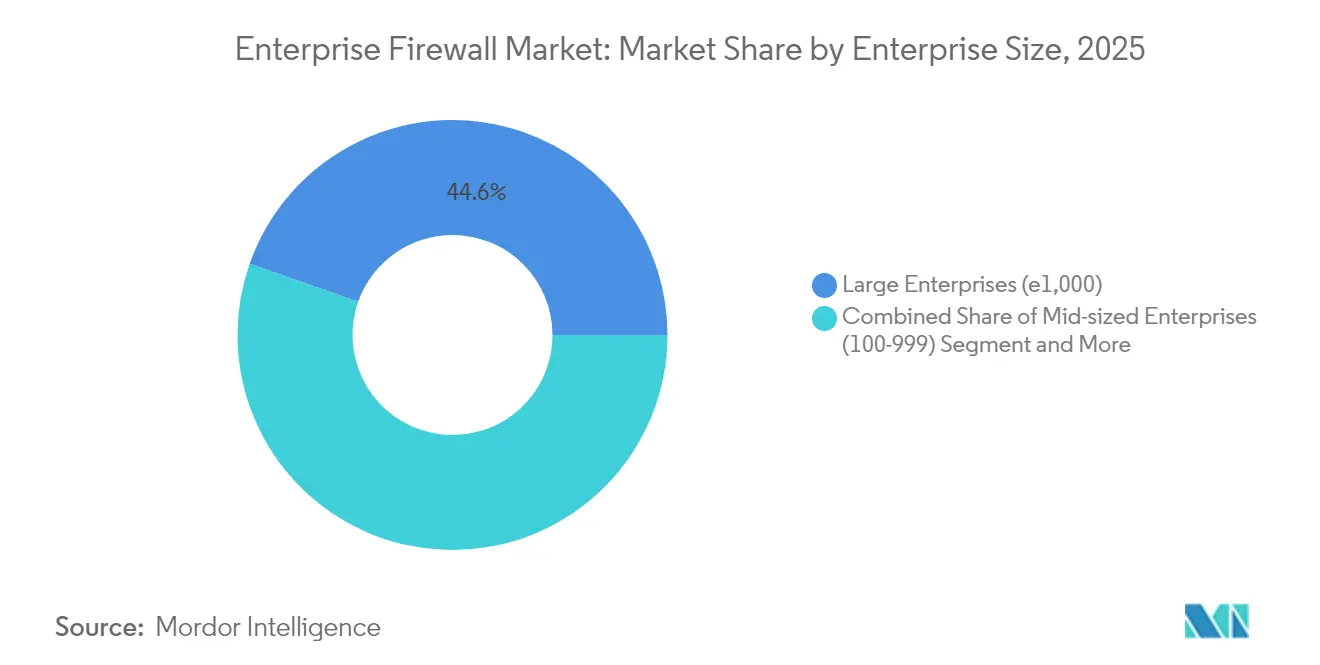
- By enterprise size, large organizations accounted for 44.62% of 2025 revenues, whereas small and micro enterprises are set to grow at 13.84% CAGR, aided by cloud-delivered entry-level offerings.
- By industry, BFSI led with a 27.12% share in 2025, while retail and e-commerce are expected to register the fastest 12.76% CAGR, owing to rising digital payments and compliance needs.
- By geography, North America commanded 35.02% of 2025 revenues; Asia-Pacific is positioned for a 12.38% CAGR on the back of digital sovereignty programs and cloud investment.
Note: Market size and forecast figures in this report are generated using Mordor Intelligence’s proprietary estimation framework, updated with the latest available data and insights as of 2026.
Global Enterprise Firewall Market Trends and Insights
Drivers Impact Analysis*
| Driver | (~) % Impact on CAGR Forecast | Geographic Relevance | Impact Timeline |
|---|---|---|---|
| Escalating sophistication of multi-vector attacks | +2.8% | North America, Europe | Short term (≤ 2 years) |
| Rapid adoption of hybrid and remote work | +2.1% | North America, spreading to Asia-Pacific | Medium term (2-4 years) |
| Regulatory mandates for zero-trust segmentation | +1.9% | North America, Europe, expanding to Asia-Pacific | Long term (≥ 4 years) |
| Cloud workload proliferation | +1.7% | Global, highest in Asia-Pacific | Medium term (2-4 years) |
| AI-driven polymorphic malware | +1.4% | Technology hubs worldwide | Short term (≤ 2 years) |
| Sovereign traffic-inspection clauses | +1.2% | Asia-Pacific, Middle East, Latin America | Long term (≥ 4 years) |
| Source: Mordor Intelligence | |||
Escalating Sophistication of Multi-Vector Attacks
Attackers now weaponize legitimate software and AI to breach endpoints, cloud workloads, and lateral pathways in one campaign, leaving static rule sets ineffective. Palo Alto Networks observed that 86% of incidents in 2024 caused direct business disruption, prompting enterprises to deploy next-generation firewalls that correlate real-time intelligence across distributed sensors. A global telecom uncovered more than 200 privileged sessions sitting outside domain controllers, underscoring east-west blind spots. [2]Reveald, “Global Industrial Company Case Study,” Reveald.com Vendors embed machine-learning inspection to flag behavioral anomalies, enabling enterprises to quarantine suspicious traffic within milliseconds and cut dwell time.
Rapid Adoption of Hybrid and Remote Work Architectures
Decentralized workforces rely on home networks and unmanaged devices, expanding the threat surface far beyond data-center perimeters. Organizations shift toward secure access service edge models that fuse identity, device health, and firewall controls inside a single cloud point of enforcement. Microsoft notes that encrypted VPN tunnels often evade traditional inspection, so many firms migrate to Firewall-as-a-Service for uniform policy wherever users connect. Partnerships such as Bell Canada with Palo Alto Networks highlight how carriers wrap AI-powered firewalls around managed connectivity for remote teams.
Regulatory Mandates for Zero-Trust and Segmentation
Updated frameworks such as the U.S. Department of Defense Zero Trust Overlays require continuous verification and micro-segmentation, pushing enterprises to deploy firewalls that adjust policies dynamically on risk signals. Compliance programs, including DORA and HIPAA, now expect granular audit trails and automated policy evidence, making manual rule maintenance unsustainable. An American manufacturer adopted Fortinet Security Fabric to meet new certification targets and cut ongoing configuration workload by 30%.
Cloud Workload Proliferation Requiring East-West Security
Containerized and serverless apps spin up thousands of ephemeral flows that bypass perimeter choke points. Google Cloud’s hierarchical firewall policies illustrate how micro-segmentation must scale programmatically rather than appliance by appliance. Industrial adopters such as SCG Chemicals use distributed firewalls to protect operational technology traffic while aligning with IEC-62443 standards. Vendors answer with API-driven policy engines and context-aware deep-packet inspection that follow every workload regardless of location.
Restraints Impact Analysis*
| Restraint | (~) % Impact on CAGR Forecast | Geographic Relevance | Impact Timeline |
|---|---|---|---|
| Budget constraints among SMBs | -1.8% | Emerging markets worldwide | Medium term (2-4 years) |
| Skills shortage for complex policy management | -1.4% | North America, Europe | Long term (≥ 4 years) |
| IPv6 transition delaying hardware refresh | -0.9% | Global | Medium term (2-4 years) |
| Data-residency shift to regional SOCs | -0.7% | Europe, Asia-Pacific | Long term (≥ 4 years) |
| Source: Mordor Intelligence | |||
Budget Constraints Among SMBs
Many small firms lack full-time security personnel and face pressure to allocate limited capital to core operations, slowing the adoption of advanced firewalls. Cyber-insurance carriers now offer premium reductions to policyholders that deploy managed security services, but up-front subscription costs still deter buyers in price-sensitive regions. Vendors respond with entry-level cloud firewalls that include automated policy templates and usage-based billing, lowering procurement hurdles.
Skills Shortage to Manage Complex Policies
AI-augmented firewalls promise automation, yet they require teams versed in threat-intelligence feeds, segmentation design, and machine-learning tuning. Rockwell Automation highlights that industrial operators need staff who understand both IT and OT protocols, a rare combination commanding premium wages. [3]Rockwell Automation, “Best Practices for OT Firewall Management,” Rockwellautomation.com Organizations increasingly outsource 24/7 monitoring to managed detection and response partners, fueling the services CAGR while limiting do-it-yourself deployments.
*Our forecasts treat driver/restraint impacts as directional, not additive. The impact forecasts reflect baseline growth, mix effects, and variable interactions.
Segment Analysis
By Deployment Type: Cloud-Native Gains Momentum
On-premise appliances retained 46.58% of the 2025 enterprise firewall market share on the back of predictable throughput and regulatory comfort with air-gapped designs. In revenue terms, the segment accounted for the largest slice of the enterprise firewall market size, even as refresh cycles extend because of protocol migration uncertainty. Enterprises running latency-sensitive workloads in data centers continue to favor purpose-built hardware that embeds accelerators for high-speed TLS inspection.
Cloud-native Firewall-as-a-Service, advancing at a 13.68% CAGR through 2031, brings centralized policy, elastic scale, and pay-as-you-grow economics that resonate with firms embracing multicloud and remote work strategies. The model also simplifies compliance evidence because providers surface continuous audit logs via portals. Virtual appliances sit between both worlds, letting enterprises replicate rule sets across private clouds and edge locations without shipping hardware, which eases branch rollouts during zero-trust transitions. The blended approach underlines how buyers now map firewall form factor to workload locality rather than defaulting to a single architecture.


By Component: Services Surge as Complexity Increases
Hardware appliances captured 47.65% of 2025 revenues, reflecting persistent demand for deterministic performance, hardware encryption offload, and tamper-resistant designs that satisfy audit teams. This slice of the enterprise firewall market size is expected to grow steadily, yet its proportion declines as buyers shift budget toward lifecycle services that unlock the appliance’s full potential.
Managed and professional services are forecast to expand at 13.52% CAGR because continuous tuning, threat-feed integration, and compliance reporting outstrip many in-house teams’ bandwidth. Service providers bundle playbooks for DORA, HIPAA, and sector-specific standards, helping clients cut mean-time-to-respond and satisfy regulators. Vendors increasingly embed AI-driven copilots into management consoles, yet human specialists remain essential for contextualising anomalies and aligning policies with evolving business objectives.
By Enterprise Size: SMBs Embrace Accessible Solutions
Large organizations held 44.62% of 2025 spending, sustaining the biggest single slice of the enterprise firewall market size thanks to sizeable threat-hunting teams and capital budgets for global rollouts. They drive early adoption of AI inspection engines and sandbox detonation features, often piloting capabilities that cascade downstream once proven.
Small and micro enterprises are projected to post a 13.84% CAGR through 2031 as Firewall-as-a-Service reduces up-front costs and automates day-to-day administration. Microsoft’s Azure Firewall Basic and Fortinet’s SMB-focused bundles pre-load recommended rules, freeing owners from complex configuration. Midmarket firms act as the bridge, often co-sourcing policy management with MSSPs while retaining visibility through shared portals.
By End-user Industry: BFSI Leads, Retail Accelerates
Banking, financial services, and insurance generated 27.12% of 2025 revenues, making it the largest vertical slice of the enterprise firewall market. Strict data-protection mandates, real-time fraud risks, and 24/7 uptime expectations push banks toward clustered active-active firewalls that embed behavioral analytics. A major North American institution projects USD 100 million savings over five years after replacing legacy rule sets with Fortinet’s automated fabric that slashes change-window labor.
Retail and E-commerce are forecast to expand at a 12.76% CAGR to 2031, supported by surging online transaction volumes and point-of-sale digitization that expose merchants to credential-stuffing and card-skimming attacks. Omnichannel strategies demand consistent policy across stores, mobile apps, and fulfillment centers, driving adoption of cloud firewalls that integrate web-application protection and bot mitigation. Manufacturing, healthcare, and public sector segments follow close behind as Industry 4.0 and electronic health record initiatives widen attack surfaces.
Geography Analysis
North America led with 35.02% of 2025 revenues, anchored by strict federal rules and high breach remediation costs that spur proactive purchasing. Enterprises there standardize on zero-trust architectures and increasingly choose consolidated platforms to cut operational fragments. Bell Canada’s alliance with Palo Alto Networks shows how telcos bundle AI-driven firewalls with connectivity to serve a dispersed workforce.
Asia-Pacific is set for a 12.38% CAGR through 2031, the fastest across regions. Governments in India, Indonesia, and Japan press for local inspection of citizen data, encouraging procurement of firewalls deployable in country-specific clouds. Domestic vendors in China gain share by aligning with encryption rules and supplying inline machine-learning modules that process Mandarin threat intel. Multinational cloud providers partner with regional SOC operators to satisfy sovereignty clauses while maintaining global telemetry reach.
Europe maintains steady momentum on GDPR and the upcoming DORA framework, which requires demonstrable segmentation and incident reporting. SonicWall’s new European SOC exemplifies vendor investment to provide local data handling and rapid response aligned with residency laws. Germany and the United Kingdom focus on industrial espionage defenses, whereas France and Spain invest in cloud firewalls capable of per-tenant policy isolation for multicloud expansion.

Competitive Landscape
The enterprise firewall market shows moderate concentration. Fortinet, Palo Alto Networks, and Check Point anchor the field with extensive portfolios, yet the top five providers collectively control less than 70% of revenue, leaving room for innovators. Fortinet leverages over 500 AI patents to embed generative models inside its Security Fabric, while Palo Alto Networks’ Precision AI blends machine learning, deep learning, and LLMs for context-aware detection. Both firms prioritize ARR growth: Palo Alto Networks reported USD 5.1 billion in next-generation security ARR for fiscal Q1 2025, up 34% year over year.
Acquisition strategy accelerates convergence. Fortinet bought Lacework to bolster cloud workload protection and Next DLP for data loss prevention, while Cisco moved for Splunk to broaden telemetry and response orchestration. Check Point refocused on Infinity Global Services to lift subscription mix to 83% of revenue, signalling a switch from box-based billing to OPEX models.
Challengers differentiate via probabilistic firewalls and AI-native architectures that score traffic risk rather than match it to static rules. White-space also appears in operational-technology security, where vendors such as Rockwell Automation partner with firewall providers to fuse deterministic latency controls with deep packet inspection. Supply-chain chip constraints squeeze appliance margins yet push incumbents to invest in FPGA-based acceleration that reduces silicon dependence, thereby buffering future shortages.
Enterprise Firewall Industry Leaders
Fortinet, Inc.
Palo Alto Networks, Inc.
Check Point Software Technologies Ltd.
Cisco Systems, Inc.
Juniper Networks, Inc.
- *Disclaimer: Major Players sorted in no particular order

Recent Industry Developments
- June 2025: Fortinet released its AI-powered Workspace Security suite to extend protection across Microsoft 365 and Google Workspace collaboration channels.
- May 2025: Zscaler deployed 25 new European data centers to satisfy sovereignty rules and strengthen low-latency inspection.
- February 2025: Palo Alto Networks posted USD 2.29 billion revenue for Q1 2025, with next-generation security ARR hitting USD 5.1 billion.
- December 2024: Bell Canada partnered with Palo Alto Networks to bundle Prisma Access, Next-Generation Firewalls, and Cortex XSIAM in managed security offerings.
- August 2024: Fortinet acquired Next DLP to integrate enterprise data loss prevention with SASE portfolios.


Research Methodology Framework and Report Scope
Market Definitions and Key Coverage
Our study defines the enterprise firewall market as all on-premise appliances, virtual instances, and cloud-native Firewall-as-a-Service platforms that inspect and control north-south or east-west traffic at the network edge or within distributed workloads. According to Mordor Intelligence, revenues linked to maintenance, threat-intelligence subscriptions, and managed firewall services are included where they are bundled or indispensable to core firewall functionality.
Scope Exclusions: Stand-alone web application firewalls, pure SD-WAN gateways, and single-purpose intrusion detection sensors remain outside the present scope.
Segmentation Overview
- By Deployment Type
- On-Premise Appliance
- Cloud-Native Firewall-as-a-Service (FWaaS)
- Hybrid/Virtual Appliance
- By Component
- Hardware Appliance
- Virtual Appliance/Software
- Managed and Professional Services
- By Enterprise Size
- Small and Micro Enterprises ( <100 employees )
- Mid-sized Enterprises (100-999)
- Large Enterprises (≥1,000)
- By End-user Industry
- BFSI
- Healthcare and Life Sciences
- Manufacturing and Industrial
- Government and Defense
- Retail and E-commerce
- Telecom and Media
- Education and Research
- Energy and Utilities
- Other End-user Industries
- By Geography
- North America
- United States
- Canada
- Mexico
- South America
- Brazil
- Argentina
- Chile
- Rest of South America
- Europe
- Germany
- United Kingdom
- France
- Italy
- Spain
- Russia
- Rest of Europe
- Asia-Pacific
- China
- India
- Japan
- South Korea
- Singapore
- Malaysia
- Australia
- Rest of Asia-Pacific
- Middle East and Africa
- Middle East
- United Arab Emirates
- Saudi Arabia
- Turkey
- Rest of Middle East
- Africa
- South Africa
- Nigeria
- Egypt
- Rest of Africa
- Middle East
- North America
Detailed Research Methodology and Data Validation
Primary Research
Mordor analysts interviewed network architects at managed security providers, CISOs from finance, healthcare, and manufacturing firms across North America, Europe, and Asia-Pacific, plus senior product managers at leading firewall vendors. These conversations validated deployment trends, typical ASP movements, and the realistic pace of FWaaS adoption.
Desk Research
Analysts first mapped the firewall demand pool through public sources such as the US Federal Communications Commission, Eurostat ICT surveys, Japan's MIC cyber-security white papers, and global customs records for HS code 8517.62 appliance exports. Company 10-Ks, earnings calls, and threat-intelligence advisories then helped us track vendor revenue mix and average selling prices. Paid repositories like D&B Hoovers and Dow Jones Factiva supplied hard-to-find split-outs on regional shipments, while Questel patent analytics signaled technology refresh cycles. The named sources are illustrative; many additional publications supported data cross-checks and clarifications.
Market-Sizing & Forecasting
For the baseline year, a top-down reconstruction of global firewall revenue was created from vendor filings, adjusted for channel margins and double counting, and then corroborated with selective bottom-up roll-ups of sampled appliance shipments multiplied by blended ASPs. Key inputs, enterprise IT security spend, cloud workload growth, remote employee share, regulatory rollout intensity, average refresh cycles, and price erosion drive the multivariate regression forecast to 2030. Where shipment data proved patchy, we filled gaps using regional penetration rates benchmarked against installed server counts before triangulating with primary interview insights.
Data Validation & Update Cycle
Models pass two layers of variance and anomaly checks, after which senior reviewers sign off. Reports refresh each year, with off-cycle revisions triggered by events such as major regulatory mandates or vendor mergers. A short validation pass is run immediately prior to client delivery.
Why Mordor's Enterprise Firewall Baseline Inspires Confidence
Published values often diverge because firms select different deployment mixes, convert currencies on dissimilar dates, or refresh models irregularly.
By anchoring our scope strictly to core firewall functions and by revisiting channel data every twelve months, Mordor delivers a figure users can trace to transparent variables.
Benchmark comparison
| Market Size | Anonymized source | Primary gap driver |
|---|---|---|
| USD 13.72 Bn (2025) | Mordor Intelligence | - |
| USD 14.18 Bn (2024) | Global Consultancy A | Bundles adjacent secure-web gateways and uses calendar-year averages for FX, inflating base |
| USD 11.30 Bn (2023) | Industry Association B | Omits subscription renewals and FWaaS fees, leading to understated totals |
Differences show that broader or narrower service definitions, subscription treatment, and refresh cadence can sway totals by several billion dollars. Our disciplined inclusion rules and annual update rhythm therefore provide decision-makers with the most balanced, dependable starting point.


Key Questions Answered in the Report
What is the current value of the enterprise firewall market?
The market stands at USD 15.12 billion in 2026.
How fast is the enterprise firewall market expected to grow?
It is projected to expand at a 10.23% CAGR to reach USD 24.61 billion by 2031.
Which deployment model is growing the quickest?
Cloud-native Firewall-as-a-Service is set to grow at a 13.68% CAGR through 2031.
Why are services outpacing hardware in growth?
Skills shortages and complex compliance demands push enterprises to rely on managed and professional services, which are forecast to rise at a 13.52% CAGR.
Which region offers the highest growth potential?
Asia-Pacific, propelled by digital sovereignty mandates, is forecast to record a 12.38% CAGR through 2031.
What drives firewall adoption in the BFSI sector?
Strict regulatory requirements, high-value data assets, and real-time fraud risks make BFSI the largest vertical, holding 27.12% of 2025 revenues.
Page last updated on:


