Data Acquisition (DAQ) Market Size and Share
Market Overview
| Study Period | 2020 - 2031 |
|---|---|
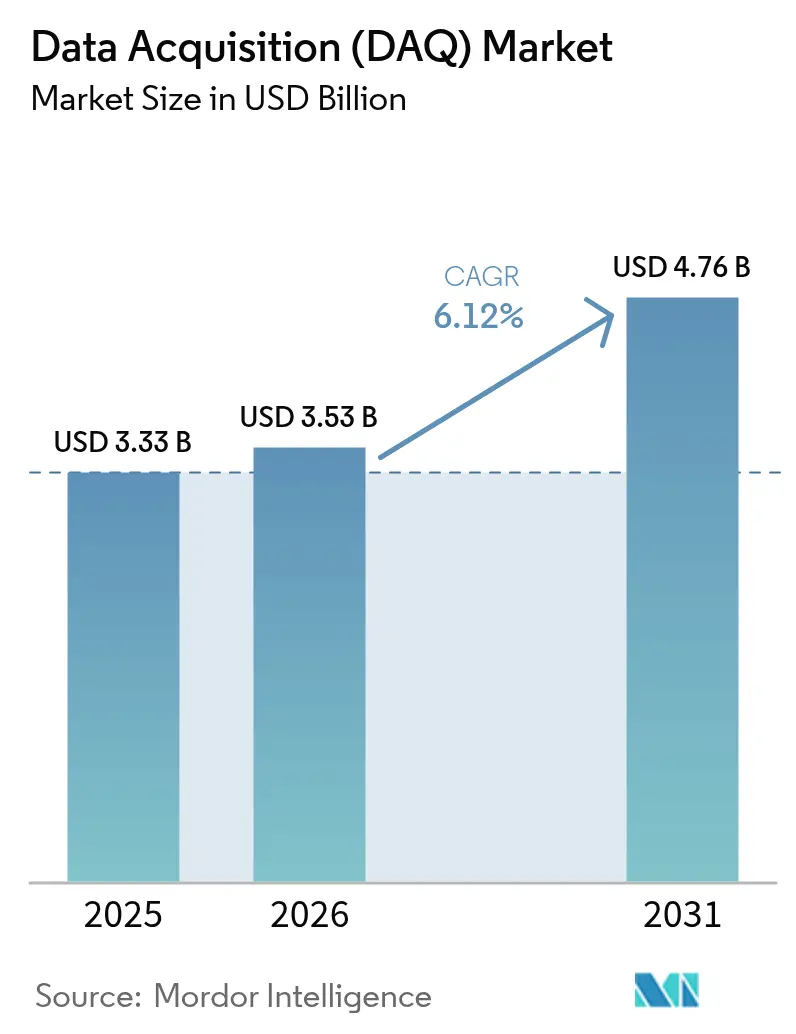
| Market Size (2026) | USD 3.53 Billion |
| Market Size (2031) | USD 4.76 Billion |
| Growth Rate (2026 - 2031) | 6.12% CAGR |
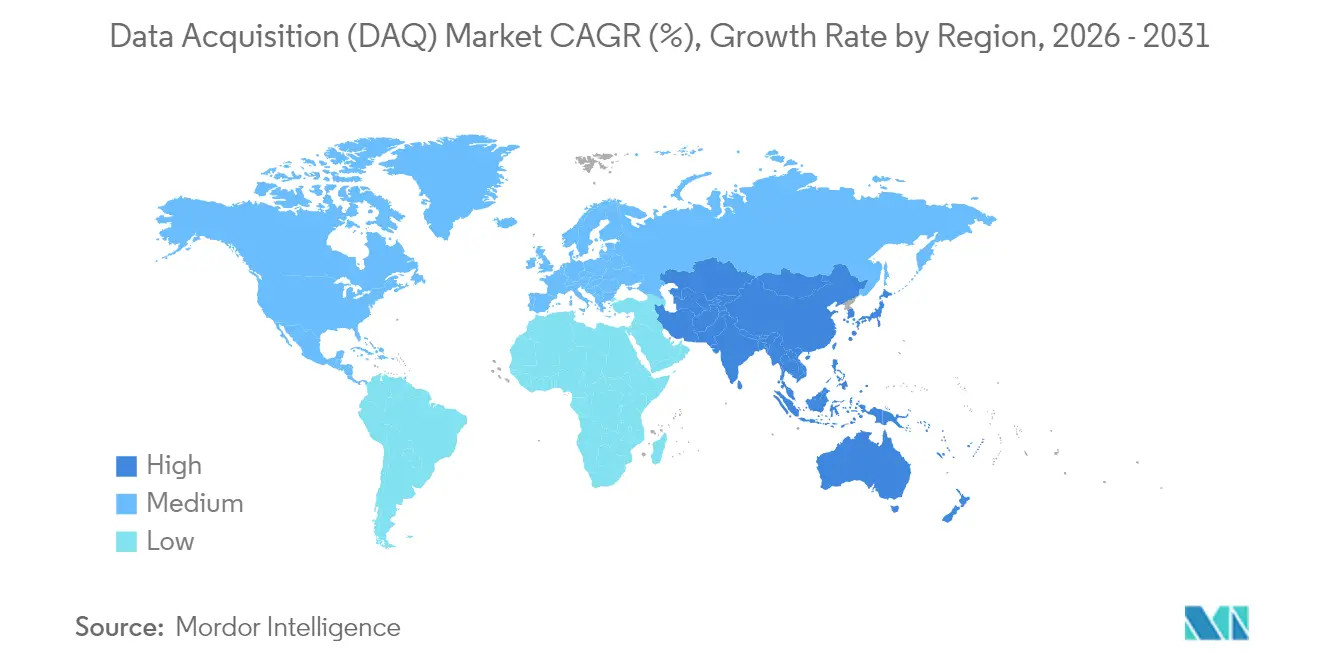
| Fastest Growing Market | Asia Pacific |
| Largest Market | North America |
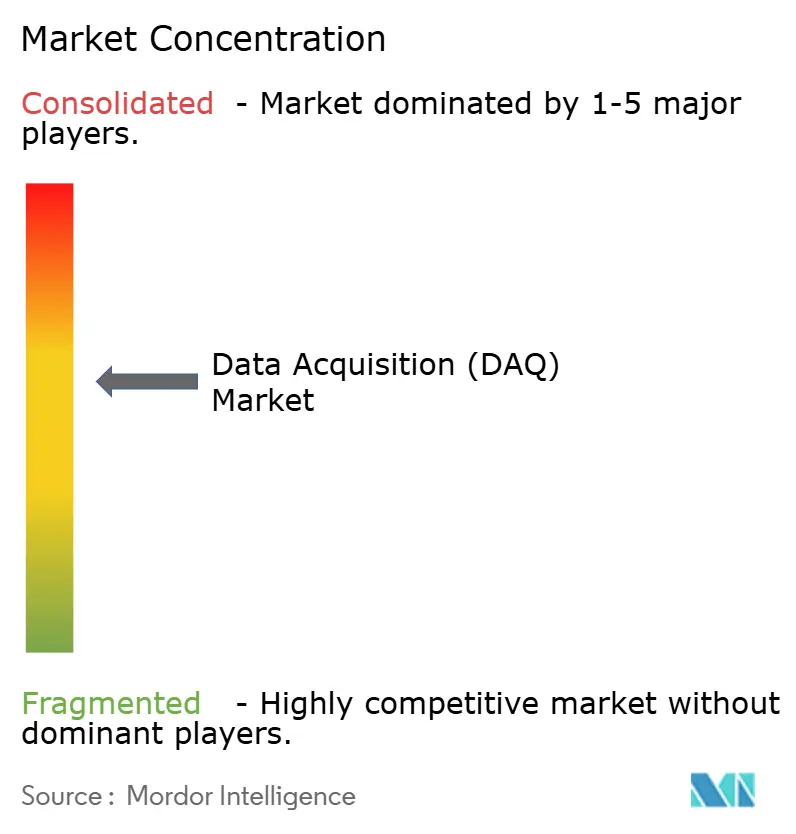
| Market Concentration | Medium |
Major Players
*Disclaimer: Major Players sorted in no particular order Image © Mordor Intelligence. Reuse requires attribution under CC BY 4.0. |
|
Data Acquisition (DAQ) Market Analysis by Mordor Intelligence
The Global Data Acquisition (DAQ) market size is expected to grow from USD 3.33 billion in 2025 to USD 3.53 billion in 2026 and is forecast to reach USD 4.76 billion by 2031 at 6.12% CAGR over 2026-2031. Hardware platforms continued to dominate because laboratories, factories, and test cells relied on proven sensor-to-digitizer chains, yet spending shifted steadily toward software-defined architectures that extended hardware life and improved channel configurability.[1]National Instruments, “Data Acquisition (DAQ) Systems, Devices & Software,” ni.com Rapid electrification of vehicles, rising battery gigafactory investments, and the deployment of Time-Sensitive Networking (TSN) raised the technical bar for measurement precision and time-correlated data streams across thousands of channels. Wireless interfaces expanded quickly as engineers prioritized installation flexibility in harsh or mobile environments, while edge-enabled analytics reduced latency and trimmed host-computer workloads in predictive-maintenance rollouts across Asia-Pacific manufacturing hubs. Regionally, North America retained leadership owing to its deep aerospace and defense test infrastructure, whereas Asia-Pacific emerged as the fastest-growing arena on the back of semiconductor and EV boomtowns. Competitive intensity rose as specialized software firms entered with cloud-ready analytics stacks, nudging incumbent hardware vendors to bundle integrated ecosystems rather than stand-alone devices.
Key Report Takeaways
- By offering, hardware held 69.80% of Data Acquisition market share in 2025, while software solutions are projected to expand at a 9.22% CAGR through 2031.
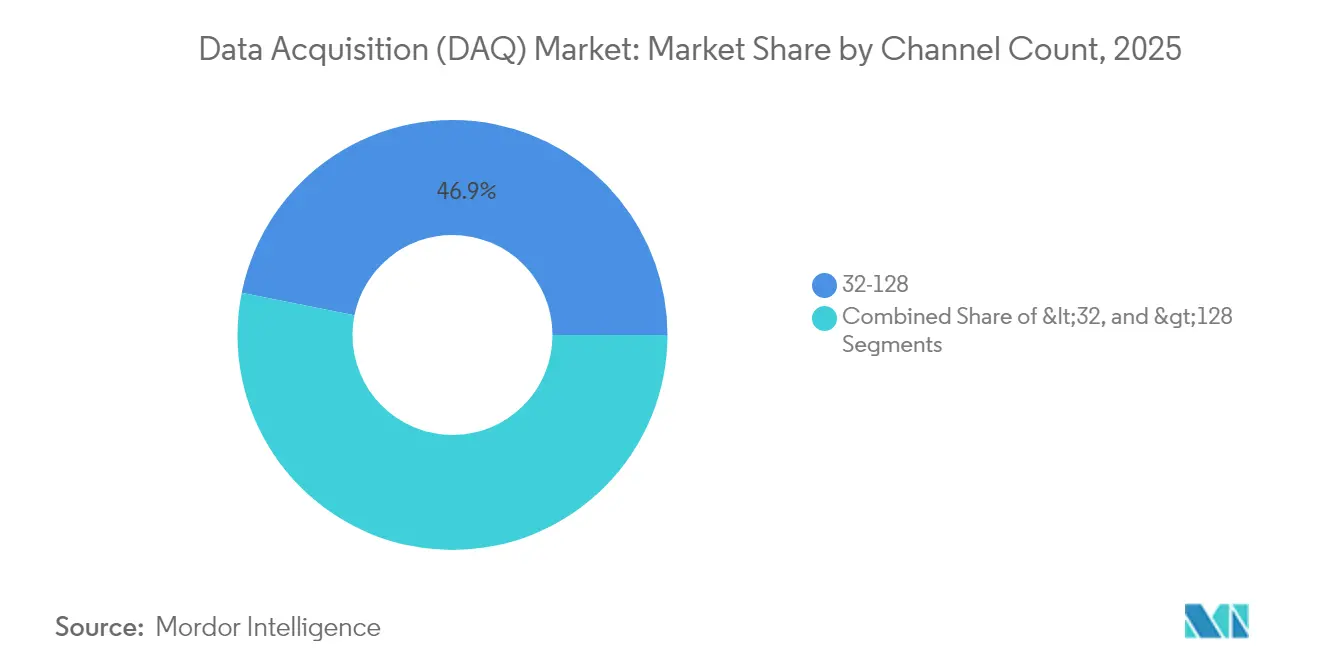
- By channel count, the 32-128 channel segment led with 46.85% revenue share in 2025; systems above 128 channels are forecast to rise at an 8.52% CAGR to 2031.
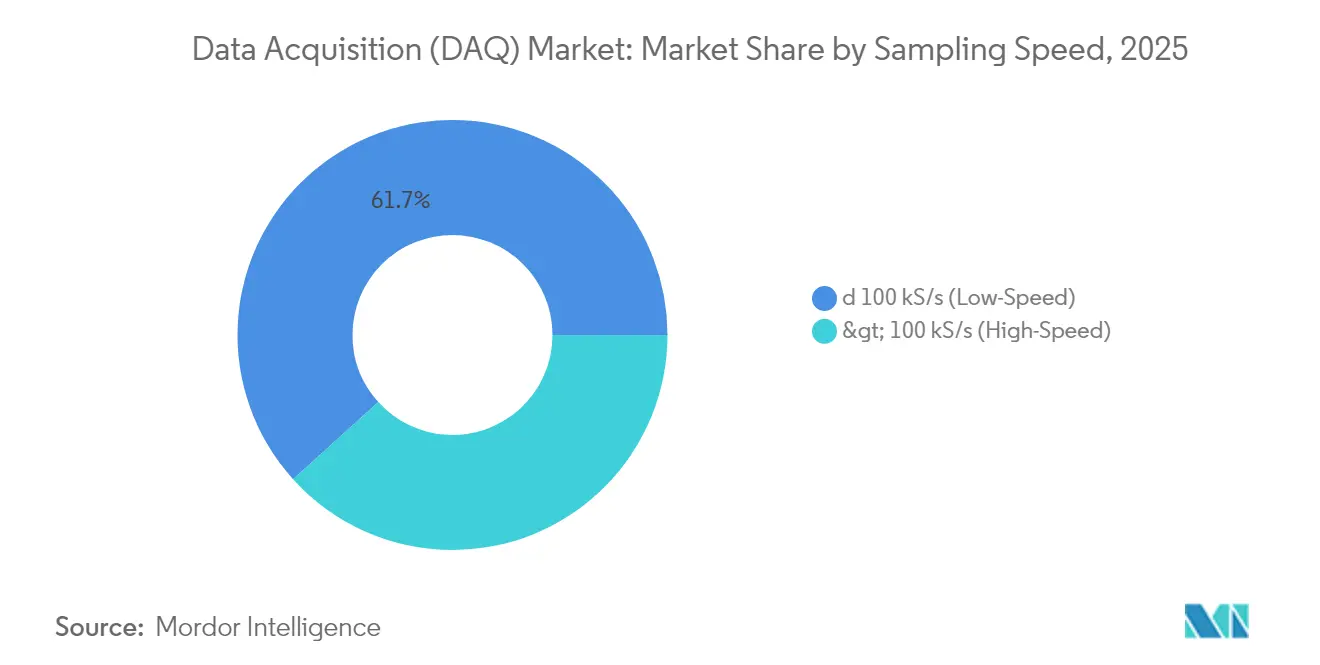
- By sampling speed, low-speed units (≤100 kS/s) accounted for 61.70% of the Data Acquisition market size in 2025, whereas high-speed systems are advancing at a 9.87% CAGR.
- By interface, USB dominated with 39.60% share in 2025, while wireless nodes are set to grow 10.96% per year to 2031.
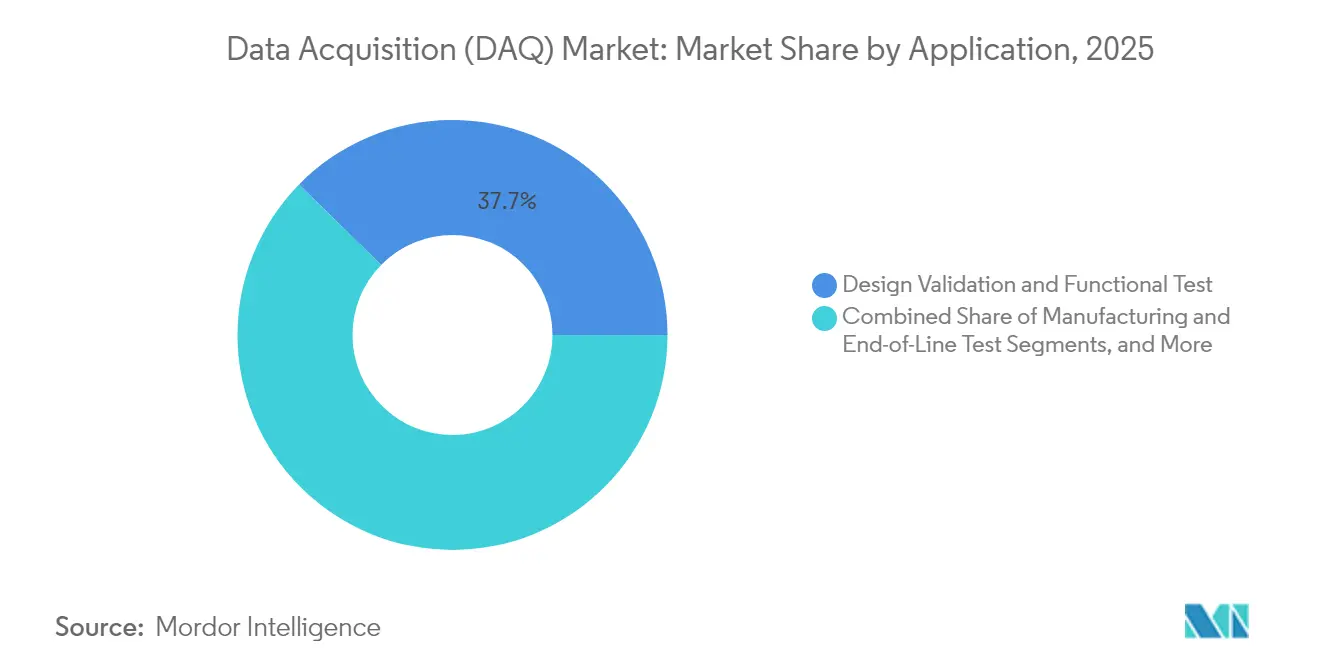
- By application, Design-Validation and Functional Test took 37.65% share of the Data Acquisition market in 2025; Asset Condition Monitoring posts the highest expected CAGR at 11.64% through 2031.
- By end-user industry, automotive and e-mobility led with a 18.85% slice in 2025, whereas aerospace and defense is projected to register a 10.18% CAGR to 2031.
Note: Market size and forecast figures in this report are generated using Mordor Intelligence’s proprietary estimation framework, updated with the latest available data and insights as of 2026.
Global Data Acquisition (DAQ) Market Trends and Insights
Drivers Impact Analysis*
| Driver | (~) % Impact on CAGR Forecast | Geographic Relevance | Impact Timeline |
|---|---|---|---|
| Growing Adoption of Time-Sensitive Networking (TSN) in DAQ Architectures | +1.5% | Global, early uptake in North America and Europe | Medium term (2-4 years) |
| Edge-Deployed DAQ Accelerating Predictive Maintenance in Asia-Pacific Manufacturing | +1.2% | Asia-Pacific core; global spill-over | Short term (≤ 2 years) |
| Rapid Integration of DAQ with Digital Twins in Automotive Test Benches | +1.1% | North America, Europe, and advanced Asian auto clusters | Medium term (2-4 years) |
| Demand for High-Channel-Count DAQ in Battery Gigafactories | +0.9% | China, Europe, North America | Short term (≤ 2 years) |
| Adoption of Rugged Modular DAQ for Space Launch Facilities | +0.8% | North America, Europe, and emerging space economies | Long term (≥ 4 years) |
| Proliferation of Low-Cost USB DAQ in Vocational STEM Programs | +0.7% | Global; focus on developing economies | Medium term (2-4 years) |
| Source: Mordor Intelligence | |||
Time-Sensitive Networking unlocks deterministic Ethernet
TSN deployments reduced synchronization errors to sub-microsecond levels and eliminated costly dedicated timing hardware, cutting total system expense by 15-20% for missile, satellite, and high-speed machinery tests. Early adopters in aerospace reported measurement-accuracy gains of 40%, allowing engineers to consolidate previously separate analog, digital, and timing buses inside one hardened network. OEMs that embedded TSN switches directly into sensor nodes delivered turnkey, tightly synchronized racks ready for plug-and-play lab expansion.
Edge-enabled DAQ transformed predictive maintenance
Machine-learning routines pushed to the measurement edge shortened anomaly-detection latency from seconds to milliseconds, stopping semiconductor photolithography faults that historically cost up to USD 100,000 per downtime hour. South Korean fabs documented 38% drops in unexpected stoppages after installing vibration, acoustic, and thermal sensors wired into embedded processors that executed local FFT and envelope-detection routines, forwarding only flagged events to the cloud. The model slashed bandwidth costs and safeguarded proprietary process data behind on-premise firewalls.
Digital-twin integration reshaped automotive validation
Linking high-fidelity DAQ streams to physics-based twins let automakers cut physical prototypes by 30-40% and shrink powertrain-validation cycles from 18 months to 12 months. Battery-management algorithms ran thousands of synthetic drive scenarios without hardware-in-loop limitations, while synchronized sensor data sustained twin accuracy across voltage, current, and thermal dimensions. Suppliers rushed to offer plug-ins that marshal gigabytes per minute of raw measurement data into co-simulation environments such as MATLAB or Siemens Simcenter.[2]MathWorks, “Data Acquisition Toolbox,” mathworks.com
Gigafactory channel explosion drove high-density architectures
Battery plants demanded >10,000 synchronous channels with 0.1% cell-to-cell accuracy during formation and aging. Vendors answered with modular 16-slot frames and distributed ADC nodes that trimmed cable runs, mitigated electromagnetic interference, and wrote terabyte-scale data sets to NVMe arrays in real time. The design protected production yield by flagging micro-ohm resistance drifts invisible to legacy 100-channel rigs, underpinning safe rollout of high-nickel chemistries for long-range EVs.
Restraints Impact Analysis*
| Restraint | (~) % Impact on CAGR Forecast | Geographic Relevance | Impact Timeline |
|---|---|---|---|
| Capital-Intensive Migration from Legacy PCI to PXIe Platforms | -0.9% | Global, highest in budget-constrained regions | Medium term (2-4 years) |
| Limited Interoperability Standards Among Vendor-Proprietary DAQ Protocols | -0.8% | Global, multi-vendor sites are most affected | Medium term (2-4 years) |
| Data-Governance Compliance Costs in Multi-Country Aerospace Testing | -0.7% | North America and Europe | Long term (≥ 4 years) |
| Shortage of DAQ-Savvy Test Engineers in High-Growth EV Clusters | -0.6% | Emerging EV hubs | Short term (≤ 2 years) |
| Source: Mordor Intelligence | |||
Upgrading to PXIe stretched capital budgets
Replacing aging PCI racks with PXIe chassis often topped USD 250,000 per facility once software rewrites, fixture retrofits, and staff retraining were tallied. Many universities and SME labs ran parallel systems for six months to safeguard certification schedules, effectively doubling maintenance overhead during switchover windows. Consequently, some institutions deferred upgrades, risking obsolescence and limited driver support for newer operating systems.
Vendor-locked protocols hampered multi-site integration
Proprietary control stacks inflated integration spend by 25-40% when automakers and aerospace primes combined vibration shakers from one brand with high-speed digitizers from another. Teams resorted to custom middleware or CSV export workflows that undermined real-time feedback loops. While the OpenDAQ initiative sought to standardize discovery and metadata, only 20% of devices shipped in 2025 supported a vendor-neutral baseline, prolonging data-silo headaches.
*Our forecasts treat driver/restraint impacts as directional, not additive. The impact forecasts reflect baseline growth, mix effects, and variable interactions.
Segment Analysis
By Channel Count: High-density architectures underpin complex tests
The 32-128 channel class captured 46.85% of the Data Acquisition market share in 2025. Laboratories favored this sweet spot because it balanced scalability with manageable cabling, suiting multi-axis vibration, durability, and EMI evaluations. Gigafactory rollouts, however, catapulted racks exceeding 128 channels to an 8.52% CAGR. Battery cell formation lines stitched hundreds of 32-channel cards into fiber-linked islands to monitor voltage and temperature across 10,000 nodes, ensuring thermal run-away detection at 0.1% tolerance.
Demand for distributed architectures re-shaped equipment design. Vendors adopted “node-per-rack” wiring schemes, embedding ADCs close to sensors to cut signal-integrity losses. Smaller (<32 channel) boxes still thrived inside educational labs and portable field kits, yet their overall slice fell as product validation expanded breadth and depth. Over the forecast, suppliers bundling auto-discovery firmware and hot-swap backplanes are best positioned to ride the surge in channel density within the Data Acquisition market.


By Offering: Software intelligence elevates hardware utility
Hardware accounted for 69.80% of the Data Acquisition market in 2025, yet software revenues climbed at a healthy 9.22% pace as users licensed analytics stacks that injected machine-learning algorithms straight into FPGA resources. Incorporating drag-and-drop DSP libraries lets engineers filter, resample, and trend data on the card, trimming host-CPU cycles by 70%.
Service lines also swelled. Aerospace primes outsourced system-integration projects covering sensor selection, rack layout, and API customization to vendors’ professional-services arms. The shift nudged legacy hardware-only firms to pivot toward subscription-oriented software modules delivering continuous deployment updates. Over time, value migrated from board-level features to configurable IP cores, cementing software as the pivot point for differentiation within the Data Acquisition market.
By Sampling Speed: Transient capture drives high-speed uptake
Low-speed configurations (≤100 kS/s) commanded 61.70% of the Data Acquisition market size in 2025, fulfilling environmental and process-control niches. High-speed (>100 kS/s) rigs, however, advanced at 9.87% CAGR, responding to power-semiconductor double-pulse testing, ultrasonic flaw detection, and millisecond-scale shock events.
Pricing erosion accelerated adoption. One-million-sample-per-second digitizers that cost USD 20,000 in 2020 retailed near USD 5,000 in 2025, unlocking university and mid-tier industrial budgets. Wind-turbine OEMs exploited this capability to track blade resonance signatures, predicting fatigue before crack onset and extending turbine life by 20%. Given the growing demand for 800 V EV inverters and GaN devices, high-speed shipments will keep outpacing the overall Data Acquisition market.
By Interface: Wireless nodes rewrite deployment economics
USB still led with 39.60% share in 2025, thanks to plug-and-go simplicity, yet wireless endpoints grew 10.96% annually, erasing many physical-site constraints. Bridge-health authorities fastened battery-powered nodes under deck plates that streamed load spectra for months without maintenance, circumventing costly lane closures.
Power-optimized radios and remote firmware upgrades pumped life cycles beyond five years, satisfying offshore-wind developers who cannot service nacelles daily. Meanwhile, PCIe-based PXI chassis preserved their niche in radar, 5G, and RF vector-signal-analysis benches where gigabit-per-second throughput remained non-negotiable. As sensor networks sprawl, hybrid mesh topologies mixing Wi-Fi, sub-GHz, and time-slot-based protocols will dominate the Data Acquisition market.
By Application: Predictive maintenance reshapes spending
Design-validation and functional testing retained a 37.65% share in 2025 because every new drivetrain, actuator, or PCB underwent exhaustive lab cycles before launch. Asset-condition monitoring, however, is poised for a 11.64% CAGR as factories chase 50% unplanned-downtime cuts. Rolling-element-bearing libraries trained on historical vibration signatures powered AI agents that auto-escalated when envelope energies crossed learned thresholds, cutting maintenance costs by 10-40%.
End-of-line testers in semiconductor fabs instrumented 100% of chips rather than statistical samples, slashing field failures by 90%. Field and lab research and development use cases also evolved; researchers piped high-resolution DAQ streams into cloud GPUs for real-time Monte Carlo runs, accelerating material-science discoveries. As analytics sophistication rises, application budgets will tilt decisively toward condition-based and autonomous feedback loops inside the Data Acquisition market.
By End-User Industry: Electrification redefines test complexity
Automotive and e-mobility applications held 18.85% of the Data Acquisition market spend in 2025 as OEMs validated high-voltage battery packs, traction inverters, and ADAS sensor suites under wide thermal swings. Aerospace and defense is projected to climb 10.18% CAGR on the back of reusable launch vehicles and hypersonic programs requiring ruggedized, radiation-tolerant digitizers.
Renewable power operators fitted offshore turbines with multi-year, autonomous DAQ clusters that logged structural strain and power-quality data to prove bankability. Semiconductor lines demanded femto-amp leakage measurements on 2 nm gate stacks, stretching noise-floor specifications. These diverging requirements foster a buffet of tailored solutions—rugged boxes for space, low-noise racks for nanoelectronics—keeping the Data Acquisition market fragmented yet innovation-rich.
Geography Analysis
North America commanded 32.90% of 2025 revenue because its aerospace giants, defense primes, and big-three automakers drove early adoption of TSN and high-density PXI systems. NASA’s Space Launch System telemetry station processed over 200,000 Ethernet channels in real time, showcasing local research and development prowess. Large federal budgets enabled rapid refresh cycles, cementing regional leadership.
Asia-Pacific clocked the fastest 9.36% CAGR to 2031. China’s battery-gigafactory build-out and South Korea’s semiconductor expansions consumed thousands of channel cards per site, while India’s growing rocket-launch ambitions required rugged DAQ crates that withstand vibration spectra above 14 g rms. Governments funneled incentives into smart manufacturing, spurring demand for edge-enabled wireless nodes and pushing local vendors into the global Data Acquisition market.
Europe maintained a robust footprint anchored by German automotive research and development and ESA space projects. Digital-twin benches inside Stuttgart labs fused synchronized DAQ streams with virtual engines, trimming prototype cycles. The ExoMars rover called for electronics that survived -80 °C to +70 °C temperature swings, pushing European suppliers toward radiation-hardened designs. Renewable-energy mandates in the North Sea further accelerated orders for corrosion-proof, long-haul DAQ cabling and wireless bridges.

Competitive Landscape
The top five vendors held a significant share, indicating moderate concentration in the Data Acquisition market. National Instruments led with an end-to-end PXI and LabVIEW ecosystem, reinforcing customer lock-in through unified drivers and TSN support. Keysight sharpened its battery-test play via a 2025 acquisition that added proprietary cell-aging algorithms, positioning the firm squarely in the EV sweet spot.
Mid-tier specialists such as Dewesoft increased their slice by differentiating on rugged IP67-rated modules and DualCoreADC technology offering 160 dB dynamic range. Yokogawa leveraged its process-industry heritage to capture oil-and-gas and LNG liquefaction users that demanded 24/7 uptime. Asian challengers released cost-optimized USB and Ethernet racks that appealed to budget-sensitive educational and light-industrial buyers, forcing incumbents to emphasize software coherence and global service coverage.
Strategic alliances multiplied. NI, Siemens, and cloud hyperscalers co-developed edge-to-cloud pipelines that auto-ingest streaming data into dashboarding portals, lowering integration friction for OT-IT convergence. Patent filings around wireless DAQ climbed 28% year-on-year, signalling race conditions in sub-GHz mesh networking and energy-harvesting sensor nodes. Vendors that harmonize open APIs with secure, upgradeable firmware stand to widen moats in the evolving Data Acquisition market.
Data Acquisition (DAQ) Industry Leaders
-
Advantech Co. Ltd.
-
Keysight Technologies
-
Schneider Electric SE
-
Honeywell International
-
Siemens AG
- *Disclaimer: Major Players sorted in no particular order

Recent Industry Developments
- March 2025: National Instruments launched a TSN-enabled platform delivering sub-microsecond node synchronization without external timing cards.
- February 2025: Keysight closed its purchase of a high-channel-count battery-test specialist, adding proprietary formation algorithms for EV cells.
- January 2025: Dewesoft unveiled IP67 KRYPTON XHS modules rated -40 °C to +85 °C for extreme aerospace missions.
- December 2024: Siemens partnered with an industrial-AI supplier to embed anomaly detection inside its DAQ firmware.


Research Methodology Framework and Report Scope
Market Definitions and Key Coverage
According to Mordor Intelligence, the data acquisition (DAQ) market covers hardware and companion software that convert real-world physical signals, such as temperature, pressure, vibration, and voltage, into digital values for storage, visualization, and analysis within a computer or edge device. The study includes modular and stand-alone DAQ chassis, plug-in boards, USB/LXI/PXIe units, and bundled software sold to industrial, research, and service organizations across manufacturing, energy, aerospace, automotive, life sciences, and education.
Scope exclusion: pure data-logging services and generic SCADA software not sold with DAQ hardware are outside our numbers.
Segmentation Overview
-
By Channel Count
- < 32
- 32 – 128
- > 128
-
By Offering
- Hardware
- Software
- Services
-
By Sampling Speed
- ≤ 100 kS/s (Low-Speed)
- > 100 kS/s (High-Speed)
-
By Interface
- USB
- Ethernet / LAN
- PCI / PXI / PXIe
- Wireless
-
By Application
- Design Validation and Functional Test
- Manufacturing and End-of-Line Test
- Asset Condition Monitoring
- Field and Lab RandD
- Environmental and Structural Monitoring
-
By End-User Industry
- Automotive and E-Mobility
- Aerospace and Defense
- Energy and Power (Including Renewables)
- Water and Waste Treatment
- Semiconductor and Electronics
- Education and Research Institutes
- Chemicals, Paper and Pulp
- Other End-User Industries
-
By Geography
-
North America
- United States
- Canada
- Mexico
-
South America
- Brazil
- Argentina
- Rest of South America
-
Europe
- Germany
- United Kingdom
- France
- Rest of Europe
-
Asia-Pacific
- China
- Japan
- South Korea
- India
- Rest of Asia-Pacific
-
Middle East and Africa
-
Middle East
- Saudi Arabia
- United Arab Emirates
- Turkey
- Rest of Middle East
-
Africa
- South Africa
- Nigeria
- Rest of Africa
-
Middle East
-
North America
Detailed Research Methodology and Data Validation
Primary Research
Interviews with instrumentation engineers, test-lab managers, automation integrators, and regional distributors across North America, Germany, India, China, and Japan validate usage intensity, channel margins, and emerging needs such as wireless synchronization. Structured surveys clarify adoption rates of PXIe over PCIe and typical ASP brackets for 16-bit versus 24-bit cards, closing gaps found in secondary data.
Desk Research
Our analysts begin by mapping the supply base and demand pools using freely accessible tier-1 sources, such as United States Census Bureau machinery shipment tables, Eurostat PRODCOM codes, Japan's JEITA electronics statistics, and trade flow databases like UN Comtrade that reveal unit shipments and average export prices of DAQ modules. Annual reports, 10-Ks, and investor decks from listed DAQ makers give price points and regional mix, while technology road maps are cross-checked through IEEE Xplore papers and patent counts (Questel). Select insights from D&B Hoovers and Dow Jones Factiva extend company-level revenues and news. This list is illustrative; many additional open sources inform the desk research foundation.
Market-Sizing & Forecasting
A top-down model scales hardware revenue from production and trade statistics, which are then reconciled with selective bottom-up roll-ups of leading vendor sales disclosed in filings and channel checks. Key variables, such as average selling price drift, channel count mix, migration speed to high-speed devices, and penetration of DAQ in EV battery test benches, drive the baseline value. Forecasts for the future use multivariate regression on industrial production indices, R&D capital expenditure, and installed base replacement cycles, with scenario cushions applied where primary experts disagree. Data voids on niche geographies are bridged through regional growth proxies and normalized against historical replacement intervals.
Data Validation & Update Cycle
Outputs pass three-layer checks: statistical outlier screening, peer analyst review, and a senior sign-off. Models refresh annually, with interim updates triggered by material events, such as large M&A, regulatory shifts, and macro shocks. A final pre-publication sweep ensures clients receive the freshest view.
Why Mordor's Data Acquisition Baseline Delivers Trusted Clarity
Published estimates often diverge because each firm picks its own product boundaries, pricing assumptions, and refresh rhythm.
Key gap drivers include: some studies omit bundled software revenues; others apply constant ASPs that ignore the premium for high-speed PXIe cards; still others freeze exchange rates for the entire forecast horizon. Mordor's scope captures hardware plus tightly coupled software, applies weighted ASPs that reflect migration to modular systems, and converts currencies at the prevailing twelve-month average, thereby anchoring a balanced midpoint.
Benchmark comparison
| Market Size | Anonymized source | Primary gap driver |
|---|---|---|
| USD 3.33 B (2025) | Mordor Intelligence | - |
| USD 2.80 B (2025) | Global Consultancy A | Excludes bundled software and channels under 16 bits resolution |
| USD 1.92 B (2024) | Research Publisher B | Uses constant 2019 ASPs and omits portable USB units |
In short, Mordor's disciplined source mix, dual-track modelling, and timely refresh give decision-makers a dependable baseline that mirrors real market momentum.


Key Questions Answered in the Report
What is the projected size of the global data acquisition (DAQ) market by 2031?
The market is forecast to reach USD 4.76 billion by 2031, advancing at a 6.12% CAGR.
Which data acquisition segment is expanding the fastest?
High-speed systems operating above 100 kS/s are growing at a 9.87% CAGR because power-electronics, ultrasonic, and vibration tests demand microsecond-level resolution.
Why is Asia-Pacific the fastest-growing region?
Rapid industrialization, battery gigafactory build-outs, and semiconductor investments are driving a 9.36% CAGR across China, Japan, South Korea, and India.
How are wireless interfaces changing field deployments?
Battery-powered wireless nodes eliminate cabling, allow multi-month unattended operation, and are posting an 10.96% annual growth rate.
What impact does Time-Sensitive Networking have on DAQ systems?
TSN cuts synchronization errors to sub-microsecond levels and removes dedicated timing cards, reducing total system cost by up to 20%.
Which end-user industry currently spends the most on DAQ solutions?
Automotive and e-mobility applications lead with a 18.85% share as EV powertrain and battery tests intensify.
Page last updated on:


