Commercial Background Music Market Size and Share
Market Overview
| Study Period | 2020 - 2031 |
|---|---|
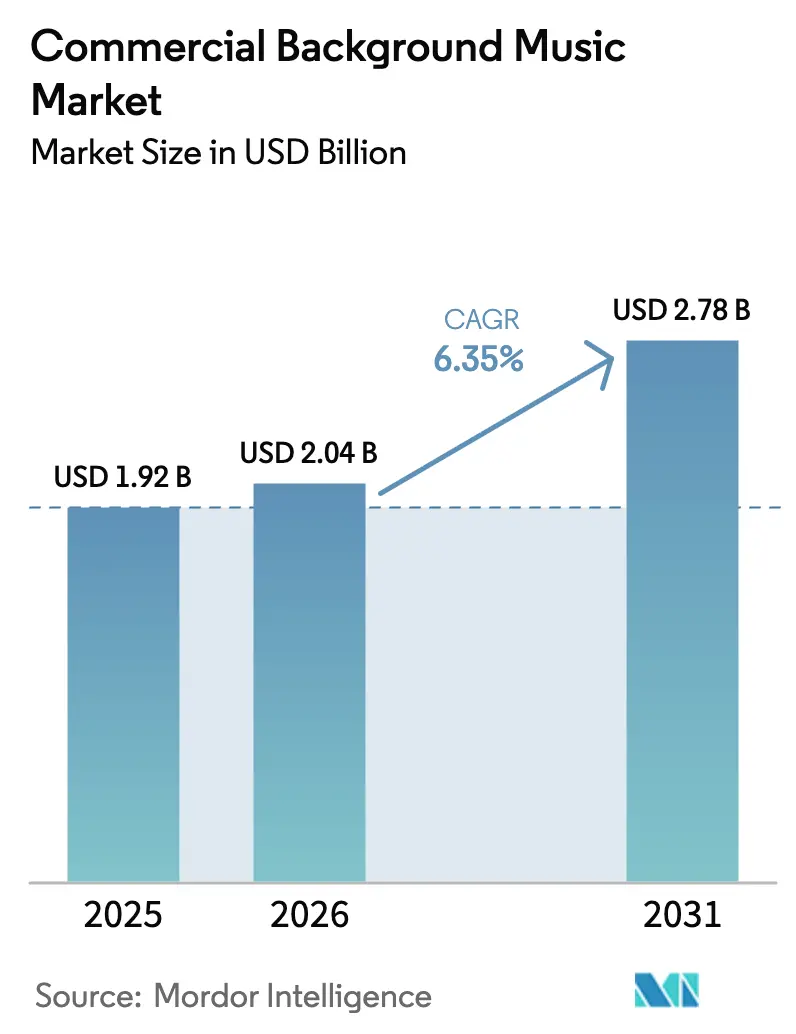
| Market Size (2026) | USD 2.04 Billion |
| Market Size (2031) | USD 2.78 Billion |
| Growth Rate (2026 - 2031) | 6.35% CAGR |
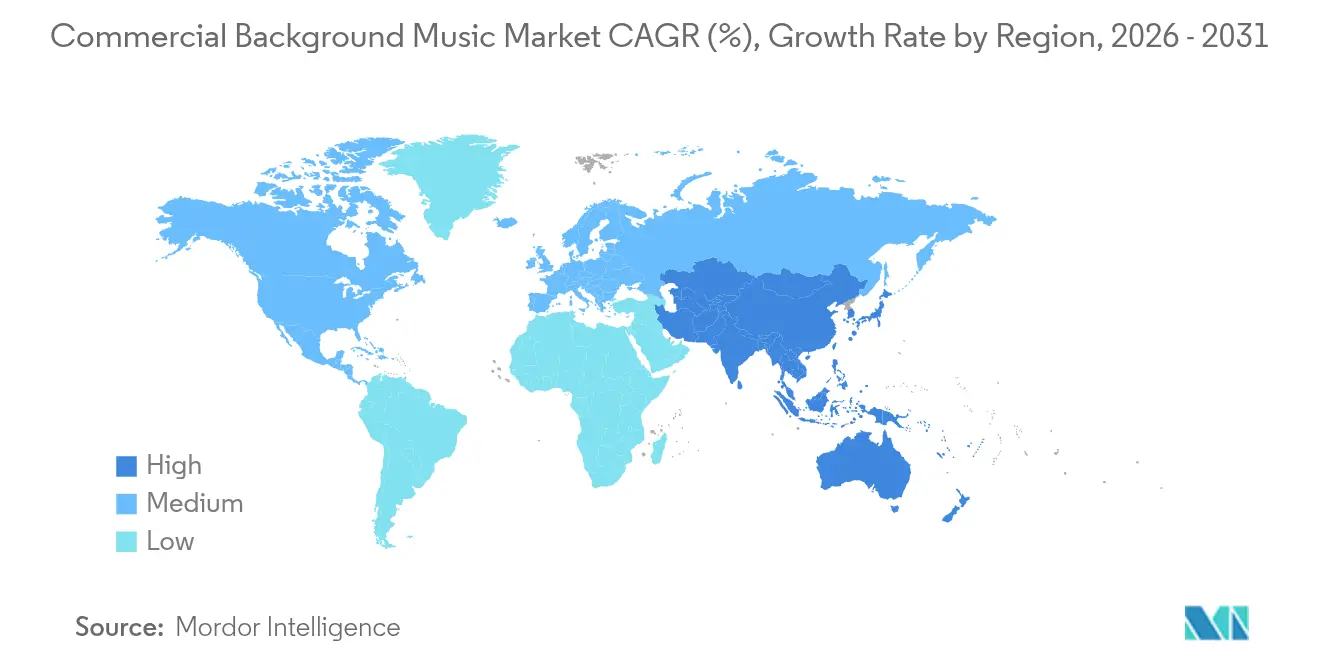
| Fastest Growing Market | Asia Pacific |
| Largest Market | North America |
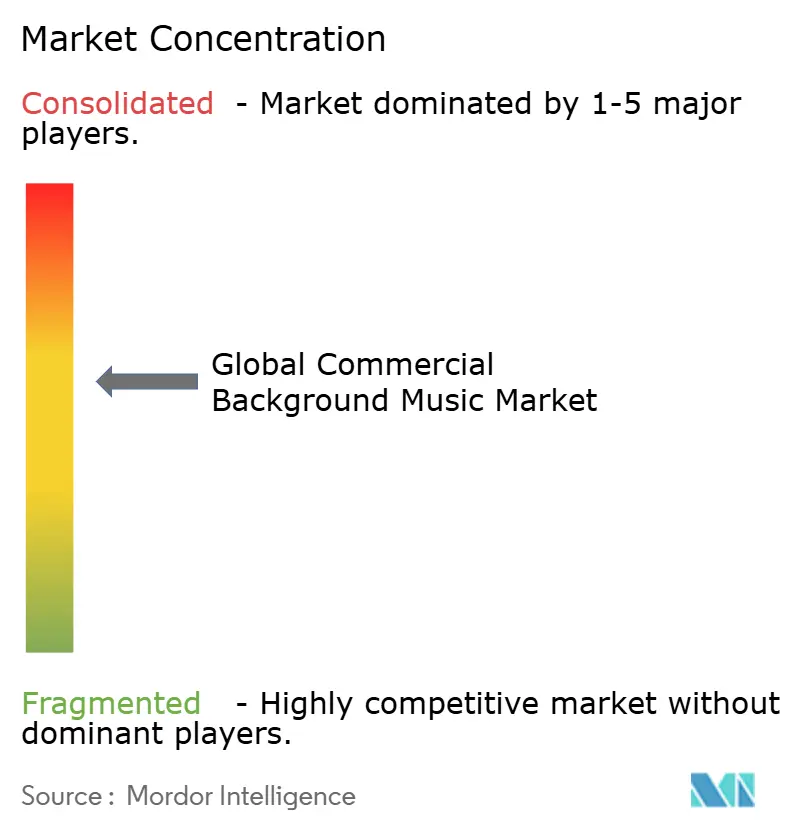
| Market Concentration | Medium |
Major Players *Disclaimer: Major Players sorted in no particular order Image © Mordor Intelligence. Reuse requires attribution under CC BY 4.0. | |
Commercial Background Music Market Analysis by Mordor Intelligence
The Global Commercial Background Music Market size is expected to grow from USD 1.92 billion in 2025 to USD 2.04 billion in 2026 and is forecast to reach USD 2.78 billion by 2031 at 6.35% CAGR over 2026-2031.
The upward trajectory reflects mounting evidence that curated audio environments can lift average customer spending, with recent field experiments showing sales uplifts of as much as 8% when playlists are aligned with brand identity[1]Retail Times, “Background music lifts spending by up to 8%,” retailtimes.co.uk. Growth is further underpinned by rising adoption among healthcare facilities, hotels, and connected fitness studios that now regard music as part of the core service experience rather than a discretionary add-on. Cloud-based delivery, which already powers most consumer streaming, is now the dominant enterprise deployment model, giving multi-site operators a single dashboard for rights-cleared content, scheduling, and analytics. Regionally, North America still commands the largest slice of the commercial background music market, yet Asia Pacific’s faster retail modernization suggests a significant narrowing of the gap by the end of the decade. Competitive dynamics remain fluid as established sensory-branding specialists battle agile platforms using AI to personalize soundtracks in real time.
Key Report Takeaways
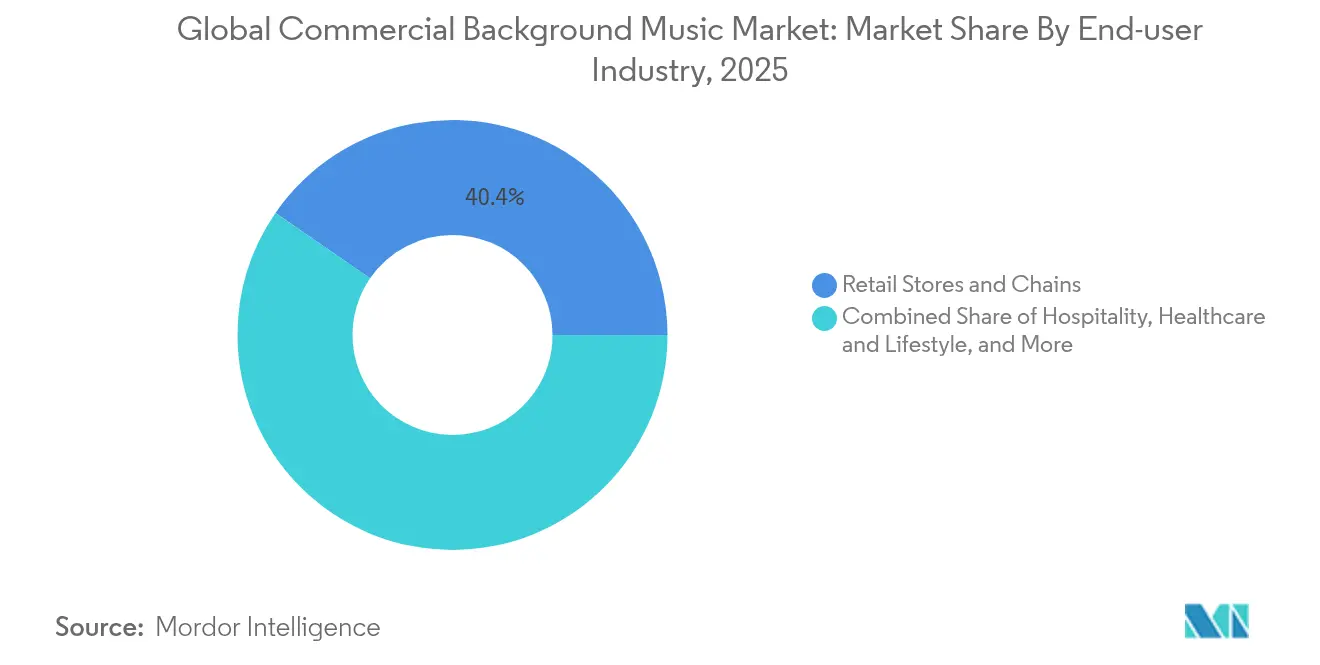
- By end-user industry, retail chains held 40.40% of the commercial background music market share in 2025, while healthcare and lifestyle venues are expanding at a 7.25% CAGR through 2031.
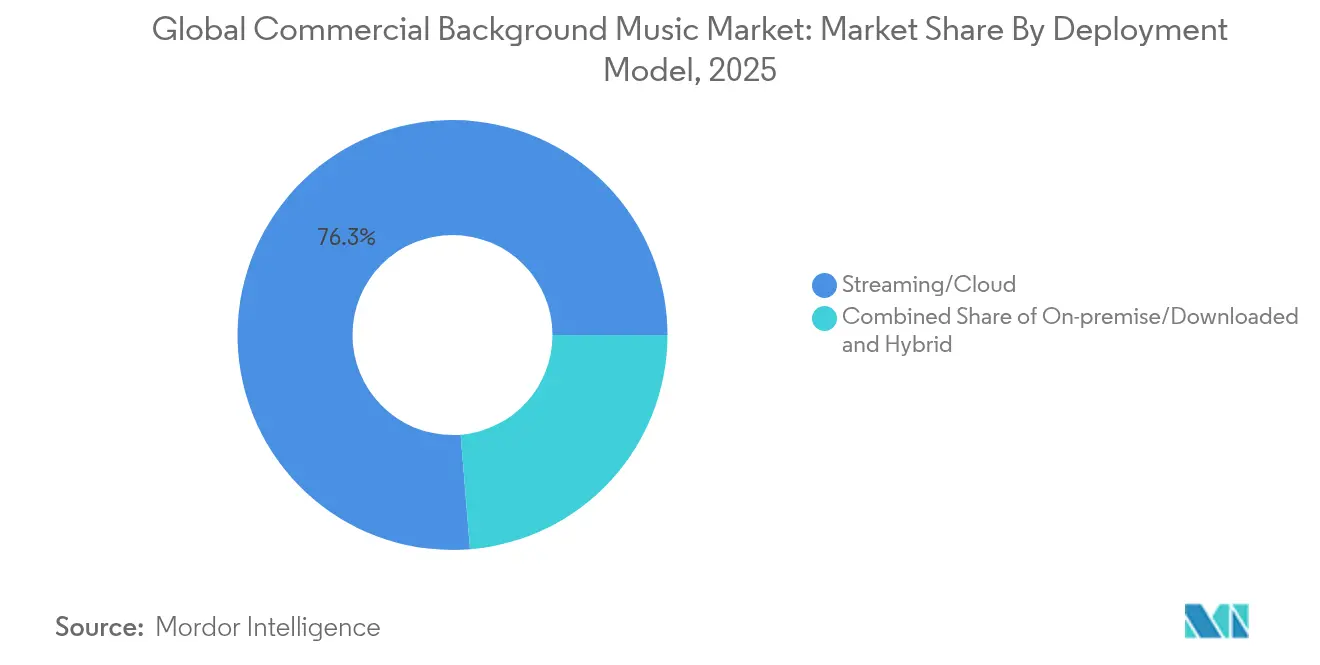
- By deployment model, cloud-based streaming captured 76.30% of the commercial background music market size in 2025 and is projected to grow at an 7.88% CAGR.
- By content type, instrumental tracks accounted for 57.30% of the commercial background music market size in 2025; custom-branded playlists are the fastest riser at a 6.75% CAGR to 2031.
- By geography, North America led with 38.10% of the commercial background music market share in 2025, whereas Asia Pacific is pacing ahead at an 7.95% CAGR through 2031.
Note: Market size and forecast figures in this report are generated using Mordor Intelligence’s proprietary estimation framework, updated with the latest available data and insights as of 2026.
Global Commercial Background Music Market Trends and Insights
Drivers Impact Analysis*
| Driver | (~) % Impact on CAGR Forecast | Geographic Relevance | Impact Timeline |
|---|---|---|---|
| Retail chain-led demand surge | 1.20% | Global, concentration in North America & APAC | Medium term (2-4 years) |
| Cloud-based streaming cost advantages | 1.50% | Global | Short term (≤ 2 years) |
| AI-driven dynamic playlist curation | 1.10% | North America & Europe first, expanding to APAC | Medium term (2-4 years) |
| Compliance-friendly global licensing models | 0.80% | Multi-jurisdictional markets | Long term (≥ 4 years) |
| Source: Mordor Intelligence | |||
Retail Chain-Led Demand Surge
Retailers are embedding music into the merchandising toolkit after data showed that well-tuned playlists can push basket sizes higher and extend dwell time. Grocery chains using hour-of-day rotation report sales lifts of up to 10%, while specialty formats such as sports apparel achieve double-digit growth from energetic tracks that reinforce brand positioning[2]Progressive Grocer, “Playlists boost grocery sales,” progressivegrocer.com. Programmatic scheduling, now common in digital signage, is migrating to audio, allowing stores to sync music tempo with promotional cadence. Sophisticated A/B testing lets managers quantify uplift, turning what was once ambience into a measurable revenue lever. The payoff is most apparent in competitive urban retail corridors where micro-differences in customer experience translate directly into share gains. As a result, retailers are assigning budget line items to sonic branding alongside lighting, scent, and visual merchandising.
Cloud-Based Streaming Cost Advantages
Streaming over the cloud removes the friction of physical media, reduces upfront hardware expense, and centralizes playlist governance for franchise operators. Spotify’s USD 447 million multi-year commitment to Google Cloud illustrates the infrastructure scale behind low-latency delivery and rights management. Enterprise customers gain real-time analytics, automated content updates, and remote troubleshooting that would be unviable on legacy boxes. Pay-as-you-go tiers have opened the door for thousands of small cafés and salons that previously relied on consumer accounts, broadening the commercial background music market and accelerating churn away from downloadable catalogs. Hybrid setups, where a slim on-premises cache prevents silence during network outages, appeal to venues with inconsistent connectivity yet still funnel data back to cloud dashboards for centralized reporting.
AI-Driven Dynamic Playlist Curation
Machine-learning engines pull from contextual data weather, occupancy, and basket value, to refresh tracks every few minutes without human intervention. RetailNext and Brandtrack embed vision analytics to modulate tempo and genre when teenage footfall rises or checkout queues lengthen, translating shopper mood into real-time soundtrack shifts. Major labels are striking licensing pacts with AI music generators Suno and Udio that both compensate creators and supply endless adaptive stems. Early deployments show upticks in conversion when playlists pivot instantly rather than wait for manual overrides. Over the forecast horizon, AI is expected to reduce playlist curatorial labor costs and to unearth micro-genres tuned to hyper-specific demographics, deepening the value proposition for subscribing venues.
Compliance-Friendly Global Licensing Models
Multi-territory chains grapple with disparate copyright regimes: perpetual moral rights in Europe, performance-only levies in the United States, and stringent work registrations under Japan’s JASRAC. To ease complexity, platform vendors now bundle blanket coverage across the largest PROs, embedding automated reporting that reconciles track use with royalty outlets. This shift slashes legal overhead and de-risks borderless expansion, especially for hospitality brands that localize décor but retain a unified sonic identity. Although full harmonization of copyright law remains elusive, turnkey licensing packages cut onboarding times and remove a major barrier to entry for retailers eyeing new regions.
Restraints Impact Analysis*
| Restraint | (~) % Impact on CAGR Forecast | Geographic Relevance | Impact Timeline |
|---|---|---|---|
| Multi-jurisdictional licensing complexity | -0.80% | Global, high load on multinationals | Long term (≥ 4 years) |
| Illegal use of consumer streaming services | -1.10% | Global, more acute in emerging markets | Short term (≤ 2 years) |
| Source: Mordor Intelligence | |||
Multi-Jurisdictional Licensing Complexity
Compliance teams must juggle diverse statutes, from the Berne Convention’s moral rights in Europe to compulsory licensing carve-outs in North America. Failure to secure the correct blanket permissions can trigger fines, as illustrated when JASRAC warned 212 premises in 2016 for infringing broadcasts. Legal uncertainty inflates costs and occasionally forces chains to mute audio when entering new jurisdictions, undermining brand consistency. While large providers offer all-in-one packages, local nuances such as tariff banding by venue size still require bespoke counsel. Unless future treaties streamline cross-border performance rights, the drag on the commercial background music market may persist beyond the current forecast window.
Illegal Use of Consumer Streaming Services
Tens of thousands of cafés, yoga studios, and corner shops still rely on personal Spotify or Apple Music accounts, bypassing royalties intended for rights holders. Soundtrack Your Brand estimates that legitimate enterprise platforms generate up to 5 times more income for artists than consumer plans, while remaining competitively priced for businesses. The resulting leak siphons revenue away from professional vendors, distorts price expectations, and complicates enforcement. In response, industry associations are rolling out educational toolkits and spot-check audits, yet adoption remains uneven, especially in price-sensitive emerging economies. Ongoing litigation, such as Sony Music’s 2025 claim against LiveOne for USD 2.6 million in unpaid fees, underscores the scrutiny facing non-compliant operators and highlights reputational risks for brands caught sidestepping the rules.
*Our forecasts treat driver/restraint impacts as directional, not additive. The impact forecasts reflect baseline growth, mix effects, and variable interactions.
Segment Analysis
By End-User Industry: Healthcare Drives Wellness-Focused Growth
Healthcare and lifestyle facilities, ranging from rehabilitation clinics to boutique fitness chains, are expanding their music programs at a 7.25% CAGR through 2031 as evidence mounts linking sonic environments to measurable health outcomes. Music therapy is now practiced in 42,000 facilities, and clinical studies show that rhythmic interventions can cut respiratory distress and lower pre-operative anxiety more effectively than pharmaceuticals. The commercial background music market size for healthcare is small today but is projected to widen as hospitals add relaxation suites and telemedicine providers embed curated playlists into patient portals. Retail chains nevertheless remain the revenue anchor, holding 40.40% of the commercial background music market share in 2025, thanks to decades of proof that soundtracking boosts dwell time, impulse purchases, and brand recall. Hospitality venues follow, incorporating genre shifts across dayparts, bright acoustic over breakfast, lounge house by evening to raise perceived value and check averages. Corporate offices are the next frontier: hybrid-work policies heighten the need for productive open-plan acoustics, and companies see curated music as a low-cost perk that enriches employee experience.
A wider set of niche environments is also tapping the commercial background music market. Transportation hubs pipe calming melodies into boarding gates to reduce traveller stress, while financial branches use classical motifs to signal trustworthiness. Co-working spaces design multi-zoned audio maps that morph from focus-oriented ambient loops to social-hour playlists once the workday ends. Across these settings, providers pitch outcome-based packages rather than one-size-fits-all subscriptions, and analytics dashboards let venue managers correlate track rotations to KPIs such as sales per square foot or session duration. The result is a feedback loop where data fuels ever-more granular segmentation, reinforcing music’s status as a strategic rather than decorative asset.


By Deployment Model: Cloud Dominance Accelerates Digital Transformation
Streaming-first architectures now account for 76.30% of the commercial background music market size, and the vector still points upward with an 7.88% CAGR. Businesses cite instant access to vast licensed libraries, zero physical maintenance, and the ability to roll out new locations in minutes as prime motivators. API-level integrations with point-of-sale data permit real-time playlist modulation, creating a virtuous circle between shopper behavior and audio mood. On-premise systems persist in sectors with spotty connectivity, think cruise ships or subterranean venues, yet even they are adopting hybrid fallbacks that sync once bandwidth returns. Vendors emphasize enterprise-grade security, reassuring clients that PCI-DSS compliance and network isolation keep transaction data firewalled from music streams.
The cloud shift dovetails with broader digital transformation agendas. Retail CIOs bundle music with digital signage, fragrance diffusers, and IoT sensors under a single remote console, simplifying vendor management. Subscription billing aligns with operating-expense budgeting models, avoiding capex spikes. As 5G and Wi-Fi 7 deepen available bandwidth, latency concerns recede, encouraging even cautious adopters to transition from downloaded assets to continuous streams. Given those tailwinds, analysts foresee the commercial background music market tilting further toward cloud ubiquity well before 2030, leaving legacy MP3 jukeboxes largely to nostalgia venues and environments requiring air-gapped systems for legal reasons.
By Content Type: Custom Branding Challenges Instrumental Dominance
Instrumental tracks remain the safe default for most venues, securing 57.30% of revenue in 2025 because they provide ambience without distracting vocals. Yet brand managers increasingly view sonic identity as a competitive differentiator, spurring demand for bespoke playlists that mirror brand archetypes across culture, heritage, and target demographics. Custom-branded collections, now the highest-growth content segment at 6.75% CAGR, use voiceovers, jingles, and genre-blending to carve unique audio logos. Agencies such as amp Sound Branding harness AI to sift 30 million pre-cleared tracks, tagging them against mood and brand attributes for rapid prototyping. Vocal playlists, once relegated to bars and youth retailers, find new relevance in loyalty marketing campaigns that integrate artist partnerships.
Licensed radio feeds hold residual appeal among budget-conscious operators needing quick setups, yet their share is projected to erode as dynamic playlist engines become commodity features. The pivot toward customization boosts demand for data scientists capable of linking track metadata with sales metrics, an emerging skillset within the commercial background music industry. Over the forecast horizon, content differentiation is likely to deepen as venues experiment with spatial and interactive audio layers, further displacing generic instrumental loops and pulling more enterprises into premium subscription tiers.
Geography Analysis
North America retained 38.10% of global revenue in 2025, cemented by mature PRO infrastructure, ASCAP, BMI, and SESAC that simplifies blanket licensing for chains operating across state lines. The United States in particular, showcases sophisticated use cases such as mood-aware AI playlists in big-box retail and 3D audio zones in theme parks. Canada mirrors these patterns, helped by high broadband penetration and a regulatory climate that encourages fair remuneration for rights holders. Mexico’s burgeoning supermarket sector is an additional bright spot, although smaller independents there still rely heavily on consumer streaming services, exposing them to compliance risk. Overall, high disposable incomes, advanced cloud adoption, and seasoned sensory-branding agencies reinforce the region’s leadership within the commercial background music market.
Asia Pacific is projected to deliver the fastest gains at an 7.95% CAGR as mega-malls proliferate and the middle class widens in China, India, and Southeast Asia. China’s recorded music revenue jumped 28.4% in 2022, vaulting the country into the global top five, while Japan’s digital sales rose 17%, underlining consumer appetite for paid audio. Yet diversity in language, culture, and copyright law means providers must localize catalogs and user interfaces. Japan’s JASRAC mandates explicit commercial licenses, whereas India’s dual society model (IPRS and PPL) introduces parallel tariffs. Rapid smartphone adoption and falling data costs are lowering barriers, though enforcement gaps still allow non-licensed consumer streams to flourish in tier-two cities. To win share, vendors are pairing subscription discounts with education campaigns that stress the business uplift of compliant audio.
Europe remains a sizeable, if slower-growing, market distinguished by nuanced moral rights and stringent GDPR rules that shape data collection from in-store sensors. Hospitality firms, particularly in Spain, Italy, and the Nordic region, have shifted toward experiential dining, making curated music central to concept differentiation. South America trails but shows momentum as Brazilian retail chains modernize point-of-sale ecosystems, creating new hooks for integrated audio platforms. The Middle East and Africa currently contribute the smallest slice of the commercial background music market; however, rising mall construction in the Gulf and rapid urbanization across parts of Africa present long-term opportunities. Across all non-North American territories, localized content, flexible price tiers, and plug-and-play compliance modules will be decisive in capturing untapped demand.

Competitive Landscape
The commercial background music market is moderately fragmented, with heritage players innovating to defend their share against digital-native entrants. Mood Media touches 165 million consumers daily across 500,000 locations, bundling scent and visual content for an immersive retail stack. Stingray Business, which posted 15.6% organic revenue growth in broadcast and recurring commercial music for Q2 2025, leverages FAST channels and in-vehicle karaoke partnerships with Ford and NIO to diversify distribution[4]Stingray Group, “Q2 2025 results show 15.6% growth,” stingray.com. Both firms differentiate through multi-sensory offerings, enterprise service desks, and global license portfolios.
Meanwhile, tech-first challengers champion algorithmic curation and transparent pricing. Brandtrack integrates with POS systems to link audio changes directly to sales metrics, a proposition resonating with data-driven specialty retailers. FastStream Interactive’s 2025 purchase of ROXi adds voice-controlled jukebox features that could resonate in hospitality and fitness classes, highlighting the convergence between consumer and commercial audio ecosystems. Consolidation continues, such as ECI’s majority stake in Imagesound Group, signaling private-equity conviction that scale and geographic reach matter in winning multinational contracts.
Licensing disputes serve as a cautionary tale. Sony Music’s lawsuit against LiveOne exposes the financial risk of under-reported plays, pushing vendors to double down on automated royalty reporting pipelines. At the same time, major rights holders like Warner and Universal are broadening their catalogs through high-value acquisitions Tempo Music Investments and Downtown Music Group, respectively, to lock in premium content and negotiate favorable enterprise rates. In aggregate, competition pivots around three levers: breadth of cleared repertoire, sophistication of AI analytics, and the ability to deliver turnkey compliance across continents.
Commercial Background Music Industry Leaders
Auracle Sound Ltd.
Mood Media
Cloud Cover Media, Inc
NSM Music
Sound Machine
- *Disclaimer: Major Players sorted in no particular order

Recent Industry Developments
- February 2025: Warner Music Group acquired a controlling stake in Tempo Music Investments from Providence Equity Partners.
- March 2025: Warner Bros. Discovery launched a USD 1 billion joint venture with Cutting Edge to co-own a film and TV music catalog.
- December 2024: Virgin Music Group agreed to buy Downtown Music Group Holdings for USD 775 million, closing in H2 2025.
- October 2024: Slipstream purchased three production music brands from Anthem Entertainment, adding 650,000 tracks to its library.


Research Methodology Framework and Report Scope
Market Definitions and Key Coverage
We define the commercial background music market as all revenue that specialist providers earn from supplying licensed audio-streaming or on-premise playlists, ancillary hardware, and playlist-curation services that play continuously in public-facing business venues such as retail chains, cafés, gyms, hotels, and clinics. Our study tracks value at end-provider billings, converted to constant-2025 USD, across every geography and delivery mode.
Scope Exclusions: The model omits consumer music subscriptions used at home, background scores for broadcast media, and one-off music synchronization deals.
Segmentation Overview
- By End-user Industry
- Retail Stores and Chains
- Hospitality (Restaurants, Cafes, Bars, Hotels)
- Healthcare and Lifestyle (Clinics, Salons, Spas, Gyms)
- Transportation Hubs
- Corporate Offices and Co-working Spaces
- Other End-user Industries
- By Deployment Model
- Streaming/Cloud-based
- On-premise/Downloaded
- Hybrid
- By Content Type
- Instrumental Background Music
- Vocal Background Music
- Custom Branded Playlists
- Licensed Radio-style Feeds
- By Geography
- North America
- United States
- Canada
- Mexico
- South America
- Brazil
- Argentina
- Rest of South America
- Europe
- Germany
- United Kingdom
- France
- Italy
- Spain
- Russia
- Rest of Europe
- Asia-Pacific
- China
- Japan
- South Korea
- India
- Australia
- Rest of Asia-Pacific
- Middle East and Africa
- Saudi Arabia
- United Arab Emirates
- South Africa
- Rest of Middle East and Africa
- North America
Detailed Research Methodology and Data Validation
Primary Research
Mordor analysts interviewed music-service executives, retail fit-out contractors, hospitality managers, and copyright-collection agencies across North America, Europe, and Asia-Pacific. These discussions validated tariff ranges, average speaker-zone densities, and typical multi-site discount structures that desktop work alone could not surface.
Desk Research
Our team first built a fact base from widely trusted sources such as national performing-rights societies, the World Trade Organization's tariff database, UN Comtrade shipment codes for audio gear, and sector bulletins issued by the Retail Industry Leaders Association. We also reviewed company 10-Ks, investor decks, and press releases to map venue roll-outs and contract wins. Proprietary databases that Mordor subscribes to, D&B Hoovers for company revenue splits and Dow Jones Factiva for deal flow, supplied harder-to-find financial breakouts. This catalog of figures established baseline venue counts, prevailing licensing tariffs, and regional adoption curves. The sources listed illustrate the universe consulted; many more publications informed granular checks throughout the build.
Market-Sizing & Forecasting
A top-down reconstruction starts with venue stock, average sound-zone counts, and prevailing per-zone subscription rates. Results are then stress-tested with selective bottom-up roll-ups of provider billings and sampled ASP × active-account volumes. Key variables include global retail floor-space additions, quick-service restaurant outlet growth, licensed venue penetration, subscription fee inflation, and cloud-streaming share of new deployments. A multivariate regression feeds these drivers into a five-year forecast, with scenario envelopes refined through expert panels. Data gaps, most often in independent café counts, are bridged using municipal business-license filings before final triangulation.
Data Validation & Update Cycle
Draft outputs pass anomaly checks against royalty-collection trends, hardware import statistics, and public earnings calls. Two layers of senior review follow, and the model refreshes annually; interim updates trigger if tariff reforms, major M&A, or currency swings exceed preset thresholds.
Why Mordor's Global Commercial Background Music Baseline Commands Reliability
Published numbers differ because studies vary in scope, tariff assumptions, and refresh cadence. We flag these drivers up front so decision-makers see exactly what shifts each estimate.
Benchmark comparison
| Market Size | Anonymized source | Primary gap driver |
|---|---|---|
| USD 1.92 B (2025) | Mordor Intelligence | - |
| USD 2.05 B (2024) | Regional Consultancy A | Treats in-store audio hardware resale as service revenue |
| USD 1.76 B (2025) | Global Consultancy B | Applies flat license fees, ignores multi-zone surcharges |
| USD 1.80 B (2025) | Industry Association C | Uses 2022 venue counts without pandemic recovery adjustments |
Taken together, the comparison shows that when scope inflation or stale venue data creep in, totals drift noticeably. By grounding our baseline in audited venue stocks, refreshed tariffs, and cross-checked provider billings, Mordor delivers a balanced, traceable starting point that clients can rely on.


Key Questions Answered in the Report
How big is the commercial background music market in 2026?
The market is valued at USD 2.04 billion in 2026 and is on track to reach USD 2.78 billion by 2031, reflecting a 6.35% CAGR.
Which end-user sector spends the most on commercial background music?
Retail chains lead, accounting for 40.40% of the commercial background music market share in 2025.
Why are cloud deployments preferred over on-premises music systems?
Cloud platforms cut hardware costs, allow instant playlist updates, and provide centralized compliance and analytics while growing at an 7.88% CAGR.
Which region shows the fastest growth?
Asia Pacific is the fastest-growing geography, projected at an 7.95% CAGR through 2031 due to retail modernization and rising disposable incomes.
How does AI influence commercial background music strategies?
AI-driven engines dynamically adjust playlists based on real-time data such as customer demographics and store traffic, boosting sales conversion and reducing manual curation costs.
What is the chief regulatory challenge for global retailers using background music?
Navigating multi-jurisdictional licensing regimes remains the top hurdle, adding legal complexity and cost for cross-border operators.
Page last updated on:


