
Coffee Machine Market Size and Share
Market Overview
| Study Period | 2020 - 2031 |
|---|---|
| Market Size (2026) | USD 20.03 Billion |
| Market Size (2031) | USD 26.77 Billion |
| Growth Rate (2026 - 2031) | 5.60% CAGR |
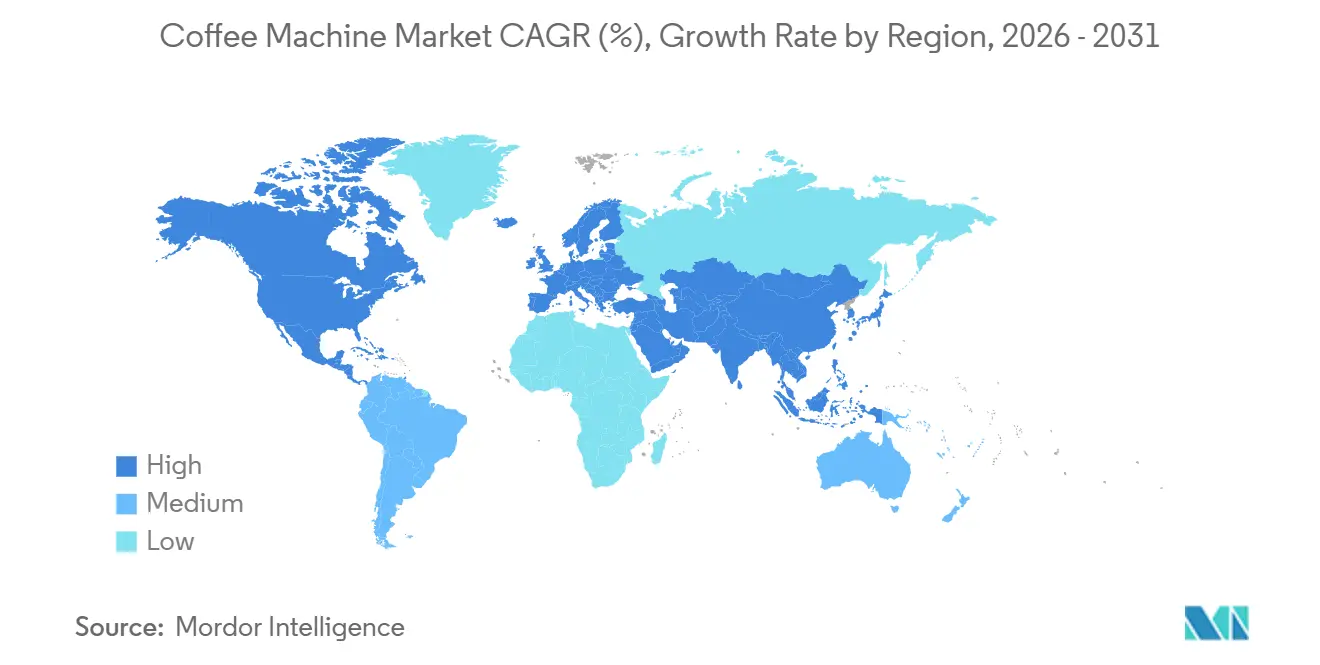
| Fastest Growing Market | Asia Pacific |
| Largest Market | Europe |
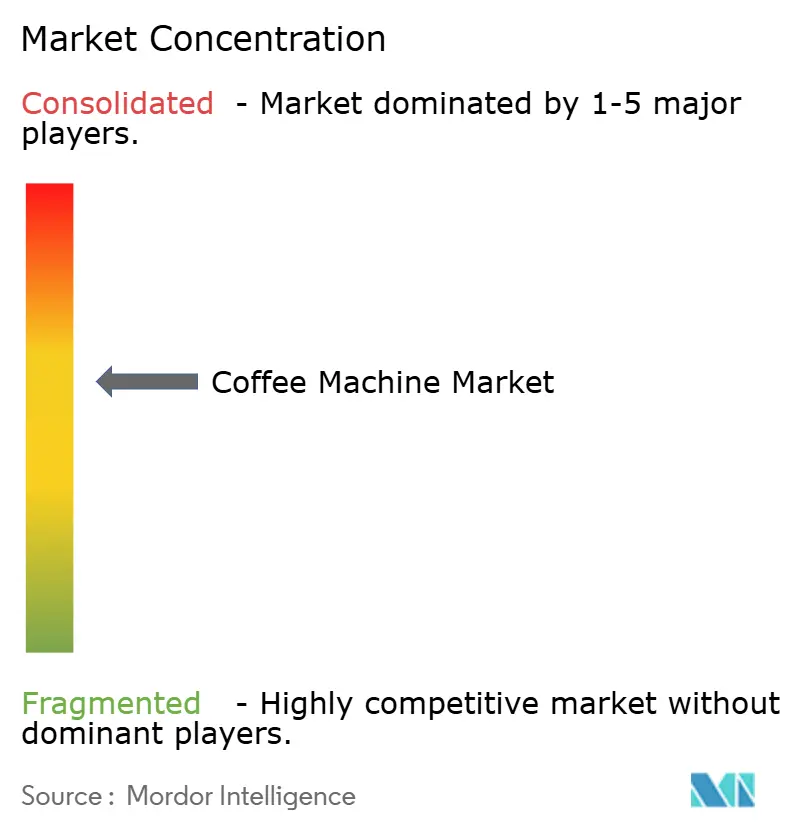
| Market Concentration | Medium |
Major Players *Disclaimer: Major Players sorted in no particular order Image © Mordor Intelligence. Reuse requires attribution under CC BY 4.0. | |
Coffee Machine Market Analysis by Mordor Intelligence
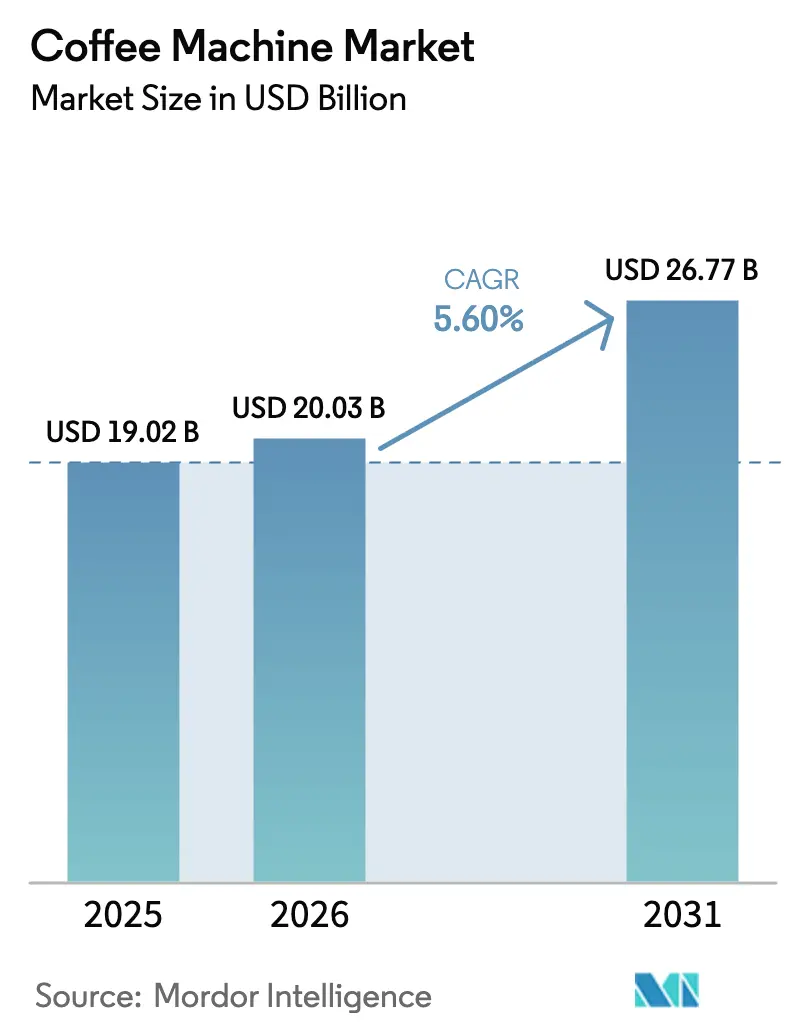
The Coffee Machine Market size was valued at USD 19.02 billion in 2025 and is estimated to grow from USD 20.03 billion in 2026 to reach USD 26.77 billion by 2031, at a CAGR of 5.60% during the forecast period (2026-2031).
Momentum reflects a tight supply backdrop and firm demand, as the International Coffee Organization’s composite indicator price remained elevated through 2025 while ending stocks tightened, reinforcing equipment upgrades in both home and foodservice channels[1]International Coffee Organization, “International Coffee Organization,” ico.org. Residential buyers continued to anchor volumes, while commercial operators invested in connected brewers and super-automatic platforms that reduce training needs and keep beverages consistent at peak times. Filter coffee machines held the largest product-type volume, yet capsule and pod systems advanced more quickly as premium single-serve formats gained acceptance. Europe sustained the largest revenue base, while Asia-Pacific delivered the fastest growth trajectory on the back of urbanization, specialty-coffee adoption, and rising incomes that support automated and bean-to-cup platforms.
Key Report Takeaways
- By product type, filter coffee machines accounted for a 31.10% share of the coffee machine market size in 2025, while capsule and pod systems are projected to expand at a 7.60% CAGR through 2031.
- By automation level, fully automatic machines / Super-Automatic led with 74.60% of the coffee machine market share in 2025, and the same category is projected to grow at a 6.50% CAGR through 2031.
- By end user, residential held 67.90% of the coffee machine market share in 2025, and residential is projected to advance at a 6.20% CAGR through 2031.
- By distribution channel, B2C channels accounted for 67.20% share of the coffee machine market size in 2025, and B2C is forecast to expand at a 6.90% CAGR through 2031.
- By geography, Europe accounted for a 38.60% share of the coffee machine market size in 2025, while Asia-Pacific is projected to record a 7.80% CAGR through 2031.
Note: Market size and forecast figures in this report are generated using Mordor Intelligence’s proprietary estimation framework, updated with the latest available data and insights as of January 2026.
Global Coffee Machine Market Trends and Insights
Drivers Impact Analysis*
| Drivers | (~) % Impact on CAGR Forecast | Geographic Relevance | Impact Timeline |
|---|---|---|---|
| Rising Per-Capita Coffee Consumption | +1.2% | Global, with strongest impact in APAC and emerging markets | Medium term (2-4 years) |
| Shift Toward Home-Brewing Lifestyles | +1.8% | North America & Europe core, expanding to urban APAC | Short term (≤ 2 years) |
| Specialty Café Footprint Expansion Driving Aspirational Demand | +0.9% | Global, with concentration in urban centers | Long term (≥ 4 years) |
| Smart, Connected Brewer Innovation Cycle | +1.4% | North America & Europe early adoption, APAC following | Medium term (2-4 years) |
| Surge in Single-Serve Convenience Formats | +1.1% | Global, strongest in developed markets | Short term (≤ 2 years) |
| Rising Penetration of Smart Homes and Connected Appliances | +0.8% | North America & Europe leading, expanding to urban APAC | Medium term (2-4 years) |
| Source: Mordor Intelligence | |||


Rising Per-Capita Coffee Consumption
Global consumption increased in 2025-2026 to 173.85 million 60-kilogram bags, supported by production of 178.85 million bags and the fifth consecutive year of tightening ending stocks, which kept supply discipline in focus. In the United States, specialty-coffee participation climbed to a 14-year high in spring 2025, reaching 46% of adults on a past-day basis and signaling a deeper demand pool for café beverages and high-performing home machines[2]National Coffee Association, “Specialty coffee consumption hits 14-year high,” ncausa.org. The same survey period showed 43% of adults consumed espresso-based beverages in the prior week, reinforcing the appeal of extraction-focused devices and integrated milk systems that deliver consistent quality. China’s consumer base accelerated as De’Longhi reported double-digit revenue growth in the first half of 2025, with the market representing around 6% of group sales, which indicates rising acceptance of bean-to-cup and fully automatic ownership among urban consumers. Younger cohorts amplified the trend, as 64% of Americans aged 25 to 39 reported drinking specialty coffee in the past week in 2025, which translated into persistent upgrades of home equipment and higher-value purchases in retail and online channels. These demand signals sustained the coffee machine market as households and workplaces prioritized consistent extraction quality, faster workflows, and better energy performance in everyday use.
Shift Toward Home-Brewing Lifestyles
Home preparation remained a central habit in 2025, reflected in brewer shipments and in household penetration of key device types. Keurig Dr Pepper shipped 10.4 million brewers in 2024, a 7.3% increase year over year, even as pods were flat, illustrating that the installed base and upgrade cycles continued to expand despite price sensitivity to consumables. In January 2025, United States household penetration reached 62% for drip coffee makers, 42% for single-cup brewers, 15% for bean-to-cup machines, and 12% for espresso machines, confirming broad adoption across convenience and premium categories. Nespresso extended the at-home lifecycle focus with RELOVE refurbishment programs across 21 markets and raised progress on recycled aluminum usage and compostable capsule pilots, supporting sustainability-aligned purchases. Energy labels in Switzerland and auto-shutoff limits in the European Union continued to push residential devices toward lower annual consumption, which strengthened the value proposition for efficient machines that reduce standby losses and optimize heating cycles.
Specialty Café Footprint Expansion Driving Aspirational Demand
Professional adoption of automation gathered pace as chains aimed for consistent quality, modular maintenance, and telemetry that reduces service disruption. WMF introduced the espresso NEXT platform to deliver barista-style profiles with automation assistance, while maintaining craft elements that resonate with operators seeking quality alongside labor efficiency. Specialty beverage momentum continued to influence menus, as United States data showed espresso-based drinks reached 43% past-week consumption among adults in spring 2025, encouraging equipment investments that standardize milk textures and extraction workflows. Franke emphasized cloud connectivity, over-the-air updates, and remote diagnostics across its trade-show demonstrations, signaling the strategic role of fleet-wide control in high-throughput environments. The convergence of demand for premium beverages and digital fleet management created a reinforcement cycle where café operators deploy IoT-enabled machines to ensure quality at scale, optimize maintenance schedules, and reduce total cost of ownership.
Smart, Connected Brewer Innovation Cycle
Device connectivity and software-defined brewing moved from differentiators to mainstream expectations across premium tiers. Bosch launched the 300 and 800 Series fully automatic espresso machines with Home Connect, Coffee World recipe access, voice-enabled controls, and remote diagnostics, providing up to 35 beverage options and stored favorites across user profiles. De’Longhi’s professional and household portfolios advanced through connectivity and telemetry that enhance predictive service scheduling and reduce downtime, which supported revenue growth and margin resilience in 2025. Nestlé scaled the Vertuo ecosystem with barcode-based extraction control and highlighted Nescafé Dolce Gusto Neo as a 2025 growth initiative, aligning personalization with convenience for home users. UNIC, part of Electrolux Professional Group, announced a collaboration to integrate instant water-heating technology designed to mitigate limescale and extend service intervals, illustrating how heating architecture contributes to stability and lifecycle costs. Compliance updates such as IEC 60335-2-75:2024 added hot-surface temperature limits, markings, and electrode-heater requirements for commercial dispensing appliances, reinforcing baseline safety expectations for connected fleets.
Restraints Impact Analysis*
| Restraint | (~) % Impact on CAGR Forecast | Geographic Relevance | Impact Timeline |
|---|---|---|---|
| High Upfront and Lifecycle Costs of Premium Systems | -0.8% | Global, strongest impact in price-sensitive emerging markets | Short term (≤ 2 years) |
| Regulatory and Consumer Backlash on Single-Use Capsule Waste | -0.6% | Europe & North America leading, expanding globally | Medium term (2-4 years) |
| Demand Plateau in Saturated Mature Markets | -0.5% | North America & Western Europe primarily | Long term (≥ 4 years) |
| Semiconductor and Logistics Bottlenecks Limiting Supply | -0.4% | Global, with acute impact in high-tech product segments | Short term (≤ 2 years) |
| Source: Mordor Intelligence | |||
High Upfront and Lifecycle Costs of Premium Systems
Premium pricing created adoption hurdles for value-focused households, especially in markets where discretionary income remains tight. Bosch’s 300 and 800 Series machines launched at USD 699 to USD 2,299, a bracket that aligns with the upper midrange to premium portion of the coffee machine market. WMF’s fully automatic lines are positioned above USD 1,176 for compact commercial and high-end office use, signaling that connected features and milk systems often carry higher initial costs despite long-run efficiency gains. Breville’s Oracle Jet highlighted energy-optimized heating and automated milk texturing, yet the company’s fiscal 2025 disclosures acknowledged margin pressure tied to logistics and tariff dynamics, indicating that premium innovation must coexist with tight cost control. Manufacturers also face the indirect costs of safety and energy-label compliance, along with data and reporting obligations where programs like ENERGY STAR reference idle and brew energy limits for commercial brewers, which influence component selection and test cycles[3]U.S. EPA, “ENERGY STAR Program Requirements for Commercial Coffee Brewers – Version 1.1,” energystar.gov. Refurbishment pathways seek to widen access through certified second-life units, as seen in JURA’s longstanding service model and Nespresso’s RELOVE program, while Tchibo and koorvi launched a digital trade-in platform in 2025 to recapture and resell used machines.
Regulatory and Consumer Backlash on Single-Use Capsule Waste
Policy and infrastructure gaps shaped the waste challenge for single-serve systems as state-level EPR regimes and producer-led take-back models evolved in North America and Europe. Keurig Dr Pepper broadened solutions via K Cycle for commercial clients and K Cycle At Home mail-back services while reporting 96% recyclability or compostability across total packaging in 2024 and documenting material recovery achievements in Canada. Nespresso reported a 35% global recycling rate in 2024, supported by more than 100,000 collection points and collaboration with national programs such as the UK Podback scheme and Germany’s Yellow Bag system, which elevated access to responsible disposal pathways. Universities and enterprises explored institutional models that reduce waste volumes, highlighted by Arizona State University’s reusable program that targets significant diversion at scale through repeated use of durable components. A 2025 life-cycle assessment compared a pod machine and a drip brewer, finding both platforms faced design-for-disassembly constraints, which underscores the value of modular designs, rapid-release fasteners, and standardized subassemblies to boost end-of-life recovery.
*Our forecasts treat driver/restraint impacts as directional, not additive. The impact forecasts reflect baseline growth, mix effects, and variable interactions.
Segment Analysis
By Product Type: Capsule Systems Accelerate Amid Premium Filter Dominance
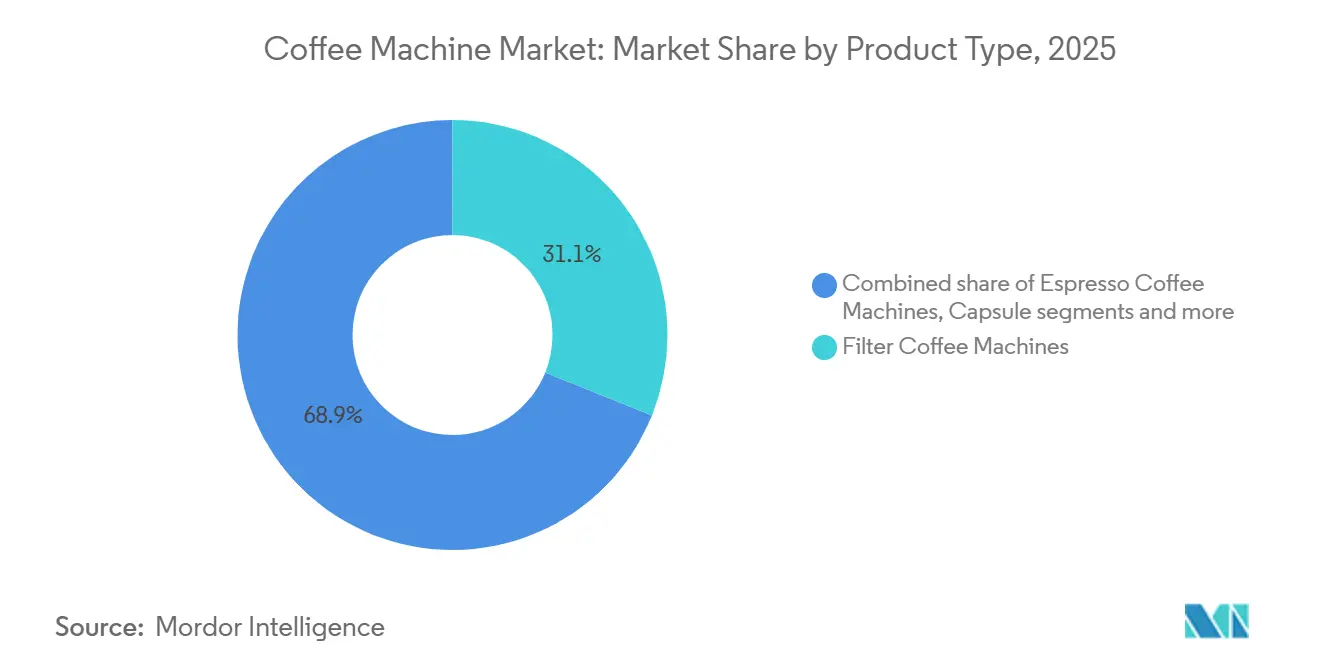
Filter coffee machines held a 31.10% share in 2025, driven by strong household penetration and certified brewers ensuring consistent temperature and extraction standards. Capsule and pod systems are projected to grow at a 7.60% CAGR during 2026-2031, supported by compostable formats and barcode-guided brewing for repeatable outcomes. By January 2025, 62% of United States households owned drip makers, while 42% had single-cup brewers, reflecting a balance between convenience and capacity in the coffee machine market. Nespresso increased investments in Vertuo and expanded sustainability programs, enhancing capsule circularity and promoting durable machine ownership. The Specialty Coffee Association validated new home brewers in 2025, ensuring compliance with Golden Cup extraction standards.
Bean-to-cup systems reached 15% ownership in United States households by January 2025, aided by connected models integrating grinding, dosing, and milk texturing. Bosch’s 800 Series introduced Home Connect features like Coffee Playlist and voice control, streamlining multiuser preferences. Environmental regulations influenced capsule development, with Keurig launching K-Rounds, free of plastic and aluminum, and expanding disposal programs under its circular packaging roadmap. Nespresso reported 100% of Original Line capsules using 80% recycled aluminum and 95% for Vertuo, alongside paper-based home-compostable capsules in 14 countries. AHAM standards provided uniform testing methods for household coffee makers, while ENERGY STAR set energy benchmarks for commercial batch brewers, guiding product labels and procurement decisions.


By Automation Level: Fully Automatic Dominance Fueled by Labor-Reduction Imperatives
Fully automatic and super-automatic platforms held a 74.60% market share in 2025, with a projected 6.50% CAGR through 2031, driven by operator demand for consistency and reduced training needs in high-throughput venues. Commercial fleets prioritize modular serviceability and connectivity, enabling remote menu updates and diagnostics to reduce technician visits and downtime. At Host Milano 2025, WMF and SEB Professional showcased digital platforms offering cross-brand solutions for cafés, hospitality, offices, and retail. Franke highlighted cloud connectivity, remote updates, and energy-efficient hardware aligned with cost and sustainability goals.
The IEC 60335-2-75:2024 standard introduced hot-surface and electrode-heater provisions, ensuring advanced features meet baseline safety protections. Semi-automatic machines remain relevant in premium cafés and boutique hotels, where craft and visual theater drive demand. Platforms like WMF’s espresso NEXT blend traditional workflows with automation to maintain consistency while preserving the human element. Energy-optimized systems, such as the Victoria Arduino Eagle One, reduce energy use by 35% and environmental impact by 23%, while UNIC’s instant water heating minimizes limescale and extends maintenance intervals. Fully automatic machines dominate chain and self-service environments, while semi-automatics anchor craft-led formats, reflecting a clear market hierarchy.
By End User: Residential Segment Entrenched; Commercial Channel Modernizes
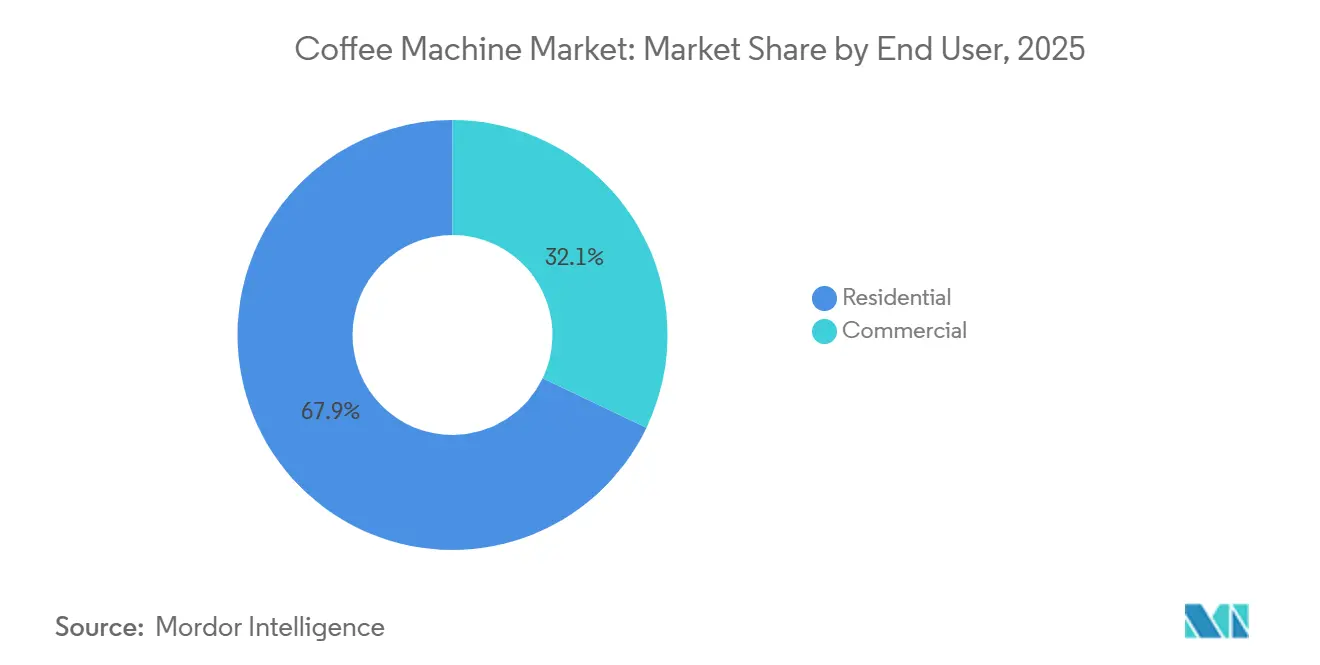
The residential sector accounted for 67.90% of end-user demand in 2025, with a projected CAGR of 6.20% through 2031. Strong household adoption of drip, single-cup, bean-to-cup, and espresso systems drives this growth. Keurig Dr Pepper shipped 10.4 million brewers in 2024, reinforcing the installed base despite flat pod volumes, reflecting pricing sensitivity and durable device demand. NCA data in 2025 showed household penetration at 62% for drip coffee makers, 42% for single-cup brewers, 15% for bean-to-cup, and 12% for espresso machines. Nespresso expanded Vertuo in North America, focusing on cold-coffee innovation and production capacity to meet evolving tastes. The residential market increasingly values energy-efficient designs and advanced milk and extraction controls for café-like experiences at home.
Commercial demand represented 32.10% in 2025, as operators prioritized consistent quality using connected fleets to standardize menus and textures. WMF, Schaerer, and Franke emphasized automated cleaning, multi-milk handling, and over-the-air updates to optimize peak performance. Hamilton Beach expanded foodservice placements, highlighting plant-based milk appliances aligned with café trends. ENERGY STAR’s commercial batch brewer standards and federal procurement guidelines influenced purchasing. In Europe and Switzerland, labeling and auto-shutoff rules shaped machine features, favoring platforms that reduce standby losses and enable rapid heat-up.
By Distribution Channel: B2C Channels Leverage E Commerce; B2B Direct Sales Optimize TCO
B2C channels held 67.20% of distribution in 2025, with a projected 6.90% CAGR through 2031. This growth stems from specialty retail, multi-brand outlets, and direct online sales, enhancing discovery, bundling, and after-sales engagement. Nespresso achieved double-digit e-commerce growth while expanding boutiques, maintaining end-to-end consumer journey control, and supporting machine refurbishment and capsule take-back where feasible. SCA’s certification program in 2024 boosted consumer confidence in premium drip and multi-serve brewers, reducing perceived risks and encouraging upgrades from entry-level devices. As brands refine first-party data strategies via apps and subscriptions, online channels complement stores by linking maintenance prompts to filter and descaling purchases.
B2B accounted for 32.8% of market share in 2025, serving foodservice, offices, hospitality, and retail with direct sales, multi-year service agreements, and telemetry-based maintenance. Franke’s connectivity portfolio enabled two-way communication, centralized menu management, and remote troubleshooting to align with peak traffic. WMF and SEB Professional showcased integrated beverage ecosystems at Host Milano 2025, spanning coffee, juice, water, and digital services to clarify ownership costs. Hamilton Beach emphasized its global commercial footprint and foodservice partnerships, highlighting specialized equipment’s role in cafés and quick-service restaurants. United States public procurement rules promote ENERGY STAR-certified brewers, setting performance benchmarks that influence residential products as platforms scale across categories.
Geography Analysis
Europe accounted for 38.60% of global revenue in 2025, driven by mature specialty-coffee cultures in Northern and Southern Europe and strong retail and boutique networks linking equipment to capsule ecosystems. Energy-efficiency regulations, including factory auto-shutoff limits and labeling mandates, reduced annual residential device consumption and encouraged zero-standby modes. Nespresso achieved a 35% global recycling rate for aluminum capsules in 2024, supported by broad collection coverage, while Podback and national sorting schemes expanded disposal options in key markets like the UK and Germany. De’Longhi’s nine-month 2025 performance reflected strong home-coffee-machine demand, leveraging design and innovation that resonate with European consumers. Commercial machine makers like WMF and Franke focused on digitalization, remote management, and milk-system versatility, aligning with urban café formats in the coffee machine market[4]WMF, “Press Releases: WMF Professional Coffee Machines,” aboutwmf.com.
Asia-Pacific is projected to grow at a 7.80% CAGR through 2031, with urbanization boosting specialty-coffee penetration in China, India, and Australia. Rising disposable incomes support premium automation and bean-to-cup systems. Early 2025 saw De’Longhi report double-digit revenue growth in China, highlighting demand for café-quality home machines. Versuni India Home Solutions (Philips Domestic Appliances) expanded its espresso category in FY 2023-2024, preparing for steady demand growth in major metros and supporting multi-price-tier placements. USDA estimates Japan’s 2025-2026 coffee imports at 6.0 million bags, while Nestlé expanded ready and cold-format options across APAC, including barista-style home beverages. In Australia and New Zealand, stable disposable incomes and high specialty awareness sustained the upgrade cycle for premium countertop equipment in the coffee machine market.
North America, led by the United States, recorded 23.8 million bags of coffee imports and 26.6 million bags of consumption in 2025-2026, reflecting a stable market for equipment and consumables. NCA’s 2025 data showed 66% of American adults drink coffee daily, with specialty beverages and app-based ordering at record highs, complementing strong at-home usage. Keurig Dr Pepper’s 2024 brewer shipments demonstrated resilience despite pod pricing elasticity. Canada expanded curbside K-Cup pod acceptance and refurbishment initiatives at Van Houtte. USDA projected Brazil at 63.0 million bags and Colombia at 13.8 million bags in 2025-2026, shaping price expectations and equipment demand across residential and foodservice channels in the coffee machine market.

Regulatory Landscape
Safety and performance compliance for coffee machines is anchored in electrical appliance standards and evolving energy-policy processes across major markets. In North America, household coffee makers are covered by ANSI/UL 1082 (updated through 2024). Global product safety alignment follows IEC 60335-1 (Amendment 1:2025) and IEC 60335-2-15 (2024) for household appliances. For commercial dispensing appliances, IEC 60335-2-75:2024 adds hot-surface and electrode-heater provisions, which shape design validation and labeling.
Energy and trade policy add further compliance and cost layers. In the United States, the Department of Energy issued a Notice of Proposed Rulemaking in July 2026 to overhaul procedures governing federal appliance energy conservation standards, following a February 2025 action that postponed implementation of several finalized standards. This procedural uncertainty affects efficiency planning and test-cycle design. On cross-border economics, imports classified under HTS 8516.71.00 face a U.S. general duty rate of 3.7% (as referenced for 2026), while EU import duties for comparable codes are lower (0% to 2.2%), which influences landed-cost strategies for globally sourced machines and components.
Value Chain Analysis
The coffee machine value chain runs from raw materials and key components (stainless steel, plastics and food-contact materials, pumps and valves, boilers/thermoblocks, sensors, PCBs, and connectivity modules) through OEM/ODM design, assembly, and final testing, then onward through multi-channel distribution. B2C includes mass retail, specialty retailers, and direct-to-consumer e-commerce linked to consumable ecosystems (pods/capsules, filters, descalers). B2B relies on direct sales and dealer networks for hospitality, offices, and foodservice, with installation, preventive maintenance, and managed-service contracts that monetize uptime.
Two execution dynamics are increasingly visible. First, standards-driven measurement influences how product teams specify heating architecture, idle-state controls, and supplier documentation. In Europe, industry methods for energy and productivity measurement for professional and super-automatic machines (such as EN 50730:2025-05 as published by UCIMAC) reinforce structured testing and cascade into component selection and supplier qualification. Second, supply and logistics constraints weigh on connected and super-automatic platforms, which face tighter lead times for electronics and sensors. Freight volatility and transit disruptions on key shipping corridors increase total delivered cost for equipment and subassemblies moving from manufacturing bases (notably Europe) into Asia and the Middle East, prompting more regionalized assembly and service-part stocking to stabilize delivery and after-sales performance.
Competitive Landscape
Keurig Dr Pepper shipped 10.4 million brewers in 2024, maintaining its leading position in the United States and Canadian single-serve brewing markets, driven by household adoption of convenience-focused formats. WMF held a 28% global share in automatic professional machines, reinforcing Groupe SEB’s leadership in commercial coffee platforms. Residential segments remained competitive, with De’Longhi, Bosch, Philips, JURA, and Breville focusing on energy efficiency, milk textures, and connectivity for simplified maintenance. Brands intensified competition by expanding refurbishment, IoT telemetry, and energy-conscious features, alongside subscription models for filters, descalers, and capsules.
Sustainability and digital transformation shaped strategies in 2025. Keurig Dr Pepper reported 96% recyclability across its packaging portfolio in 2024, advancing K-Cycle and mail-back programs to enhance recovery options. Nespresso achieved a 35% global recycling rate for aluminum capsules in 2024, expanded paper-based compostable capsules to 14 countries, and targeted improved recycling rates by 2030. De’Longhi raised its 2025 outlook, citing strong demand for home coffee equipment and professional performance, supported by brand investments and design leadership. Breville diversified manufacturing to Mexico and Southeast Asia to mitigate tariff exposure on 120-volt products while investing in premium platforms like Oracle Jet and SCA-compliant drip brewers. Franke showcased connected solutions with over-the-air updates and fleet analytics, enhancing service economics for chain operators.
Energy performance and circularity offered innovation opportunities. JURA’s zero-energy switch addressed idle-time waste in premium home machines. Victoria Arduino’s Eagle One combined instant heating with heat recovery to reduce energy use in third-wave cafés, where sustainability influences procurement. UNIC’s instant water-heating integration improved uptime and component life in professional settings. Refurbishment programs gained traction, including Nespresso’s RELOVE in 21 markets and Tchibo’s 2025 digital trade model. Keurig Dr Pepper’s Canada business documented high refurbishment ratios supporting landfill diversion. Emerging disruptors like Scanomat and BrewBird emphasized recyclable materials and compostable bean pods, though scale remains limited.
Coffee Machine Industry Leaders
Keurig Dr Pepper
Nestlé Nespresso
De’Longhi Group
Panasonic
Breville Group
- *Disclaimer: Major Players sorted in no particular order

Market Opportunities and Future Outlook
Compliance-led redesign and clearer labeling create room for energy-management differentiation, particularly in Europe and North America where standards updates and measurement rules are actively maintained. The EU amended ecodesign measurement conditions for household coffee machines via Commission Regulation (EU) 2025/2262 (November 2025), requiring manufacturers to substantiate energy performance under clarified test conditions. This tends to favor architectures that reduce standby losses and control heating more precisely. In commercial fleets, structured methods to measure energy consumption and productivity (for example, FprEN 50730 and related environmental information approaches such as EN 50693 referenced in product rules) also affect procurement comparisons, supporting connected machines that can document performance and streamline servicing.
Sustainability and circularity are likewise translating into product and program opportunities across single-serve systems and machine life-cycle services. Producers operating in the EU must align with WEEE (Directive 2012/19/EU), which pushes design-for-disassembly, repairability, and end-of-life recovery practices. That alignment supports refurbishment and certified second-life models already visible in the market, including Nespresso RELOVE. On single-serve formats, plastic-reduction pathways are moving from pilots to launches. Lavazza’s Tablì system uses plastic-free compressed coffee tablets, highlighting opportunities for machine makers that can pair new consumable formats with compatible brewers and collection and recycling pathways.
Recent Industry Developments
- April 2026: Keurig Dr Pepper completed the acquisition of a 96.22% stake in JDE Peet's N.V. and outlined plans to form an independent Global Coffee Co. by year-end 2026. The acquisition concentrates a larger installed base, brand portfolio, and route-to-market under a coffee-focused structure. It raises the competitive bar for scale in single-serve platforms and distribution.
- August 2025: Breville unveiled its next-generation Oracle Dual Boiler espresso machine with upgraded temperature stability and Wi-Fi-enabled functionality. The launch reinforced the premium home segment's shift toward connected features and automation that reduce user skill barriers while maintaining espresso quality positioning.
- June 2024: Nespresso expanded its RELOVE refurbishment approach across multiple markets as part of its broader circularity push around durable machines and capsule recovery. This strengthened the role of manufacturer-led service networks in extending machine life cycles and supporting sustainability-aligned purchasing decisions.


Research Methodology Framework and Report Scope
Market Definition and Coverage
For this study, the coffee machine market covers factory-built equipment used to brew coffee in homes and foodservice settings, across drip, espresso, pod or capsule, and bean-to-cup formats, and it is valued at the manufacturer selling price.
Scope exclusions: We exclude accessories, stand-alone grinders, refurbished units, industrial roasting equipment, and vending kiosks.
Segmentation Overview
- By Product Type
- Espresso Coffee Machines
- Filter/Drip Coffee Machine
- Capsule/Pod Coffee Machine
- Bean-to-Cup Coffee Machines
- Other Product Types (Moka Pot, French Press, etc.)
- By Automation Level
- Semi-Automatic
- Fully Automatic / Super-Automatic
- By End User
- Residential
- Commercial
- By Distribution Channel
- B2C Channels
- Multi-Brand Stores
- Exclusive Brand Outlets
- Online
- Other Distribution Channels
- B2B Channel (directly from the manufacturers)
- B2C Channels
- By Geography
- North America
- Canada
- United States
- Mexico
- South America
- Brazil
- Peru
- Chile
- Argentina
- Rest of South America
- Asia-Pacific
- India
- China
- Japan
- Australia
- South Korea
- South East Asia (Singapore, Malaysia, Thailand, Indonesia, Vietnam, and Philippines)
- Rest of Asia-Pacific
- Europe
- United Kingdom
- Germany
- France
- Spain
- Italy
- BENELUX (Belgium, Netherlands, and Luxembourg)
- NORDICS (Denmark, Finland, Iceland, Norway, and Sweden)
- Rest of Europe
- Middle East And Africa
- United Arab of Emirates
- Saudi Arabia
- South Africa
- Nigeria
- Rest of Middle East And Africa
- North America
Data Sources, Market Sizing, and Validation
Desk Research
Desk research starts with public demand and supply signals that can be checked repeatedly. We refer to trade and industry data such as UN Comtrade import-export series for small domestic appliances, International Trade Centre indicators, and government statistical releases for household appliance spending and foodservice activity in major economies.
To ground adoption and usage patterns, we also review sources such as International Coffee Organization consumption updates, published coffee shop and hospitality association notes in key regions, and peer-reviewed articles covering brewing equipment trends and consumer behavior. Company filings, investor presentations, and reputable business press are used to map product mix shifts (manual, semi-automatic, and fully automatic) and to sanity-check pricing and channel movement. When needed, we also use paid subscriptions for company financials and patent databases to confirm innovation cycles and to avoid missing smaller but fast-growing product categories. The desk research sources mentioned are illustrative only, and many additional public documents were used for data collection, validation, and clarification.
Primary Interviews and Surveys
Primary work is used to pressure-test the model against real selling conditions and product mix realities. Interviews include manufacturers, component suppliers, distributors, and foodservice buyers, and the goal is to confirm replacement cycles, pricing ladders, and the split between household and commercial demand across APAC, EMEA, and the Americas.
Distribution of primary research fieldwork respondents
| Company type | Respondent position | Region |
|---|---|---|
| Top tier: 26% | CXOs: 16% | APAC: 46% |
| Mid tier: 55% | Functional/Unit leaders: 25% | EMEA: 30% |
| Smaller Players: 19% | Managers: 59% | Americas: 24% |
Market-Sizing & Forecasting
Sizing is built using a top-down approach where household appliance demand pools, foodservice equipment spending, and trade flows for relevant appliance categories are reconstructed by region and then filtered to coffee machines using product mix and penetration indicators. Once that total is formed, we corroborate it with selective bottom-up checks, such as sampled average selling price ranges by machine type and a roll-up of reported revenue exposure from a set of visible suppliers, which then helps adjust any obvious under or over counts.
A few inputs matter most in this market, and we keep them explicit so they can be rechecked. These include the split of home versus commercial installations, replacement cycles by automation level, average selling price progression for pod or capsule systems versus espresso and bean-to-cup, channel mix shifts toward online retail, and regional coffee consumption intensity that influences unit demand. Where bottom-up coverage is incomplete, gaps are handled by applying conservative uplift factors tied to distribution coverage and import exposure, followed by a second pass through interview feedback.
For the forecast, we use scenario analysis anchored in macro indicators and validated by expert expectations on category shifts. Growth paths are shaped by variables such as household appliance spend outlook, cafe and quick-service outlet expansion, premiumization into fully automatic machines, and the pace of pod-based adoption, and then they are translated into value forecasts through ASP and mix assumptions that are refreshed during validation.
Data Validation & Update Cycle
Validation is done by checking the model against independent signals that should move in the same direction, and then tracing any large variance back to one or two assumptions. We run anomaly checks across regions, review year-to-year jumps in units and ASPs, and re-contact sources when the model output conflicts with what channels and buyers report as current market behavior.
Before sign-off, results go through multi-step analyst review where key assumptions are recalculated and the logic trail is rechecked for consistency. Reports are refreshed annually, and interim updates are made when material events impact pricing, availability, or demand. Right before delivery, an analyst performs a fresh pass so clients receive the latest updated view.
Mordor Intelligence's Global Coffee Machine Market Size Measured Against Other Published Estimates
Published market values for coffee machines can look far apart, even when the topic label sounds identical, because the counted products and the pricing level are not always the same. Differences also show up when one study leans more on shipment proxies and another leans more on demand signals, and then applies a different time window for currency conversion and updates.
Import-export signals for small domestic appliances, combined with interview-validated manufacturer selling prices by machine type, are the checks that keep Mordor Intelligence tied to factory-built coffee machines only, and that boundary tends to lift the total versus studies that anchor on retail sales or narrower channel tracking. The spread also comes from scope choices, since some estimates fold in adjacent items like vending or refurbished units, and others apply slower ASP progression for fully automatic machines or use older base years without refresh after price inflation.
Benchmark comparison
| Source | Market Size | Gaps in Research Methodology |
|---|---|---|
| Mordor Intelligence | USD 19.02 B (2025) | |
| Trade Publisher A | USD 12.30 B (2023) | Uses an earlier base year and a shorter forecast window, and the sizing is presented at a different pricing point for several channels, which can understate value when manufacturer ASPs rise. |
| Data Aggregator B | USD 13.74 B (2024) | Often blends type and application splits using standardized templates, and it can apply conservative ASP curves and partial regional coverage assumptions that reduce the total versus a full global demand pool build. |
The table shows that year choice, pricing point, and scope boundaries explain most of the gap in reported values. By keeping inclusions limited to new, factory-built coffee machines and by linking demand drivers to practical price and mix checks, we arrive at a number that can be traced back to clear steps and refreshed inputs.


Key Questions Answered in the Report
What is the current size and outlook for the global coffee machine space to 2031?
It stands at USD 20.03 billion in 2026 and is projected to reach USD 26.77 billion by 2031 at a 5.6% CAGR, reflecting resilient at-home demand and connected commercial deployments.
Which product types and automation tiers are leading or growing fastest in coffee machines?
Filter machines lead volume at 31.10% share, while capsule and pod systems are the fastest growing at a 7.60% CAGR, and fully automatic platforms command 74.60% of automation sales with a 6.50% growth outlook.
How are residential and commercial users evolving their adoption of coffee machines?
Residential accounts for 67.90% with a 6.20% growth outlook, while commercial holds 32.1% and emphasizes super automatics, telemetry, and energy-efficient brewers to manage labor and operating costs.
Which regions are most important for coffee machine growth through 2031?
Europe contributed 38.60% of 2025 revenues, and Asia Pacific is the fastest-growing region at a 7.80% CAGR, supported by urbanization and specialty coffee adoption in China, India, and Southeast Asia.
What policies and standards are shaping energy and safety performance in coffee machines?
U.S. ENERGY STAR Version 1.1 sets idle and brew energy limits for commercial brewers, the EU caps residential auto shutoff at 30 minutes with EN 60661 testing, and IEC 60335-2-75:2024 updates safety for commercial dispensing appliances.
How are sustainability and EPR mandates affecting single-serve systems?
Producers are investing in circular infrastructure, advancing compostable and recyclable capsules, expanding mail-back and curbside programs, and reporting rising recycling rates, which shape pod formats and compatible machine launches.
Page last updated on:




