Market Overview
| Study Period | 2020 - 2031 |
|---|---|
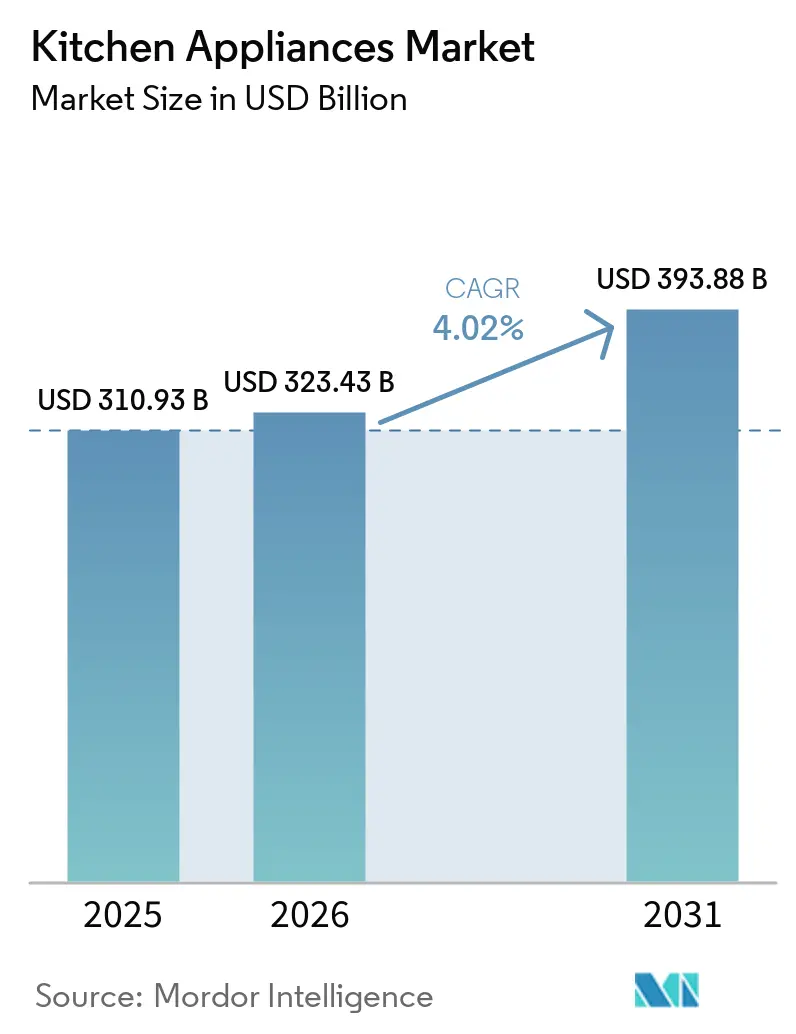
| Market Size (2026) | USD 323.43 Billion |
| Market Size (2031) | USD 393.88 Billion |
| Growth Rate (2026 - 2031) | 4.02% CAGR |
| Fastest Growing Market | Asia Pacific |
| Largest Market | North America |
| Market Concentration | Medium |
Major Players *Disclaimer: Major Players sorted in no particular order Image © Mordor Intelligence. Reuse requires attribution under CC BY 4.0. | |
Kitchen Appliances Market Analysis by Mordor Intelligence
The kitchen appliances market size reached USD 310.93 billion in 2025, is USD 323.43 billion in 2026, and is projected to reach USD 393.88 billion by 2031 at a 4.02% CAGR. Regulatory timetables in the United States for dishwashers, microwaves, and refrigerators are advancing replacement cycles ahead of compliance, creating near-term demand even as mature-market saturation weighs on unit sales. Europe’s standby and networked standby limits that began in May 2025 are driving power management redesigns, with policymakers targeting large cumulative energy savings by decade's end. Competitive dynamics remain active as global leaders scale vertical integration, refresh product portfolios with AI-enabled features, and localize production to manage tariffs and service obligations under right-to-repair rules.
Key Report Takeaways
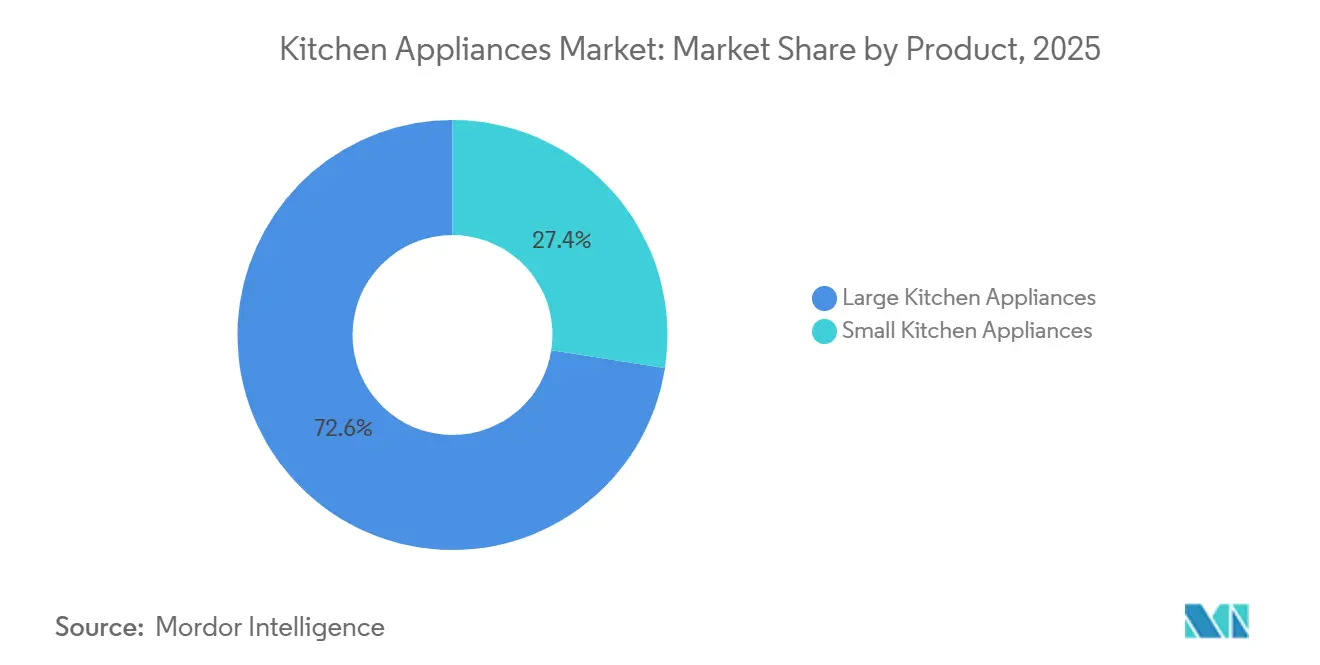
- By product, in the kitchen appliances market, large kitchen appliances led with 72.55% revenue share in 2025, while small kitchen appliances are forecast to grow the fastest at a 4.72% CAGR through 2031.
- By end user, in the kitchen appliances market, residential held a 59.20% share in 2025, while commercial is projected to post the highest growth at a 5.03% CAGR to 2031.
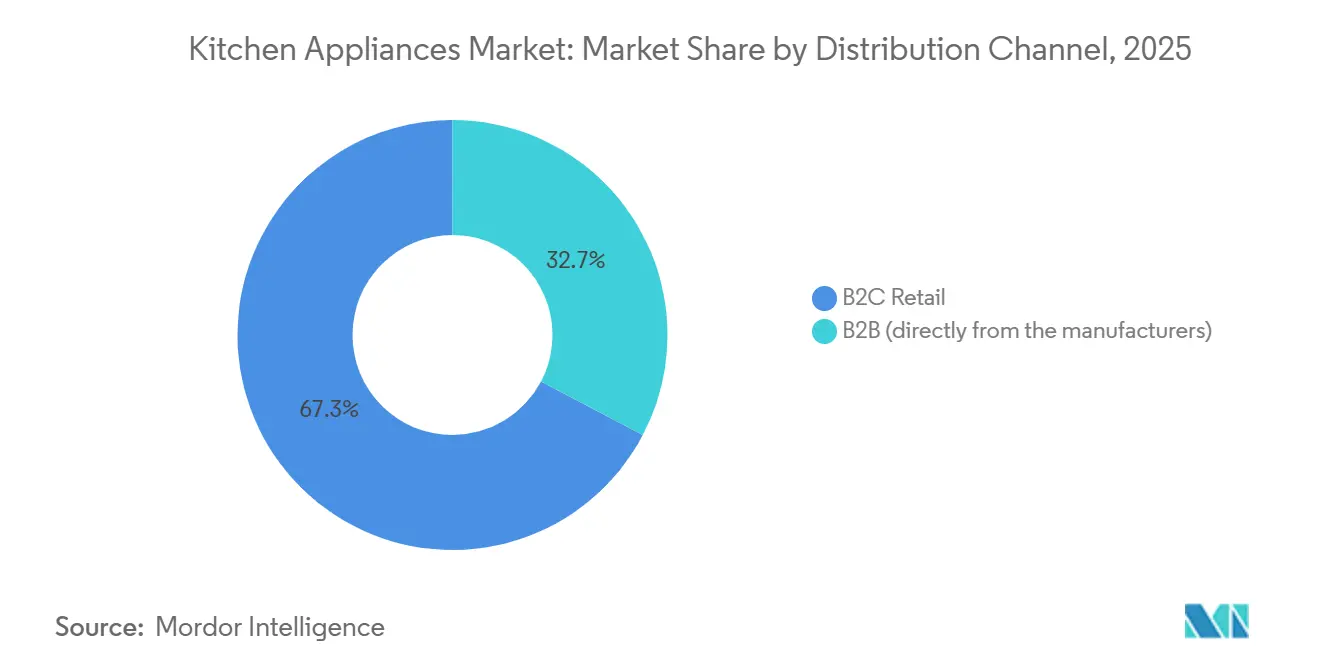
- By distribution channel, in the kitchen appliances market, B2C accounted for a 67.30% share in 2025, and online is the fastest-growing sub-channel at a 5.78% CAGR.
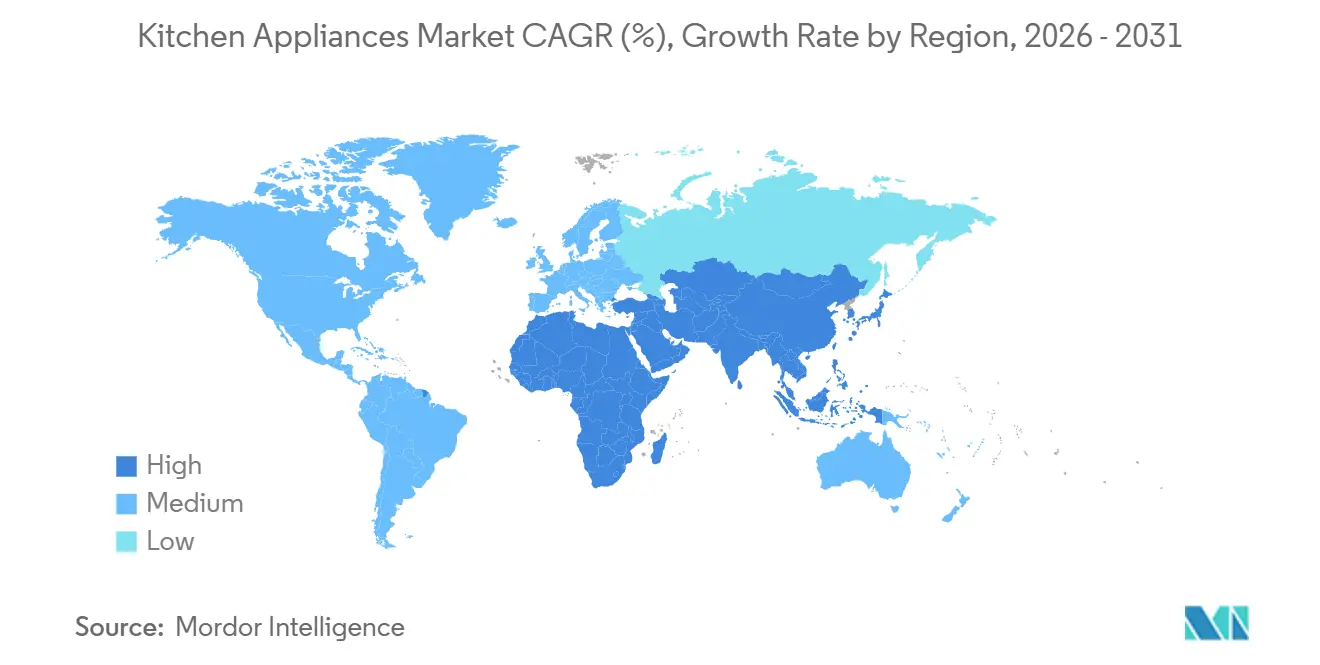
- By geography, in the kitchen appliances market, North America held a 31.70% share in 2025, while the Asia-Pacific is projected to be the fastest-growing region at a 5.42% CAGR through 2031.
Note: Market size and forecast figures in this report are generated using Mordor Intelligence’s proprietary estimation framework, updated with the latest available data and insights as of 2026.
Global Kitchen Appliances Market Trends and Insights
Drivers Impact Analysis*
| Driver | (~) % Impact on CAGR Forecast | Geographic Relevance | Impact Timeline |
|---|---|---|---|
| Smart Connected Appliance Adoption Accelerates Upgrade Cycles | +0.8% | North America and the European Union, spillover to urban Asia-Pacific | Medium term (2-4 years) |
| Energy-Efficiency Regulations Spur Replacement of Legacy Refrigerators and Dishwashers | +0.6% | Global, with early gains in the United States, the European Union, and Japan | Short term (≤ 2 years) |
| E-commerce and Omnichannel Expand Reach, Especially for Small Kitchen Appliances | +0.5% | Asia-Pacific core, Eastern Europe, North America | Medium term (2-4 years) |
| Premiumization and Modular Kitchen Adoption Increase Average Selling Prices | +0.4% | North America, Western Europe, the Middle East | Long term (≥ 4 years) |
| Transition to Natural Refrigerants (R600a/R290) Creates Redesign and Replacement Cycles | +0.5% | European Union regulatory-driven, North America voluntary adoption | Medium term (2-4 years) |
| AI-Enabled Cooking Assistance Integrated into Ovens/Cooktops Improves Usability and Attachment Rates | +0.2% | North America, Western Europe, Japan, South Korea | Long term (≥ 4 years) |
| Source: Mordor Intelligence | |||
Smart Connected Appliance Adoption Accelerates Upgrade Cycles
Connected functionality is shifting from novelty to utility, nudging upgrade intent earlier in the lifecycle in the kitchen appliances market. GE Appliances’ 2026 GE Profile Smart 4-Door French-Door Refrigerator integrates a Scan-to-List barcode scanner that syncs with internal cameras to provide real-time visibility, reflecting a move toward time-saving workflows rather than standalone gadgets. Budget-tier connectivity is also spreading as BSH introduced a French-door refrigerator line with full Matter support, signaling that mid-range brands must differentiate through software, service, and predictive maintenance rather than Wi-Fi checkboxes alone. The ecosystem effect deepens with AI-enabled wall ovens that recognize food types and suggest settings, turning premium SKUs into platforms that tie users to apps, accessories, and extended service plans. As more devices connect, security posture becomes a buying criterion, and certification milestones such as TÜV Nord IoT Security Certification for major brands set expectations for secure provisioning, patching, and data protection. These shifts collectively increase attachment rates for connected suites, encourage step-up purchases, and support price/mix resilience in the kitchen appliances market even when unit growth moderates.
Energy Efficiency Regulations Spur Replacement of Legacy Refrigerators and Dishwashers
A rolling cadence of efficiency standards is compressing decision horizons for households and businesses, and it is already visible in advanced replacement activity across the kitchen appliances market. The United States Department of Energy finalized new compliance dates for dishwashers, microwaves, and refrigerators, prompting retailers and OEMs to run pre-compliance promotions and trade-in programs to clear older inventory and seed higher-efficiency baselines. In Europe, Regulation (EU) 2023/826 caps standby and networked standby power for many household devices, driving redesigns in control electronics and power management and targeting sizable cumulative energy savings by 2030 [1]European Commission, “Commission Regulation (EU) 2023/826,” EUR-Lex, eur-lex.europa.eu. Voluntary labeling continues to differentiate top performers as ENERGY STAR Most Efficient recognition creates a clear premium tier and directs utility rebates where available. Vertically integrated manufacturers with captive compressors and inverter capabilities are better placed to manage redesign costs and maintain pricing discipline during the transition, as the next wave of standards phases in. The kitchen appliances market benefits from a replacement uplift that partly offsets saturation in mature regions.
Premiumization and Modular Kitchen Adoption Increase Average Selling Prices
Affluent households are treating the kitchen as a curated space, which supports higher average selling prices for integrated and design-led SKUs in the kitchen appliances market. BSH’s premium launches, including Series 8 ovens with AI food recognition and expanded finish options, aim to combine convenience with aesthetics in a single decision[2]BSH Hausgeräte, “Newsroom,” BSH, bsh-group.com. Whirlpool’s portfolio, with an emphasis on KitchenAid and CAFÉ finishes, caters to renovators who want cohesive looks that sustain mix improvement even when discretionary spending is uneven. Premium refrigeration like the GE Profile smart model at USD 4,899 packages assistants, inventory visibility, and app integrations to convert one-time hardware sales into longer customer relationships through service plans and software. Built-in formats that favor panel-ready doors and flush installations are gaining share in urban housing and higher-end residential projects as space planning and visual continuity become more important. This steady pivot to premium form factors and connected suites lifts price/mix in the kitchen appliances market, while also expanding the opportunity for accessories and after-sales services.
Transition to Natural Refrigerants (R600a/R290) Creates Redesign and Replacement Cycles
Policy momentum toward low-GWP refrigerants is driving a cycle of redesigns and early replacements across both commercial and residential kitchen appliances. Europe’s updated F-gas regime and national standards are pushing OEMs to qualify propane-based systems and to update safety engineering in components and enclosures. In the United States, the EPA SNAP program continues to align acceptable substitutes for high GWP refrigerants in household and commercial refrigeration, which influences new builds and retrofits. Commercial foodservice and grocery buyers are acting ahead of full enforcement to lock in energy and maintenance savings, which favors vertically integrated players with in-house compressors and controls expertise. Strategically, acquisitions that expand regional distribution of compliant systems, such as Haier’s purchase of a South African water heating business, enable cross-selling into replacement cycles as new standards arrive. As compliant supply scales, the kitchen appliances market benefits from feature upgrades and energy savings, even as design complexity and certification costs rise for OEMs.
Restraints Impact Analysis*
| Restraint | (~) % Impact on CAGR Forecast | Geographic Relevance | Impact Timeline |
|---|---|---|---|
| Input Cost Volatility (Steel, Electronics, Semiconductors) Pressures Margins and Retail Pricing | -0.7% | Global, acute in import-dependent Latin America, and Middle East & Africa | Short term (≤ 2 years) |
| Mature‑Market Saturation Elongates Replacement Cycles and Suppresses Unit Growth | -0.5% | North America, Western Europe, Japan | Long term (≥ 4 years) |
| Right‑to‑Repair and Repairability Mandates Increase Design and Service Cost Burdens | -0.3% | United States, including California, Colorado, Minnesota, and New York, European Union under discussion. | Medium term (2-4 years) |
| Stricter Standby/Networked‑Standby Limits Constrain Always‑On Connected Feature Sets | -0.2% | EU27, United Kingdom | Short term (≤ 2 years) |
| Source: Mordor Intelligence | |||
Input Cost Volatility Pressures Margins and Retail Pricing
Rapid moves in metals and electronics have made it harder for mid-tier brands to protect margins, narrowing promotional flexibility in the kitchen appliances market. Purchasing teams have faced sustained pressure as supplier quotes rose alongside broader manufacturing input indices, reflected in the Institute for Supply Management’s pricing metrics through mid-2025. In response, leading OEMs have leaned into vertical integration and factory automation to reduce exposure to spot components and to stabilize lead times. Larger balance sheets also enable earlier commitments for critical semiconductors and motors, which can moderate pass-through costs when tariffs or supply hiccups arise. Smaller brands without captive parts have less room to maneuver, which can slow new product introductions or push them into narrower price bands. These cost dynamics add friction to price ladders and can temporarily dampen unit demand at entry points in the kitchen appliances market when retailers adjust assortments.
Mature Market Saturation Elongates Replacement Cycles and Suppresses Unit Growth
High ownership levels in North America, Western Europe, and Japan are extending replacement timelines, shifting the emphasis to price/mix and services in the kitchen appliances market. OEM commentary since late 2024 has indicated a slower recovery in United States housing activity and a pivot toward premium SKUs, warranties, and subscription-like services to drive value in flat-unit environments. Right to repair obligations that require parts availability and service documentation can lengthen useful life and encourage repair over replace, which is rational for budget-sensitive households. In Europe’s dense urban centers, smaller kitchens and shared laundry further cap large-format growth, which presses brands to innovate in compact, integrated formats [3]California Legislature, “SB 244 Right to Repair Act,” California State Legislature, leginfo.legislature.ca.gov. Against this backdrop, leading players are investing in domestic manufacturing and logistics agility to defend their share in mature markets while capturing premium price points. The net effect is softer unit expansion but steadier revenue trajectories in the kitchen appliances market, supported by premiumization and ecosystem strategies.
*Our forecasts treat driver/restraint impacts as directional, not additive. The impact forecasts reflect baseline growth, mix effects, and variable interactions.
Segment Analysis
By Product: Air Fryers and Built-In Appliances Reshape Category Dynamics
Large kitchen appliances commanded 72.55% of the kitchen appliances market share in 2025, while small kitchen appliances are projected to advance at a 4.72% CAGR during 2026- 2031 as ownership broadens and lifestyle use cases diversify. Within small formats, compact cooking devices, multi-function ovens, and connected countertop units benefit from e-commerce scale and entry price points that encourage trial. The kitchen appliances market is seeing steady interest in healthier, faster cooking methods that do not require remodels, which favors small appliances that deliver convenience in limited spaces. Brands are targeting app simplicity and presets that shorten learning curves, and they are trying to anchor repeat engagement through content and accessories. On the large appliance side, energy standards and connected diagnostics are the primary upgrade triggers, so OEMs are packaging higher efficiency with self-service features to reduce downtime. The result is a balanced cadence in the kitchen appliances market, where premium innovation at the top coexists with frequent launches of small devices that refresh purchase intent between major cycles.
Dishwashers and refrigerators remain the most visible replacement categories as standards are tightened and as ENERGY STAR tiers differentiate annual savings for buyers who track ownership costs. Ventilation and cooktops are gaining attention as induction becomes more prevalent, with integrated options that streamline installation and maximize design flexibility in open kitchens. Small-appliance specialists continue to diversify across beverage, cooking, and cleaning sub-niches, helping the kitchen appliance products market capture incremental tasks without waiting for whole-kitchen remodels. Product roadmaps also reflect a focus on software updates and accessory ecosystems that can extend freshness after launch, which benefits categories with longer hardware cycles. For compact urban living, targeted launches emphasize small footprints paired with performance, as seen in new high-speed ovens and narrower refrigeration for apartments and aging-in-place needs. Across both large and small segments, the kitchen appliance market is standardizing simple app experiences, voice interoperability, and low standby consumption to meet policy trends and user expectations.


By End User: Commercial Segment Automation Outpaces Residential Renovation Cycles
Residential end users accounted for 59.20% of the kitchen appliances products market share in 2025, yet commercial buyers are forecast to grow faster at a 5.03% CAGR as foodservice, hospitality, and contract catering accelerate refresh cycles and automation. Quick service and catering operators emphasize programmable equipment and connected monitoring for uptime and consistency, which raises the appeal of advanced combi ovens, dish machines, and high-capacity refrigeration. Regulatory momentum around refrigerants and efficiency also increases the pace of change in supermarkets and food retail, where the switch to natural refrigerants and tighter energy use is a priority in procurement. For commercial kitchens with extended operating hours, replacement cycles shorten due to higher utilization, keeping the kitchen appliances market supported even when consumer spending is uneven. As a result, commercial refresh demand provides a structural counterweight to slower-moving residential replacements in mature geographies.
In residential settings, new construction, relocations, and large-scale remodels still account for the bulk of large appliances, but parts availability rules and service transparency are helping many households extend their lifecycles affordably. Growth in smaller households and aging-in-place favor compact dishwashers, slimmer ranges, and undercounter refrigerators that reduce bending and fitting into tighter footprints. Multifamily developers standardize reliable mid-tier connected packages to offer smart conveniences while managing capital budgets, which benefits OEMs with dedicated project teams and service footprints. Commercial outreach is expanding as global players invest in regional capacity and channel partnerships to supply contract catering and hospitality, as evidenced by factory expansions aimed at Africa and the Middle East. M&A that enhances built-in expertise and EMEA distribution is also informing end-user strategies as large players integrate portfolios to address both residential and commercial use cases.
By Distribution Channel: Online Disrupts Traditional Retail Economics, While B2B Concentrates
B2C channels held 67.30% of the kitchen appliances products market in 2025, while online is the fastest growing sub-channel at a 5.78% CAGR as digital discovery, configuration, and delivery improve. Multi-brand retail remains essential for demonstrations, bundled installation, and same-day pickup, but omnichannel paths lower friction through AR visualization and specification comparison, reducing returns. Exclusive brand outlets target premium shoppers with curated experiences and installation services, translating store visits into multi-appliance packages for remodels. Direct-to-consumer models improve control over merchandising and customer data, which supports accessories, filters, and extended warranty attachments beyond initial sales. As delivery windows shorten and home-installation logistics improve, online’s role in the kitchen appliance market broadens from small appliances to selected large appliances.
B2B distribution accounted for 32.70% of 2025 sales and continues to consolidate around direct manufacturer contracting with developers, hotel groups, and foodservice chains seeking volume pricing, standard SKUs, and national service coverage. Builder and project channels prioritize dependable lead times and spec-grade reliability, which rewards OEMs with domestic capacity and tight logistics to job sites. Online procurement tools are also gaining traction for B2B reorder flows and warranty management, which reduces administrative overhead for operators with multi-site footprints. As brands expand virtual showrooms and configuration tools, the kitchen appliances products market benefits from lower consideration friction and clearer installation planning across both consumer and commercial journeys.
Geography Analysis
North America accounted for 31.70% of 2025 global revenue, and the region’s growth outlook reflects slower housing turnover and longer replacement intervals, partly offset by premium upgrades in the kitchen appliances market. The policy environment matters in this region as federal efficiency standards phase in and as several states adopt repairability rules that increase service availability and parts access. Canada’s federal incentives for energy retrofits have supported interest in upgrading older appliances in provinces with active programs, adding momentum to large appliance replacements. Onshoring commitments by leading brands improves supply resilience and reduces lead times, helping retailers manage assortments across seasons. With mature penetration across most core categories, the kitchen appliance market in North America relies on mix improvement, connected suites, and attachment services for growth.
Asia-Pacific is projected to be the fastest-growing region at a 5.42% CAGR through 2031, driven by rapid urbanization in secondary cities, a rising middle class, and expanding electrification that is lifting ownership across key categories. Supply chains in the region serve both export and domestic demand, and technology leaders in Korea and Japan continue to export premium connected SKUs for households that want advanced features. E-commerce platforms streamline distribution across Southeast Asia, allowing brands to reach customers without the dense physical retail networks that benefit small appliances first and increasingly larger units with white-glove delivery. As regional policymakers phase in higher efficiency and refrigerant standards, OEMs are offering compliant models aligned with global platforms to scale volume and service at lower unit costs. This mix of rising access, digital retail infrastructure, and standards alignment positions the kitchen appliances market in Asia-Pacific for sustained gains across both entry and premium tiers.
Europe’s trajectory balances saturated Western markets with faster-growing Eastern peripheries, while the Middle East & Africa and South America benefit from urbanization and new-build activity that drive packaged large-appliance sales. The European Union’s standby and networked standby rules set clear design targets for connected devices and reinforce consumer preference for efficient, interoperable products in the kitchen appliances market [4]U.S. Department of Energy, “Appliance and Equipment Standards Program,” U.S. Department of Energy, energy.gov. In Africa and the Middle East, capacity investments by global OEMs aim to serve regional demand with shorter lead times, while cross-selling through acquired distribution footprints accelerates entry into new categories. South America’s leading manufacturers leverage local plants to mitigate import duties and currency volatility, which supports steady supply and share gains in core categories. Across these regions, the kitchen appliances market aligns with policy, infrastructure, and construction cycles, which determine the pace of replacements, new placements, and premiumization.

Competitive Landscape
The kitchen appliances market remains moderately concentrated, with Haier Smart Home, including GE Appliances, holding roughly 17.4% of global volume in 2025, and a cluster of peers in the mid-single digits across major categories. Scale advantages stem from captive component manufacturing, long-standing retail partnerships, and the ability to carry compliance and service obligations across large installed bases. Strategic capacity investments in North America aim to secure share and service quality in a mature, promotion-intensive environment that rewards consistent supply and rapid installation. Companies with vertical integration can absorb input volatility more effectively and pivot faster as regulations change regarding refrigerants, efficiency, and repairability in the kitchen appliances market.
Technology roadmaps are differentiating premium leaders from value disruptors as AI-enabled cooking assistance and connected diagnostics become standard in the upper tiers. First to market moves on data security and lifecycle support are building trust as connected ownership grows, with certifications and over-the-air update commitments now part of brand positioning. Portfolio expansion through M&A remains active in Europe and Africa as global players acquire built-in expertise and regional distribution to broaden category coverage. Factory and R&D footprints are being refreshed to bring key product families closer to demand centers, helping manage lead times and supporting channel-specific assortments across retail and B2B routes.
Regulatory adaptation is a competitive lever as right to repair rules, European Union Ecodesign, and refrigerant transitions reshape lifecycle costs and service models in the kitchen appliances products market. Leaders who publish service documentation, maintain robust parts pipelines, and standardize platforms for efficient certification achieve lower costs to serve and higher customer satisfaction. At the same time, value brands and private labels are targeting price-sensitive segments, which keeps pressure on established names to justify premiums with tangible performance and ownership benefits. This barbell of AI-first innovation at the top and sharpened value propositions at entry points defines the current competitive strategy in the kitchen appliances products market.
Kitchen Appliances Industry Leaders
Haier Smart Home (Haier, GE Appliances)
Whirlpool Corporation
Midea Group
BSH Hausgeräte GmbH (Bosch, Siemens)
Electrolux Group (Electrolux, AEG)
- *Disclaimer: Major Players sorted in no particular order

Recent Industry Developments
- February 2026: KitchenAid launched its Smart Double Wall Oven with an intelligent cooking camera at KBIS 2026, extending premium differentiation with embedded computer vision.
- February 2026: Sharp announced the Celerity High Speed Oven at an MSRP of USD 3,999.99 and a 24-inch French door refrigerator for small space living, with availability targeted for spring 2026.
- January 2026: GE Appliances unveiled its GE Profile Smart 4 Door French Door Refrigerator with Kitchen Assistant at an MSRP of USD 4,899, featuring Scan to List barcode scanning, Instacart integration, and internal cameras.
- January 2026: GE Appliances introduced Smart Wall Ovens with CookCam AI technology at an MSRP of USD 3,499, adding food recognition, remote monitoring, and doneness alerts.


Research Methodology Framework and Report Scope
Market Definitions and Key Coverage
Our study defines the global kitchen appliances market as all newly manufactured electric or fuel-powered devices used to prepare, cook, and store food in residential or commercial kitchens, covering large units such as refrigerators, ovens, cooktops, hoods, dishwashers, and small countertop machines including blenders, air fryers, and coffee makers. Smart and conventional variants are valued at factory-gate prices before retail mark-ups.
Scope exclusion: We exclude second-hand equipment, installation labor, aftermarket parts, and built-in cabinetry from the valuation.
Segmentation Overview
- By Product
- Large Kitchen Appliances
- Refrigerators & Freezers
- Dishwashers
- Range Hoods
- Cooktops
- Ovens
- Other Large Kitchen Appliances
- Small Kitchen Appliances
- Food Processors
- Juicers and Blenders
- Grills and Roasters
- Air Fryers
- Coffee Makers
- Electric Cookers
- Toasters
- Electric Kettles
- Countertop Ovens
- Other Small Kitchen Appliances (bread makers, waffle makers, egg cookers, etc.)
- Large Kitchen Appliances
- By End User
- Residential
- Commercial
- By Distribution Channel
- B2C/Retail
- Multi-brand Stores
- Exclusive Brand Outlets
- Online
- Other Distribution Channels
- B2B (directly from the manufacturers)
- B2C/Retail
- By Geography
- North America
- Canada
- United States
- Mexico
- South America
- Brazil
- Peru
- Chile
- Argentina
- Rest of South America
- Europe
- United Kingdom
- Germany
- France
- Spain
- Italy
- BENELUX (Belgium, Netherlands, Luxembourg)
- NORDICS (Denmark, Finland, Iceland, Norway, Sweden)
- Rest of Europe
- Asia-Pacific
- India
- China
- Japan
- Australia
- South Korea
- South-East Asia
- Rest of Asia-Pacific
- Middle East & Africa
- United Arab Emirates
- Saudi Arabia
- South Africa
- Nigeria
- Rest of Middle East & Africa
- North America
Detailed Research Methodology and Data Validation
Primary Research
We interview appliance makers, importers, big-box retailers, and e-commerce platforms across North America, Europe, Asia-Pacific, and the Middle East. Their insights on average selling prices, replacement cycles, and forthcoming regulations fill information gaps and let us fine-tune assumptions.
Desk Research
Mordor analysts open with authoritative public datasets that map production, trade, and installed stock. We extract HS-coded flows from UN Comtrade and national customs, appliance stock data from the International Energy Agency, housing completions from the US Census and Eurostat, and income indices from the OECD to flag demand shifts. Trade bodies such as the Association of Home Appliance Manufacturers, the European Federation of Catering Equipment Manufacturers, and the China Household Electrical Appliances Association complement these inputs with product mix ratios and efficiency benchmarks.
Company filings, Questel patent analytics, and news curated in Dow Jones Factiva sharpen our understanding of technology diffusion and price points, while D&B Hoovers supplies firm-level revenue splits that guide category weights. The sources listed are illustrative only; many additional references underpin data collection, validation, and clarification.
Market-Sizing & Forecasting
A top-down model converts country production plus net trade into a 2025 demand pool. Then, sampled supplier roll-ups are used to validate totals. Key variables like new dwelling completions, household disposable income, renovation spending, e-commerce share, and energy-efficiency mandates feed a multivariate regression that projects values to 2030. Where granular inputs remain patchy, we align them to the macro totals through weighted adjustments agreed with respondents. Scenario analysis gauges sensitivity to price inflation and smart-appliance adoption.
Data Validation & Update Cycle
Our outputs pass anomaly filters, multi-step peer review, and leadership sign-off. Reports refresh each year, with interim revisions triggered by major recalls, policy shifts, or supply disruptions to ensure clients receive the latest view.
Why Our Kitchen Appliances Baseline Inspires Confidence
Published estimates often diverge because firms select different product baskets, price layers, and update rhythms, yet our clearly defined scope and annual refresh keep the 2025 baseline current.
Key gap drivers include some publishers adding kitchen furniture, others omitting countertop devices, and several locking currency conversions to historic rates, all of which inflate or deflate totals versus Mordor's live models.
Benchmark comparison
| Market Size | Anonymized source | Primary gap driver |
|---|---|---|
| USD 310.93 B | Mordor Intelligence | |
| USD 291.30 B | Global Consultancy A | Adds kitchen furniture and HVAC, limited trade adjustment |
| USD 242.32 B | Trade Journal B | Excludes countertop devices, conservative replacement horizon |
| USD 539.69 B | Industry Think-Tank C | Bundles home comfort gadgets, uses fixed 2019 exchange rates |
The comparison highlights that once scope creep or narrow definitions are removed, Mordor's disciplined approach delivers a balanced, transparent baseline decision-makers can trust.


Key Questions Answered in the Report
What is the current market size for kitchen appliances, and how fast will it grow to 2031?
The kitchen appliances market size is USD 323.43 billion in 2026 and is projected to reach USD 393.88 billion by 2031 at a 4.02% CAGR.
Which regions lead, and which grow the fastest, in the kitchen appliances market?
North America led with 31.70% of global revenue in 2025, while the Asia‑Pacific is forecast to grow the fastest at 5.42% through 2031.
What product and end‑user segments are most important in the kitchen appliances market?
Large kitchen appliances accounted for 72.55% of 2025 revenue, and residential accounted for 59.20%, while small kitchen appliances and the commercial segment are the fastest-growing at 4.72% and 5.03% CAGRs, respectively.
How are the United States and European Union regulations affecting the kitchen appliances market in 2026?
DOE efficiency timelines are pushing forward replacements, and the EU’s standby limits are driving power management redesigns, together accelerating compliant launches and channel promotions.
What role do connected and AI-enabled features play in purchase decisions?
Connectivity, app simplicity, and AI cooking assistance are raising attachment rates for premium suites and helping justify higher price points in renovation and upgrading cycles.
Which companies are shaping competitive dynamics in the kitchen appliances market?
Haier Smart Home leads by global volume, while GE Appliances, BSH, Whirlpool, Midea, Samsung, and Electrolux influence strategy through capacity investments, product ecosystems, and regulatory readiness.
Page last updated on:


