Market Overview
| Study Period | 2020 - 2031 |
|---|---|
| Forecast Data Period | 2026 - 2031 |
| Historical Data Period | 2020 - 2024 |
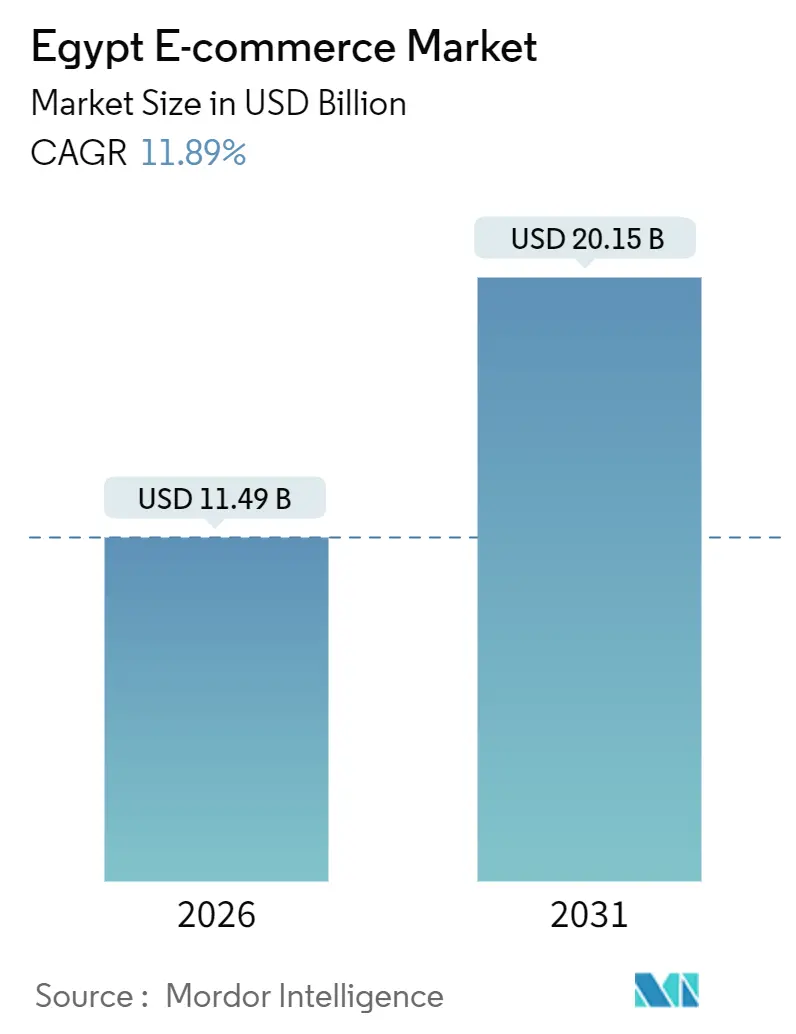
| Market Size (2026) | USD 11.49 Billion |
| Market Size (2031) | USD 20.15 Billion |
| Growth Rate (2026 - 2031) | 11.89% CAGR |
| Market Concentration | Medium |
Major Players *Disclaimer: Major Players sorted in no particular order Image © Mordor Intelligence. Reuse requires attribution under CC BY 4.0. | |
Egypt E-commerce Market Analysis by Mordor Intelligence
The Egypt e-commerce market size is USD 11.49 billion in 2026 and is projected to reach USD 20.15 billion by 2031, recording an 11.89% CAGR over the forecast period. Widespread mobile-wallet adoption, a young digital-native population, and rapid 4G and 5G roll-outs are widening the online shopper base and compressing the cash-to-digital transition timeline. Foreign-exchange volatility is inflating import costs, yet platforms are countering margin pressure by localizing supply chains, embedding fintech, and optimizing fulfillment networks. Government programs, notably the Cashless Egypt Programme and Nafeza single-window customs platform, are lowering payment and clearance frictions, while social-commerce and quick-commerce models are reshaping discovery and delivery economics. Competitive intensity is escalating as global giants, regional champions, and specialist newcomers court smartphone-centric consumers across Greater Cairo, Alexandria, and emerging Tier-2 cities.
Key Report Takeaways
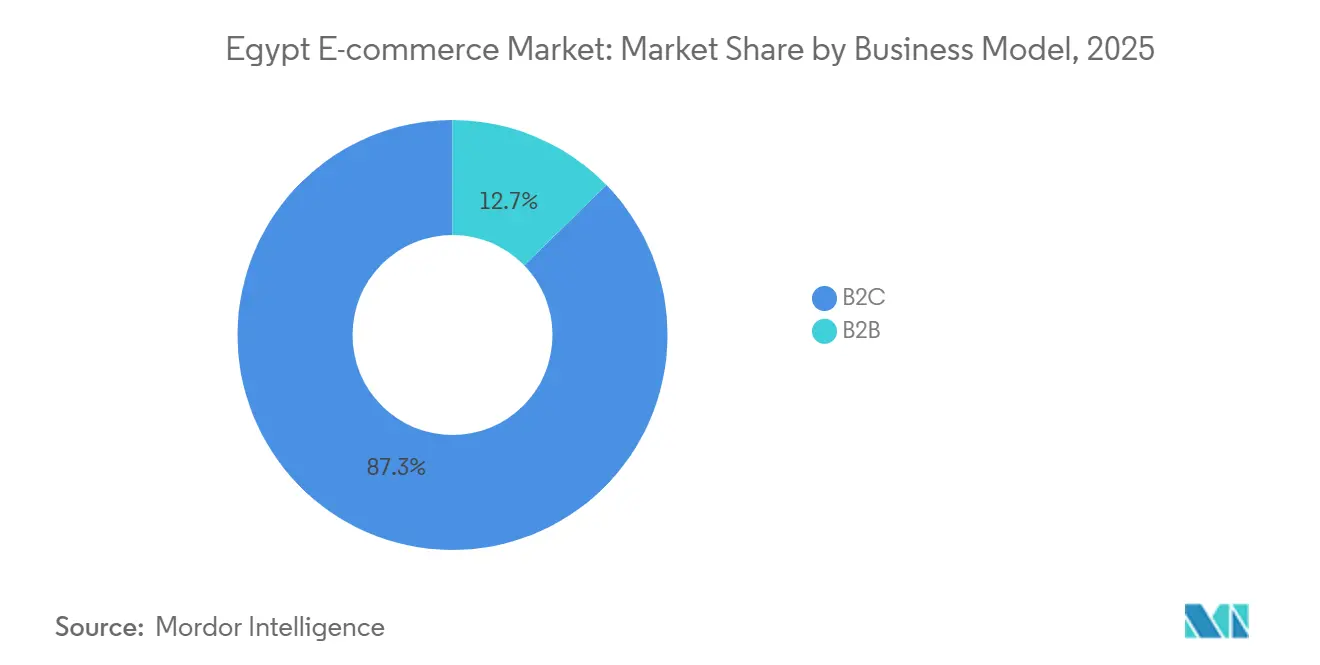
- By business model, business-to-consumer transactions held 87.29% of the Egypt e-commerce market share in 2025, while the business-to-business segment is poised to expand at a 15.37% CAGR through 2031.
- By device type, smartphones commanded 72.48% of transaction value in 2025 and are forecast to grow at a 14.32% CAGR to 2031.
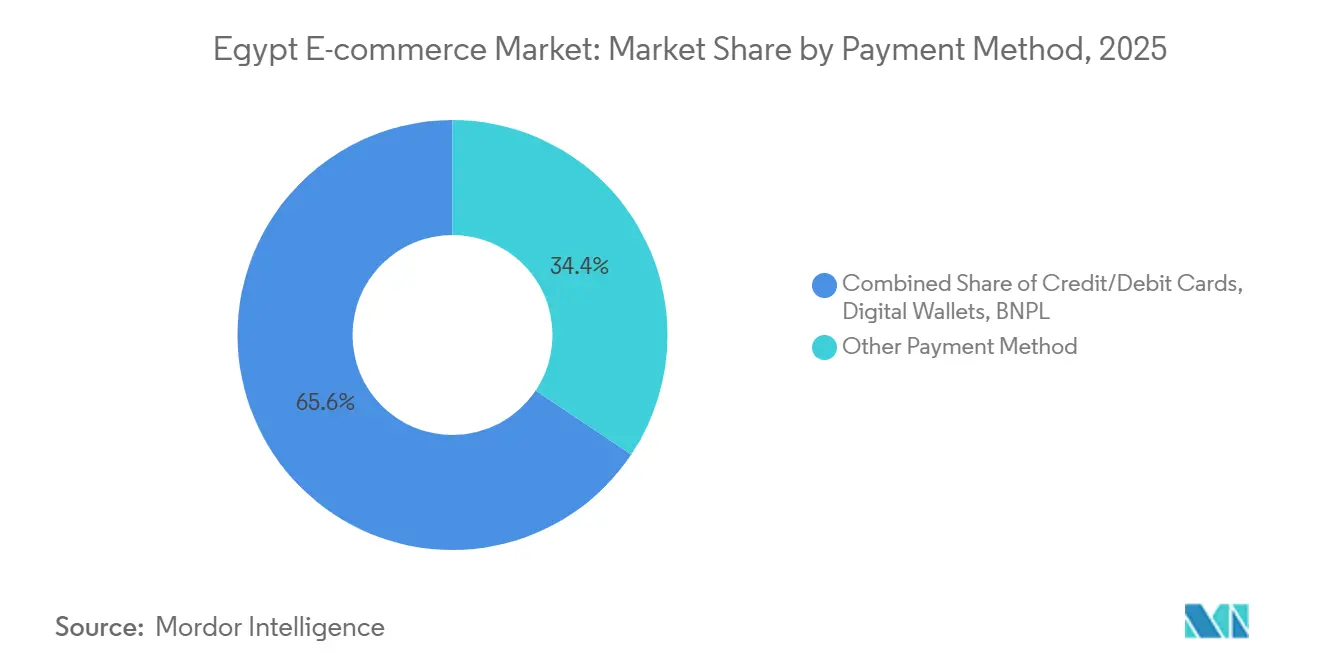
- By payment method, digital wallets are advancing at a 15.18% CAGR between 2026 and 2031, outpacing all other options in the Egypt e-commerce market.
- By B2C product category, consumer electronics led with a 21.88% revenue share in 2025, whereas food and beverage is projected to grow at a 16.26% CAGR through 2031.
Note: Market size and forecast figures in this report are generated using Mordor Intelligence’s proprietary estimation framework, updated with the latest available data and insights as of January 2026.
Egypt E-commerce Market Trends and Insights
Drivers Impact Analysis*
| Driver | (~) % Impact on CAGR Forecast | Geographic Relevance | Impact Timeline |
|---|---|---|---|
| Mobile-Wallet Adoption Driven by Cashless Egypt Programme | +2.3% | National, Greater Cairo, Alexandria, Delta governorates | Medium term (2-4 years) |
| Gen-Z Social-Commerce Surge via TikTok and Instagram | +1.8% | Urban centers, 18-34 age cohort | Short term (≤ 2 years) |
| Expansion of Dark-Stores and Q-commerce in Cairo and Alexandria | +1.5% | Cairo, Giza, Alexandria, Mansoura, Tanta | Medium term (2-4 years) |
| Government Export-Oriented Logistics Parks Boosting Cross-Border Fulfillment | +1.2% | Suez Canal Economic Zone, Port Said, 6th of October City | Long term (≥ 4 years) |
| National Digital Egypt Identity Platform Lowering KYC Friction | +0.9% | Nationwide, early banking and fintech adoption | Medium term (2-4 years) |
| Widening 4G/5G Coverage Enhancing Rural Delivery Feasibility | +1.1% | Rural Upper Egypt, Sinai, remote Delta villages | Long term (≥ 4 years) |
| Source: Mordor Intelligence | |||
Mobile-Wallet Adoption Driven by Cashless Egypt Programme
Mobile-wallet accounts climbed to 46.3 million in Q2 2025, a 29% year-on-year increase, while transaction volumes surged 80% to 718 million. Financial inclusion reached 76.3% by mid-2025, reflecting success in agent banking and digital onboarding. InstaPay processed 1.561 billion instant transfers in 2024, underpinning real-time settlement that mitigates cash-on-delivery friction.[1]Central Bank of Egypt, “Financial Inclusion and Digital Payments Data Q2 2025,” cbe.org.eg Apple Pay introduced tokenized contactless payments in December 2024, signaling readiness for premium wallet experiences.[2]Apple Inc., “Apple Pay Launches Tokenization Services in Egypt,” apple.com The convergence of regulatory push, infrastructure upgrades, and consumer adoption is shrinking settlement cycles, cutting logistics cash-handling costs, and improving working-capital efficiency across the Egypt e-commerce market.
Gen-Z Social-Commerce Surge via TikTok and Instagram
TikTok counted 32.94 million adult users, and Instagram reached 18.15 million users in Egypt by 2025.[3]Kepios, “Digital 2025: Egypt – Social Media Users and Platform Statistics,” datareportal.com Gen-Z shoppers are embracing in-app checkouts, live-stream events, and influencer storefronts, collapsing discovery-to-purchase funnels and lowering acquisition costs. SHEIN’s April 2025 capsule collection with actress Hannah El Zahed leveraged her six million Instagram followers to spike traffic and conversion. Social-commerce popularity is nudging established marketplaces to embed shoppable video and creator tools or risk losing a mobile-native audience that views shopping as a social experience.
Expansion of Dark Stores and Q-Commerce in Cairo and Alexandria
Quick-commerce operators such as Talabat’s tMart and Rabbit are rolling out dark stores that promise 20-minute grocery delivery across densely populated neighborhoods. The model eliminates customer-facing real estate, concentrates fast-moving inventory, and captures impulse demand, particularly in food and beverages. Density economies, where adjacent micro-fulfillment sites share vehicle fleets, are key to reducing per-order costs below break-even. Operators that master routing algorithms and bundle higher-margin household essentials stand to cement customer loyalty and raise average order value within the Egypt e-commerce market.
Government Export-Oriented Logistics Parks Boosting Cross-Border Fulfilment
Egypt is developing logistics parks in the Suez Canal Economic Zone, Port Said, and 6th of October City to serve African and Middle Eastern trade corridors. DP World’s Sokhna container terminal and Agility’s warehousing projects shorten import lead times and cut last-leg costs.[4]DP World, “Sokhna Container Terminal Operations,” dpworld.com Nafeza reduced average cargo release to 8.73 days, although small-parcel consignments still face delays. As infrastructure matures, Egyptian fulfillment hubs could attract regional marketplaces seeking faster cross-border delivery into Sudan, Libya, and the Horn of Africa.
Restraints Impact Analysis*
| Restraint | (~) % Impact on CAGR Forecast | Geographic Relevance | Impact Timeline |
|---|---|---|---|
| FX Volatility Inflating Import Costs for Online Retailers | -1.7% | Nationwide, acute in electronics and fashion | Short term (≤ 2 years) |
| Fragmented Last-Mile Networks Outside Tier-1 Cities | -1.3% | Upper Egypt, Sinai, remote Delta governorates | Medium term (2-4 years) |
| Persistent Consumer Trust Gap Around Online Fraud and Returns | -0.8% | National, higher among first-time shoppers and older demographics | Medium term (2-4 years) |
| Customs Clearance Delays on Small Parcels | -0.6% | Nationwide, import-reliant platforms | Short term (≤ 2 years) |
| Source: Mordor Intelligence | |||
FX Volatility Inflating Import Costs for Online Retailers
The Egyptian pound’s 40% devaluation against the United States dollar in March 2024 inflated landed costs, compressing gross margins for import-heavy verticals. Jumia cited margin pressure from currency swings in its Q1 2025 results.[5]Jumia, “Q1 2025 Financial Results,” investor.jumia.com Platforms with local sourcing or supplier concessions are better positioned, whereas pure-play importers face demand erosion as retailers pass price hikes to price-sensitive consumers.
Fragmented Last-Mile Networks Outside Tier-1 Cities
Rural Upper Egypt, Sinai, and remote Delta governorates lack standardized addresses and courier density, pushing delivery costs above urban benchmarks. Third-party logistics partners deliver inconsistent service, causing failed deliveries and elevated return rates. Platforms building proprietary fleets or partnering with local couriers to densify networks in secondary cities can unlock incremental demand, yet capital intensity and operational complexity deter smaller entrants in the Egypt e-commerce market.
*Our forecasts treat driver/restraint impacts as directional, not additive. The impact forecasts reflect baseline growth, mix effects, and variable interactions.
Segment Analysis
By Business Model: B2B Digitization Accelerates Despite B2C Dominance
Business-to-consumer transactions captured 87.29% of the Egypt e-commerce market share in 2025, underscoring consumer platforms’ maturity. However, the business-to-business channel is forecast to post a 15.37% CAGR from 2026 to 2031, marking the fastest trajectory among business models. MaxAB’s merger with Wasoko in August 2024 created Africa’s largest B2B marketplace, serving more than 150,000 retailers with procurement, inventory financing, and route optimization services. The combined entity processes 2.5 million orders and doubled its fintech portfolio, illustrating how embedded finance deepens retailer stickiness. Amazon and Noon, dominant in B2C, are expanding seller services, fulfillment capacity, and payment flexibility to defend share.
The B2C segment is evolving toward larger fulfillment footprints and premium delivery promises. Amazon boosted capacity to 100,000 cubic meters at its 10th of Ramadan City site in December 2025, shortening lead times across Greater Cairo and the Delta. Noon’s USD 500 million raise in December 2025 funds geographic expansion and tech upgrades ahead of a planned IPO. The Consumer Protection Agency’s Regulated E-Commerce initiative, launched in December 2024, elevates compliance standards, likely accelerating consolidation as smaller players grapple with higher operating costs.


By Device Type: Mobile-First Commerce Entrenches Dominance
Smartphones accounted for 72.48% of transaction value in 2025 and are projected to expand at a 14.32% CAGR to 2031, reinforcing mobile primacy in the Egypt e-commerce market size. Faster 5G roll-outs by Telecom Egypt, Vodafone Egypt, Orange Egypt, and e promise richer mobile shopping experiences, including augmented-reality product views and live-stream shopping. Desktop and laptop orders remain relevant for high-ticket purchases but are ceding share as mobile interfaces improve. Tablets and smart TVs represent niche channels yet could grow alongside connected-home adoption.
Platforms optimizing app performance, push-notification engagement, and wallet integration stand to win share. Fawry’s myFawry app crossed 15.9 million downloads by September 2024, aided by 382,600 POS terminals that bridge offline-to-online payments. App-first strategies align with Egypt’s demographics, where smartphone ownership far outstrips desktop penetration, and enable super-app models that bundle commerce, payments, and logistics within a unified interface.
By Payment Method: Digital Wallets Gain Ground as Cash Recedes
Cash-on-delivery and bank transfers represented 34.37% of payment value in 2025, reflecting lingering trust gaps, yet digital wallets are advancing at a 15.18% CAGR to 2031. Central Bank initiatives, InstaPay’s instant-payment rails, and wallet providers such as Fawry, Vodafone Cash, and Orange Money are nudging consumers toward digital settlement, curbing cash-handling costs for merchants. Credit and debit cards remain critical for high-value and cross-border orders, while buy-now-pay-later schemes gain traction among credit-thin Gen-Z shoppers. Fawry reported a buy-now-pay-later portfolio of EGP 653.1 million (USD 13.3 million) in September 2024, underlining latent demand for installment options.
Platforms offering a spectrum of payment choices, digital wallets for convenience, COD for risk-averse buyers, and BNPL for affordability, can capture diverse demographics. Apple Pay’s tokenization launch in December 2024 highlights the market’s readiness for premium wallet experiences, albeit initially among affluent urban users.

By B2C Product Category: Food and Beverages Outpaces Electronics
Consumer electronics led with a 21.88% share of B2C sales in 2025, buoyed by smartphone and appliance demand. Food and beverages, however, is projected to grow at a 16.26% CAGR from 2026 to 2031, the fastest rate among categories in the Egypt e-commerce market. Quick-commerce dark stores in Cairo and Alexandria, including Talabat’s tMart, promise 20-minute grocery deliveries, raising purchase frequency and lowering return rates. Carrefour Egypt leverages its brick-and-mortar network for click-and-collect and home delivery, enhancing omnichannel convenience.
Fashion and apparel platforms exploit influencer marketing and localized capsules, while beauty and personal care ride rising disposable incomes and social-media tutorials. Furniture and home specialists, such as Homzmart, blend augmented-reality visualization with flexible payments to convert high-consideration shoppers. Niche segments (toys, DIY, media) may gain share as trust and product assortment grow, broadening consumer wallet capture in the Egypt e-commerce market.
Geography Analysis
Greater Cairo accounts for the largest share of transaction value, driven by dense smartphone penetration, robust courier networks, and higher disposable incomes. Alexandria and Giza follow, benefiting from overlapping logistics corridors that reduce fulfillment costs and enable same-day delivery promises. The Egypt e-commerce market size attributed to these three governorates is widening as platforms enlarge dark-store footprints and integrate real-time payment rails.
Tier-2 cities such as Mansoura, Tanta, and Port Said are emerging demand pools. Expanding 4G and 5G coverage is closing the connectivity gap, while government investments in logistics parks and industrial zones ease cross-border fulfillment into nearby African markets. Platforms that partner with local couriers or invest in proprietary fleets can tap pent-up demand among under-served populations, though fragmented addresses and lower order density inflate unit economics.
Rural Upper Egypt and Sinai remain nascent but promising frontiers. Mobile broadband is unlocking access, yet low courier density, infrastructure gaps, and trust concerns restrain growth. Government initiatives to digitize social-protection payments via mobile wallets could seed e-commerce adoption, provided platforms tailor cash-on-delivery hybrids and community pick-up models. As logistics networks mature, the Egypt e-commerce market share for outlying regions is expected to rise, diversifying revenue streams beyond core urban clusters.
Competitive Landscape
Competition is intensifying, but the market remains moderately fragmented. Amazon, Noon, and Jumia command brand recognition in urban areas but face rising pressure from vertical specialists and social-commerce entrants. Scale advantages in fulfillment, technology, and marketing bolster incumbents, yet nimble upstarts leverage influencer networks and hyper-local logistics to carve defensible niches. The August 2024 merger of MaxAB and Wasoko illustrates how aggregation across procurement, fintech, and logistics can unlock economies in the underserved B2B space.
Fulfillment investments are central to differentiation. Amazon’s 10th of Ramadan City expansion adds 100,000 cubic meters of storage capacity, while Noon’s USD 500 million funding fuels geographic push and IPO readiness. Embedded finance is another battleground; Fawry Business, launched February 2025, offers SMEs invoicing and payroll solutions that deepen retention. Category specialization also matters: Homzmart focuses on furniture and home, SHEIN on fast-fashion, and Talabat’s tMart on groceries, each deploying tailored supply chains and marketing playbooks.
Regulatory oversight is strengthening. The Consumer Protection Agency’s Regulated E-Commerce initiative certifies compliant platforms, raising trust yet increasing operational costs. FX-driven price volatility and fragmented last-mile networks create barriers that limit newcomer traction, but also present whitespace for logistics innovators. Social-commerce upstarts capitalize on TikTok and Instagram engagement, forcing traditional marketplaces to integrate shoppable video and creator storefronts to maintain relevance with mobile-native Gen-Z consumers.
Egypt E-commerce Industry Leaders
Amazon.com, Inc.
LC Waikiki
Watches Prime
Elaraby Group
Jumia Technologies AG
- *Disclaimer: Major Players sorted in no particular order

Recent Industry Developments
- December 2025: Amazon expanded its 10th of Ramadan City fulfillment center to 100,000 cubic meters of capacity.
- December 2025: Noon secured USD 500 million to fund expansion and technology upgrades ahead of a planned IPO within two years.
- May 2025: MaxAB acquired Fatura to bolster embedded-finance offerings for the 150,000 retailers on its platform.
- April 2025: SHEIN named actress Hannah El Zahed as brand ambassador and debuted a localized capsule collection.


Research Methodology Framework and Report Scope
Market Definitions and Key Coverage
Our study defines Egypt's e-commerce market as the gross merchandise value generated when Egyptian buyers place online orders via websites or mobile apps for physical goods or digitally delivered services under business-to-consumer (B2C) and business-to-business (B2B) models, regardless of settlement currency. Transactions fulfilled wholly offline after a digital order (for example, cash-on-delivery) are included because they still originate online.
Scope Exclusion: Informal consumer-to-consumer trades arranged on social media or classified portals without an electronic payment trail fall outside this analysis.
Segmentation Overview
- By Business Model
- B2C
- B2B
- By Device Type (B2C)
- Smartphone / Mobile
- Desktop and Laptop
- Other Device Types
- By Payment Method (B2C)
- Credit / Debit Cards
- Digital Wallets
- BNPL
- Other Payment Methods
- By Product Category (B2C)
- Beauty and Personal Care
- Consumer Electronics
- Fashion and Apparel
- Food and Beverages
- Furniture and Home
- Toys, DIY and Media
- Other Product Categories
Detailed Research Methodology and Data Validation
Primary Research
Mordor analysts interview online retailers, marketplace operators, last-mile specialists, payment processors, and sector regulators across Cairo, Alexandria, and emerging Tier-2 cities. These discussions validate shopper penetration, average basket values, cross-border share, and likely policy shifts, helping us close data gaps found in desk research.
Desk Research
We begin by compiling macro and sector data from open sources such as the Central Agency for Public Mobilization & Statistics, National Telecom Regulatory Authority, Central Bank of Egypt, UNCTAD, and International Trade Centre. Company filings, investor presentations, reputable local business dailies, and consumer surveys further refine category split assumptions. Access to D&B Hoovers and Dow Jones Factiva lets our analysts trace revenue trails and news flows of key merchants, gateways, and 3PLs. The sources listed illustrate the evidence base; many additional publications inform smaller model elements.
Market-Sizing & Forecasting
We reconstruct the 2024 baseline through a top-down transaction-value pool that starts with national digital payment volumes, augments them for cash-on-delivery ratios, and filters by domestic shipments. Selective bottom-up merchant roll-ups provide a reasonableness check. Key variables like active online shoppers, smartphone penetration, average order value, share of digital wallets, and inflation-adjusted ASPs feed a multivariate regression that projects demand to 2030. When granular B2B figures are scarce, we extrapolate from VAT filings and logistics tonnage, flagging confidence levels in our internal notes.
Data Validation & Update Cycle
Outputs pass a three-layer review: model versus economic indicator variance checks, peer analyst audits, and senior sign-off. We refresh every 12 months, with mid-cycle revisions triggered by material events such as policy changes or major platform entries, ensuring clients receive the most current view.
Why Mordor's Egypt E-commerce Baseline Earns Trust
Published estimates often diverge because each firm selects different transaction types, currency conversions, and refresh cadences.
Key gap drivers include whether B2B invoices are counted, how cash-on-delivery is grossed, and the frequency with which new platform launches are folded into models. Our approach, anchored to audited payment data, cross-checked with merchant interviews, and updated annually, minimizes such blind spots.
Benchmark comparison
| Market Size | Anonymized source | Primary gap driver |
|---|---|---|
| USD 10.24 bn | Mordor Intelligence | - |
| USD 9.10 bn | Global Consultancy A | Excludes B2B and travel services, narrower category slate |
| USD 10.20 bn | Industry Data Aggregator B | Uses GMV without adjusting for returns or failed COD deliveries |
| USD 9.05 bn | Regional Consultancy C | Applies 2020 FX rates and limited primary validation outside Cairo |
These comparisons show that, while figures cluster, the spread reflects scope and assumption choices. By transparently documenting variables, refreshing data promptly, and balancing top-down pools with bottom-up reality checks, Mordor Intelligence delivers a dependable baseline decision-makers can trace and, if required, replicate with the same publicly available evidence.


Key Questions Answered in the Report
How large is the Egypt e-commerce market in 2026?
The market is valued at USD 11.49 billion in 2026 and is forecast to grow at an 11.89% CAGR to 2031.
Which business model is growing fastest in Egypt's online commerce?
The B2B channel is projected to expand at a 15.37% CAGR through 2031 as platforms digitize wholesale procurement and financing.
What share of transactions come from smartphones?
Smartphones accounted for 72.48% of transaction value in 2025 and are on track to increase further with 5G roll-outs.
Which product category is expected to outpace others to 2031?
Food and beverages is forecast to post a 16.26% CAGR, buoyed by quick-commerce dark-store expansion in Cairo and Alexandria.
How is foreign-exchange volatility affecting online retailers?
The 40% devaluation of the Egyptian pound in 2024 raised import costs, pressuring margins for electronics and fashion sellers and prompting shifts toward local sourcing strategies.
Page last updated on:


