Accelerometer Market Size and Share
Market Overview
| Study Period | 2021 - 2031 |
|---|---|
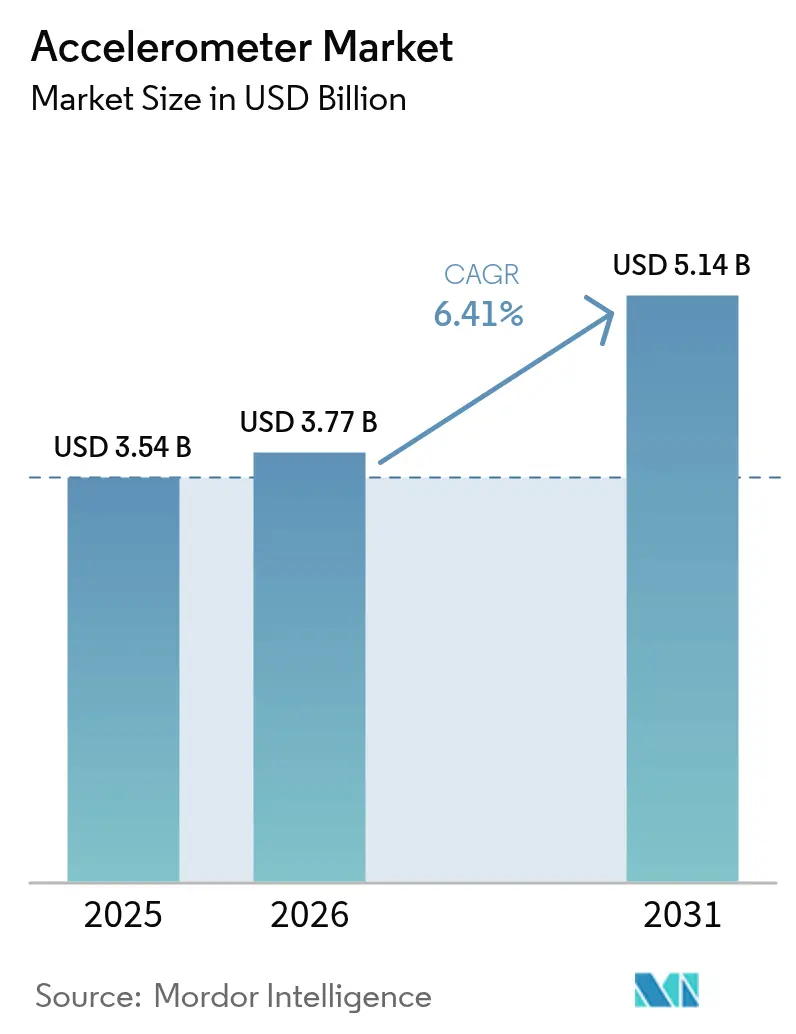
| Market Size (2026) | USD 3.77 Billion |
| Market Size (2031) | USD 5.14 Billion |
| Growth Rate (2026 - 2031) | 6.41% CAGR |
| Fastest Growing Market | Middle East and Africa |
| Largest Market | Asia Pacific |
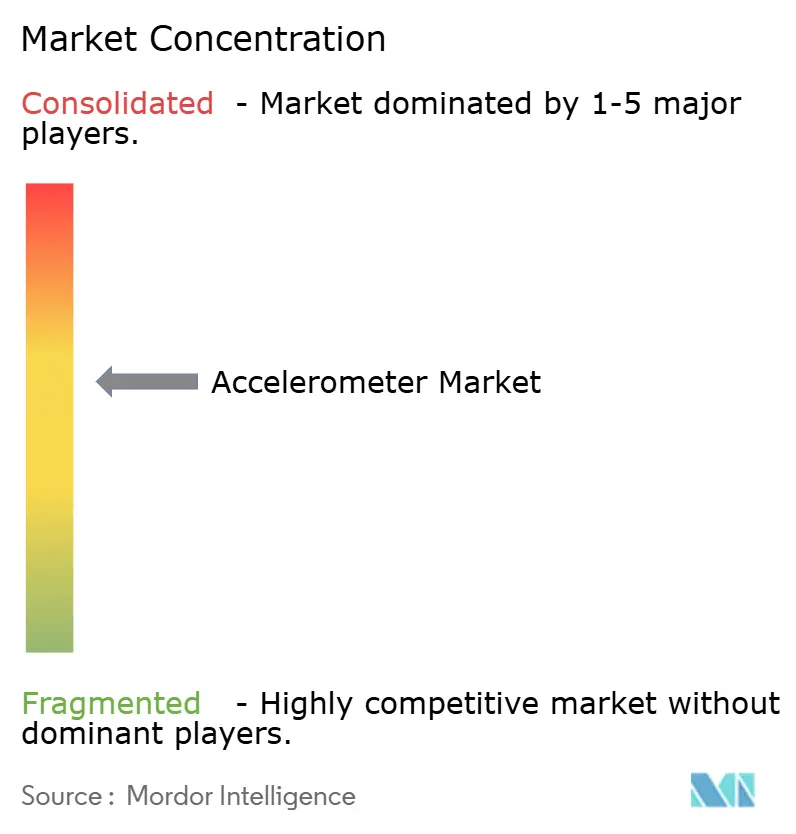
| Market Concentration | Medium |
Major Players
*Disclaimer: Major Players sorted in no particular order Image © Mordor Intelligence. Reuse requires attribution under CC BY 4.0. |
|
Accelerometer Market Analysis by Mordor Intelligence
The accelerometer market size is expected to grow from USD 3.54 billion in 2025 to USD 3.77 billion in 2026 and is forecast to reach USD 5.14 billion by 2031 at 6.41% CAGR over 2026-2031. Demand scales with the sensor’s increasingly critical role in consumer devices, automotive safety systems and industrial monitoring. Continuous MEMS miniaturization lowers system cost while enabling integration into space-constrained products, and AI-enhanced on-chip processing now lets accelerometers deliver real-time insights at the edge. Tier-1 automotive suppliers are embedding high-g variants in ADAS sensor-fusion suites, while precision-grade piezoelectric devices sustain differentiated value in aerospace and defense niches. Supply-side risks include lingering 8-inch MEMS wafer constraints and price compression in commoditized consumer segments, but design wins in healthcare wearables and renewable-energy infrastructure keep the overall growth outlook intact.
Key Report Takeaways
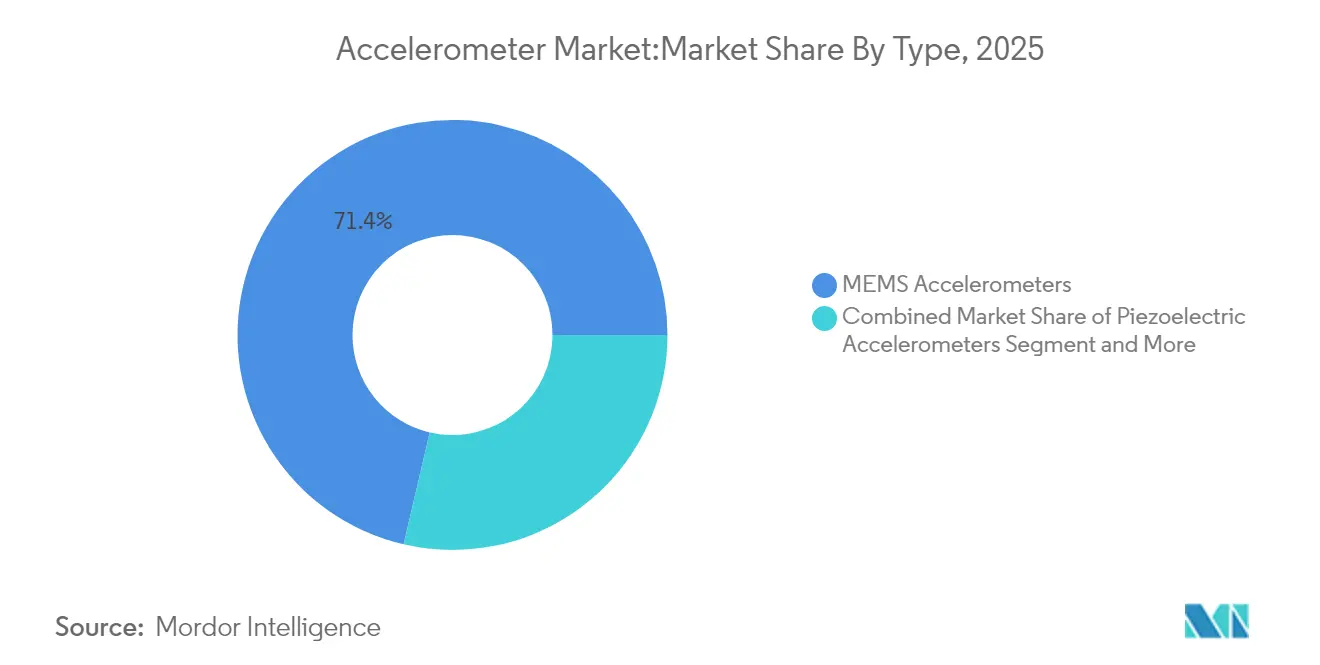
- By product type, MEMS devices held 71.35% of accelerometer market share in 2025, while piezoelectric designs are set to post the highest 7.42% CAGR through 2031.
- By dimension, 3-axis units led with 63.90% revenue share in 2025; 6-axis and higher combo IMUs are projected to expand at 8.05% CAGR to 2031.
- By end user, consumer electronics accounted for 37.20% of the accelerometer market size in 2025, whereas healthcare applications are advancing at an 8.21% CAGR to 2031.
- By performance grade, consumer-grade sensors captured 45.30% of 2025 revenue, yet navigation-grade components are forecast to grow the fastest at 8.46% CAGR.
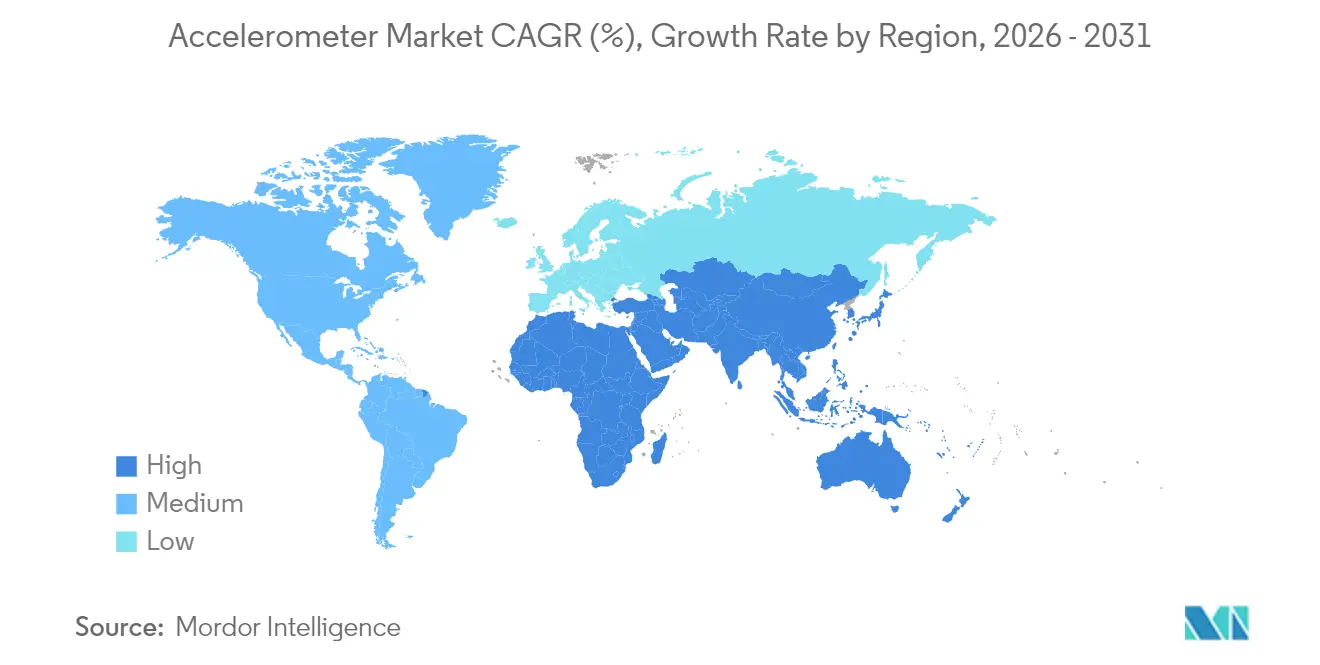
- By region, Asia-Pacific commanded 46.10% of global revenue in 2025; the Middle East & Africa region is on course for the strongest 8.33% CAGR through 2031.
Note: Market size and forecast figures in this report are generated using Mordor Intelligence’s proprietary estimation framework, updated with the latest available data and insights as of 2026.
Global Accelerometer Market Trends and Insights
Drivers Impact Analysis*
| Driver | ( ~ )% Impact on CAGR Forecast | Geographic Relevance | Impact Timeline |
|---|---|---|---|
| MEMS miniaturization and cost reduction | 1.80% | Global with APAC manufacturing concentration | Medium term (2-4 years) |
| Consumer electronics and wearables boom | 1.50% | Global, led by North America and APAC | Short term (≤ 2 years) |
| Automotive ADAS / safety integration | 1.20% | North America & Europe regulatory push, APAC production | Medium term (2-4 years) |
| Industry-4.0 condition monitoring uptake | 0.90% | Europe & North America, expanding to APAC | Long term (≥ 4 years) |
| Source: Mordor Intelligence | |||
MEMS Miniaturization and Cost Reduction
Third-generation MEMS processes now fabricate sub-millimeter proof-mass structures that cut die size and power draw without degrading noise density. Bosch’s miniature 2024 accelerometer series exemplifies how wafer-level chip-scale packaging lowers material cost while sustaining ±2 g to ±16 g dynamic range. [1]Andreas Schmid, “Accelerometers Overview,” Bosch Sensortec, bosch-sensortec.com Larger 300 mm MEMS fabs promise further scale economies, allowing OEMs to allocate tighter bill-of-materials budgets to additional sensing functions. STMicroelectronics’ LIS2DUXS12 integrates a machine-learning core enabling event classification at microwatt levels, removing the need for a companion MCU and shrinking board footprint. [2]Mouser Electronics, “STMicroelectronics LIS2DUXS12 Smart Accelerometer,” Mouser Electronics, mouser.com As foundries migrate to larger wafers, average selling prices decline and unlock latent demand in cost-sensitive IoT nodes, reinforcing the growth loop for the accelerometer market.
Consumer Electronics and Wearables Boom
Smartphones, earbuds and fitness trackers remain volume engines, but 2025 design roadmaps reveal an accelerating pivot toward medical-grade wearables that require sub-30 μg/√Hz noise floors and continuous operation for multi-day battery life. Analog Devices’ ADXL380 targets true-wireless earbuds with dual signal paths so a single sensor supports both active-noise-cancellation feedback and head-gesture recognition. In medical devices, AI-inference embedded in the sensor offloads cloud processing, enabling fall-detection wearables certified under IEC 60601-1 for hospital use. Higher-value clinical applications ease margin pressure and expand the accelerometer market into regulated healthcare channels that favor quality over lowest price.
Automotive ADAS / Safety Integration
Crash detection is now table stakes; 2025 vehicle platforms incorporate multi-axis accelerometer clusters to monitor chassis vibration and infer road profile in real time. Upcoming UNECE R157 phases mandate Level 3 automated-lane keeping in Europe, boosting demand for redundant inertial data streams that enhance camera-radar fusion accuracy. Knowles’ V2S200D exploits body-panel vibrations to localize emergency-vehicle sirens, offering a solid-state alternative to membrane microphones for exterior sound sensing. Tier-1 suppliers are standardizing digital SPI interfaces with self-diagnostic bit-error checks, folding cybersecurity and functional-safety requirements into next-generation accelerometer specifications. These upgrades reinforce the accelerometer market’s position in safety-critical automotive architectures.
Industry-4.0 Condition Monitoring Uptake
Vibration-based predictive maintenance cuts unplanned outage costs that exceed USD 50 billion annually in heavy industry. PCB Piezotronics’ new low-noise triaxial models deliver 60 μg/√Hz performance, enabling early fault detection in gearboxes and turbines. Edge AI routines running on PSoC-6 microcontrollers now process FFT spectra locally, reducing data sent over constrained LPWAN links and containing operating costs. Waste-heat energy-harvesting modules extend sensor lifetimes beyond 10 years, permitting deployment in ATEX-classified zones where battery replacement is impractical. The resulting ROI accelerates adoption, enlarging the industrial slice of the accelerometer market.
Restraints Impact Analysis*
| Restraint | ( ~ )% Impact on CAGR Forecast | Geographic Relevance | Impact Timeline |
|---|---|---|---|
| Price pressure & commoditization | −1.1% | Global, most acute in consumer devices | Short term (≤ 2 years) |
| Accuracy limits vs. piezoelectric high-g | −0.6% | Worldwide aerospace & defense demand | Medium term (2-4 years) |
| Source: Mordor Intelligence | |||
Price Pressure and Commoditization
In smartphones the bill-of-materials allotment for inertial sensing shrank by nearly 30% between 2022 and 2024, pushing suppliers to differentiate with embedded ML cores and lower power-suspend modes. Kionix’s KX224 series sells below USD 0.30 at million-piece volumes, underscoring deteriorating average selling prices for legacy parts. Vendors invest in automated calibration to recoup margin; however, factory-trim routines raise capex and erode benefit. The imbalance confines many competitors to break-even PandL positions, tempering near-term revenue expansion for the accelerometer market.
Accuracy Limits vs. Piezoelectric High-G
MEMS capacitive structures struggle to maintain linearity beyond ±200 g, whereas piezoelectric stacks preserve accuracy beyond ±5,000 g, a necessity for missile guidance and spacecraft vibration testing. Defense primes therefore continue sourcing piezoelectric or quartz-flexure assemblies despite higher part cost. Research at the University of Colorado Boulder showed atom-interferometer prototypes that outperform both MEMS and piezoelectric solutions, hinting at a potential technology leap over the next decade. [3]Strain D., “Quantum Navigation Device Measures Acceleration in 3D,” Phys.org, phys.org This ceiling limits MEMS penetration in ultra-high-performance niches and caps pricing power in the premium band of the accelerometer market.
*Our forecasts treat driver/restraint impacts as directional, not additive. The impact forecasts reflect baseline growth, mix effects, and variable interactions.
Segment Analysis
By Type: MEMS Dominance Faces Precision Challenges
MEMS devices captured 71.35% accelerometer market share in 2025 owing to unmatched cost-performance balance. Volume manufacturing on 200 mm wafers combined with wafer-level packaging positions MEMS at the heart of smartphones, wearables and automotive ECUs. Piezoelectric units, while representing a smaller base, advance at 7.42% annually as defense and aerospace operators demand sub-1 µg bias stability and radiation tolerance. Piezoresistive and capacitive variants serve niche industrial uses where shock survivability or ultra-low power trumps absolute precision.
MEMS leadership rests on integration advantages. STMicroelectronics’ sensor-hub architecture merges a digital machine-learning core and FIFO buffers directly on the die, trimming external component count. Still, when g-range, temperature extremes or bias stability exceed MEMS limits, designers revert to piezoelectric stacks.


By Dimension: Multi-Axis Integration Drives Complexity
The trend toward full-six-degree-of-freedom measurement places 3-axis accelerometers at 63.90% revenue share in 2025. OEMs prefer unified X-Y-Z readings to support gesture recognition and vibration diagnostics with minimal sensor fusion overhead. Meanwhile, combo IMUs embedding 6-axis or 9-axis capability demonstrate an 8.05% growth trajectory, driven by drones, AR/VR headsets and robotics, where synchronized gyro-accelerometer data simplifies algorithm tuning. Single-axis devices persist in tilt switches and automotive airbag triggers, but share steadily erodes.
Collins Aerospace’s SiIMU02 illustrates the premium end of multi-axis integration, achieving near-fiber-optic gyro accuracy in a palm-sized MEMS assembly. For mid-tier consumer products, suppliers consolidate accelerometer, gyroscope and sometimes magnetometer on a single ASIC with programmable digital filters. This convergence compresses PCB area and bill-of-materials cost, ensuring the accelerometer market maintains momentum as application complexity rises.
By End User: Healthcare Emerges as Growth Engine
Consumer electronics retained 37.20% of global revenue in 2025; yet price erosion caps segmental growth at a mid-single-digit pace. Conversely, healthcare deployments deliver the highest 8.21% CAGR as hospitals adopt motion-analysis wearables for post-operative mobility tracking and sleep-stage monitoring. Inertial Labs’ tactical-grade IMU, originally designed for defense, now appears in robotic-surgery arms, underscoring cross-industry technology migration. Industrial end users embed accelerometers in motors and pumps to flag early vibration anomalies, validating ROI for predictive maintenance installations and elevating sensor ASPs.
Regulatory emphasis on remote patient monitoring and reimbursement for tele-health fosters sustained purchasing of high-accuracy, medically certified devices. Suppliers bundling secure firmware update support and IEC 62304 compliance stand to capture premium margins as clinical use cases scale.

By Performance Grade: Navigation Precision Commands Premium
Consumer grade sensors dominate unit volumes at 45.30% 2025 share, but revenue gravitas shifts toward navigation-grade and above, where ASPs are an order of magnitude higher. The accelerometer market share for navigation-grade products is expected to rise to 18.45% by 2031 as autonomous driving and precision-agriculture fleets specify <50 µg bias stability levels. Inertial Labs delivers 1 deg/hr gyro bias within a MEMS pack, narrowing a gap traditionally held by fiber-optic gyros. Space-grade parts remain a specialist pocket: Northrop Grumman’s LR-500 QMG IMU targets small-satellite constellations with ±0.05 deg/hr class drift, but quantities remain limited.
Tier-2 automakers gradually migrate from consumer to industrial-grade accelerometers as over-the-air software updates require tighter performance margins across the vehicle lifetime. This up-spec trend inflates blended ASP even where unit growth moderates, supporting the accelerometer market’s value expansion.
Geography Analysis
Asia-Pacific controlled 46.10% of global revenue in 2025, anchored by China’s consumer-electronics export base and a dense 8-inch MEMS foundry footprint. Shenzhen-headquartered MEMSIC recorded triple-digit growth after focusing capacitor-type accelerometers on domestic smartphone OEMs. Japan and South Korea contribute high-reliability variants for automotive and industrial sectors, while Taiwan’s pure-play foundries support contract manufacturing. The region’s accelerometer market will expand at a steady 6.08% CAGR, although wafer-capacity constraints and rising labor costs temper upside.
The Middle East and Africa represents the fastest 8.33% CAGR through 2031 as Saudi Arabia’s Vision 2030 stimulus funds local semiconductor initiatives and scales renewable-energy assets requiring turbine vibration monitoring. Wind farms across Egypt and Morocco adopt triaxial accelerometers to meet ISO 10816 predictive-maintenance benchmarks. Regional public-private partnerships with European sensor makers expedite technology transfer, accelerating indigenous production and lifting the local accelerometer market trajectory.
North America holds a strong second position driven by automotive ADAS mandates and an advanced industrial IoT install base. Adoption of Industry-4.0 maintenance strategies across oil and gas, chemicals and metals drives demand for rugged, hazardous-area-rated accelerometers. Europe trails marginally yet enjoys higher average selling prices as OEMs prioritize quality and functional safety. EU funding for Horizon Europe robotics projects further stimulates precision-grade sensor uptake, reinforcing regional participation in the accelerometer market.

Competitive Landscape
Competition is moderate, with the top five suppliers controlling an estimated 58% of 2024 revenue. Analog Devices, Bosch and STMicroelectronics leverage in-house MEMS fabs and deep system-integration know-how to secure multi-year supply agreements with smartphone and automotive OEMs. Bosch pushes a platform strategy, sharing common ASIC cores across pressure, gyro and accelerometer families to spread RandD spend. STMicroelectronics differentiates via embedded machine-learning cores that shorten customers’ time-to-AI deployment. Analog Devices emphasizes ultra-low noise density and radiation-hardened variants for aerospace orbiters.
Specialists pursue vertical niches. PCB Piezotronics extends piezoelectric lines into differential-output models for aero-engine testing. Inertial Labs packages tactical-grade MEMS IMUs for defense unmanned platforms, capturing share where size-weight-power trump fiber-optic performance. Disruptive contenders in quantum sensing, often university spin-outs, targeting sub-nano-g resolution, threaten long-term incumbent positions though commercial readiness remains distant. Overall, product roadmaps converge on embedded intelligence, cybersecurity hardening and self-calibration—capabilities likely to re-order leadership standings as the accelerometer market matures.
Accelerometer Industry Leaders
-
Analog Devices Inc.
-
Robert Bosch GmbH
-
STMicroelectronics
-
TDK InvenSense
-
Honeywell International Inc.
- *Disclaimer: Major Players sorted in no particular order

Recent Industry Developments
- June 2025: University of Colorado Boulder unveiled a quantum navigation prototype using atom-interferometry to capture three-axis acceleration with drift-free precision, positioning the technology as a future alternative to MEMS.
- May 2025: Inertial Labs released a tactical-grade MEMS IMU featuring 1 deg/hr gyro bias, aiming to displace fiber-optic gyros in cost-sensitive defense programs.
- April 2025: Northrop Grumman introduced the LR-500 QMG IMU delivering <1 deg/hr performance for space and tactical platforms, reinforcing its high-reliability sensor portfolio.
- April 2025: PCB Piezotronics launched low-noise differential-output triaxial accelerometers, expanding industrial vibration-analysis offerings.


Research Methodology Framework and Report Scope
Market Definitions and Key Coverage
Our study defines the global accelerometers market as all newly manufactured sensors whose primary function is to detect linear acceleration or vibration and deliver an electrical output, irrespective of axis count, grade, or packaging technology.
Scope exclusion: Modules that integrate gyroscopes or magnetometers as their dominant element are outside the measured value and treated separately.
Segmentation Overview
-
By Type
- MEMS Accelerometers
- Piezoelectric Accelerometers
- Piezoresistive Accelerometers
- Capacitive Accelerometers
- Thermal and Other Types
-
By Dimension
- 1-Axis
- 2-Axis
- 3-Axis
- 6-Axis and Above (Combo IMUs)
-
By End User
- Consumer Electronics
- Automotive
- Aerospace and Defense
- Industrial and Manufacturing
- Healthcare and Medical Devices
- Other End Users
-
By Performance Grade
- Consumer Grade
- Industrial Grade
- Tactical Grade
- Navigation Grade
- Space Grade
-
By Geography
-
North America
- United States
- Canada
- Mexico
-
South America
- Brazil
- Argentina
- Rest of South America
-
Europe
- Germany
- United Kingdom
- France
- Italy
- Spain
- Russia
- Rest of Europe
-
APAC
- China
- Japan
- India
- South Korea
- Taiwan
- Southeast Asia
- Rest of APAC
-
Middle East and Africa
-
Middle East
- Saudi Arabia
- United Arab Emirates
- Turkey
- Rest of Middle East
-
Africa
- South Africa
- Nigeria
- Rest of Africa
-
Middle East
-
North America
Detailed Research Methodology and Data Validation
Primary Research
Mordor analysts interviewed MEMS design engineers in North America, automotive safety module integrators in Europe, and avionics program managers across Asia-Pacific to validate secondary numbers, sense-check bill-of-materials pricing, and refine regional adoption curves. Follow-up surveys with wearable-device product managers confirmed penetration assumptions in consumer electronics.
Desk Research
We began with openly available datasets from entities such as the International Organization of Motor Vehicle Manufacturers (OICA) for annual vehicle output, the Semiconductor Industry Association for MEMS wafer capacity, and the Stockholm International Peace Research Institute for defense procurement trends. Complementary insight flowed from IEEE Xplore articles on piezoelectric sensor efficiencies, United States Patent & Trademark Office filings that map design wins, and customs shipment data retrieved through Volza. Our team also checked company 10-K filings and investor decks to anchor average selling prices and end-use splits.
Subscription repositories in Mordor's toolkit, notably D&B Hoovers for supplier revenue splits and Dow Jones Factiva for sensor contract news, filled many residual gaps. The sources named are illustrative; numerous other public and proprietary references were reviewed before values were finalized.
Market-Sizing & Forecasting
A top-down construct starts with production pools, smartphone shipments, passenger-car builds, civil aircraft deliveries, and industrial robot installs, which are then mapped to typical accelerometer fit rates by axis and grade. Supplier roll-ups and channel checks supply a selective bottom-up mirror that lets us resize or re-price segments when obvious gaps surface. Key model drivers include MEMS wafer starts, average g-range demanded per application, ASP erosion from 200 mm to 300 mm wafer migration, defense capital outlay, and regional consumer-device refresh cycles. We forecast each driver through multivariate regression blended with ARIMA pattern recognition, before scenario testing the outputs with our primary research panel. Where bottom-up evidence is thin, gap factors derived from analog sensor categories are applied and transparently logged.
Data Validation & Update Cycle
Model outputs pass three layers of variance checks, peer review, and leadership sign-off. We refresh the file every twelve months, yet any material event, plant shutdown, trade sanction, or landmark design win triggers an interim revision, ensuring clients receive the most current baseline.
Why Mordor's Accelerometers Baseline Commands Reliability
Published estimates diverge because firms choose different coverage rules, pricing ladders, and refresh cadences; users often struggle to reconcile the spread.
Key gap drivers typically trace back to whether combo IMUs are included, how aggressively future ASP compression is baked in, and the vintage of the underlying production statistics that anchor the first forecast year.
Benchmark comparison
| Market Size | Anonymized source | Primary gap driver |
|---|---|---|
| USD 3.54 B | Mordor Intelligence | - |
| USD 7.92 B | Global Consultancy A | Bundles IMUs and gyroscopes, applies single-digit ASP decline |
| USD 3.68 B | Industry Association B | Uses calendar-year 2024 production as base, no smartphone re-forecast after tariff changes |
| USD 3.63 B | Trade Journal C | Relies on shipment data only, omits aftermarket sensor replacements |
External figures range from USD 3.63 billion to USD 7.92 billion for 2025, yet our disciplined scope, dual-path modeling, and annual refresh cadence deliver a balanced, transparent baseline that decision-makers can trace back to clear variables and repeatable steps.


Key Questions Answered in the Report
What is the current size of the accelerometer market?
The accelerometer market stands at USD 3.77 billion in 2026 and is projected to reach USD 5.14 billion by 2031.
Which accelerometer technology type dominates global revenue?
MEMS accelerometers lead with 71.35% 2025 market share thanks to cost-effective high-volume manufacturing.
Which end-user segment is growing the fastest?
Healthcare applications are expanding at an 8.21% CAGR as medical wearables adopt high-precision motion tracking.
Why are piezoelectric accelerometers still relevant?
They deliver superior accuracy beyond ±1,000 g and excel in aerospace and defense environments where MEMS devices face performance limits.
What geographic region shows the strongest growth outlook?
The Middle East and Africa is forecast to grow at 8.33% CAGR through 2031, supported by semiconductor initiatives and renewable-energy projects.
How are suppliers differentiating in a price-pressured environment?
Leading vendors embed on-sensor machine-learning cores, improve power efficiency and integrate self-diagnostics to sustain margins and win design slots.
Page last updated on:


