
Wearable Motion Sensors Market Size and Share
Market Overview
| Study Period | 2020 - 2031 |
|---|---|
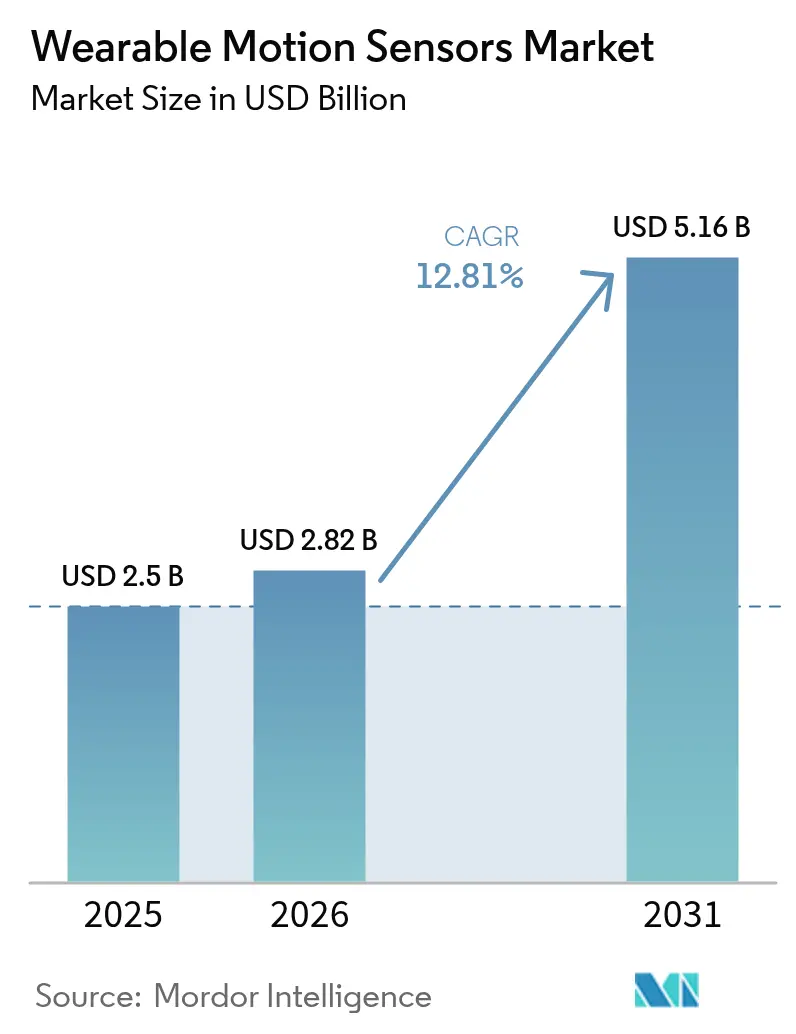
| Market Size (2026) | USD 2.82 Billion |
| Market Size (2031) | USD 5.16 Billion |
| Growth Rate (2026 - 2031) | 12.81 % |
| Fastest Growing Market | Asia Pacific |
| Largest Market | North America |
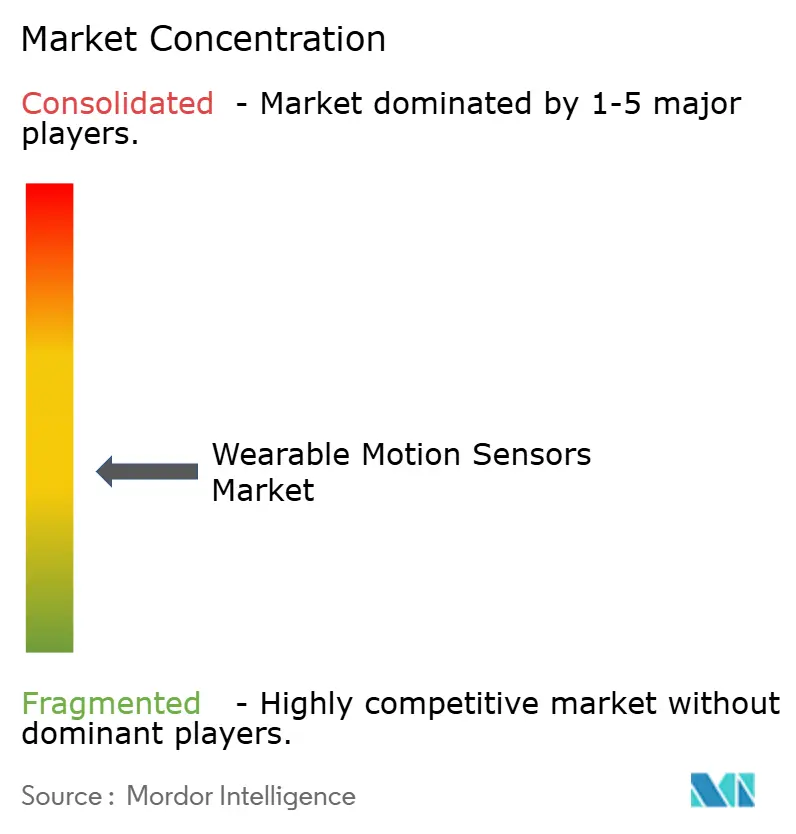
| Market Concentration | Medium |
Major Players *Disclaimer: Major Players sorted in no particular order Image © Mordor Intelligence. Reuse requires attribution under CC BY 4.0. | |
Wearable Motion Sensors Market Analysis by Mordor Intelligence
wearable motion sensors market size in 2026 is estimated at USD 2.82 billion, growing from 2025 value of USD 2.5 billion with 2031 projections showing USD 5.16 billion, growing at 12.81% CAGR over 2026-2031. Expanding adoption across healthcare, consumer electronics, industrial safety and defense sustains this trajectory, while breakthroughs in miniaturization and on-device signal processing convert once-discrete components into indispensable enablers of connected products. Demand is reinforced by regulatory support for remote patient monitoring, rising health-conscious consumer behavior, and the shift toward seamless human–machine interfaces that rely on precise real-time motion data. Market leaders emphasize sensor fusion, ultra-low-power design and edge AI to differentiate, whereas emerging players target niche opportunities such as smart textiles and soldier modernisation. Supply-side constraints in MEMS manufacturing and growing compliance costs tied to data sovereignty remain the most visible bottlenecks for timely capacity fulfilment.
Key Report Takeaways
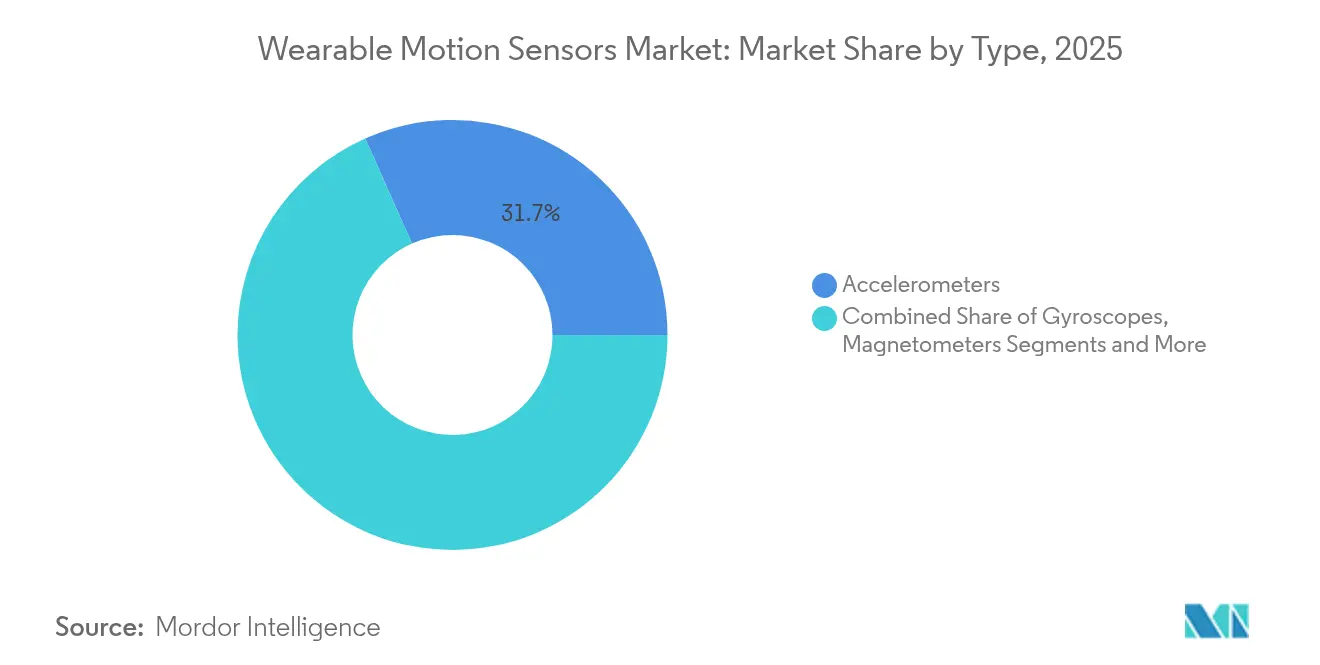
- By type, accelerometers led with 31.65% of the wearable motion sensors market share in 2025, while MEMS combo sensors post the highest 14.12% CAGR through 2031.
- By application, fitness bands accounted for 23.35% share of the wearable motion sensors market size in 2025; smart clothing advances at a 14.37% CAGR to 2031.
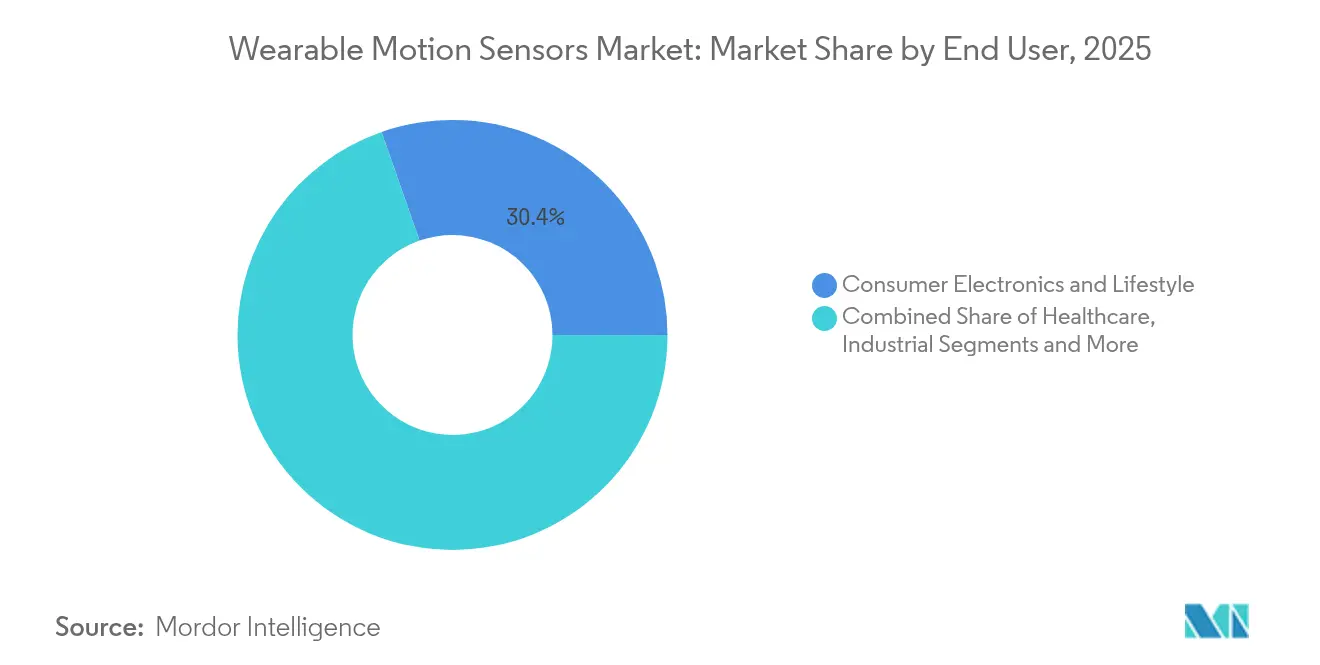
- By end-user industry, consumer electronics & lifestyle held 30.35% of the wearable motion sensors market in 2025, and is expected to expand at a 14.58% CAGR to 2031.
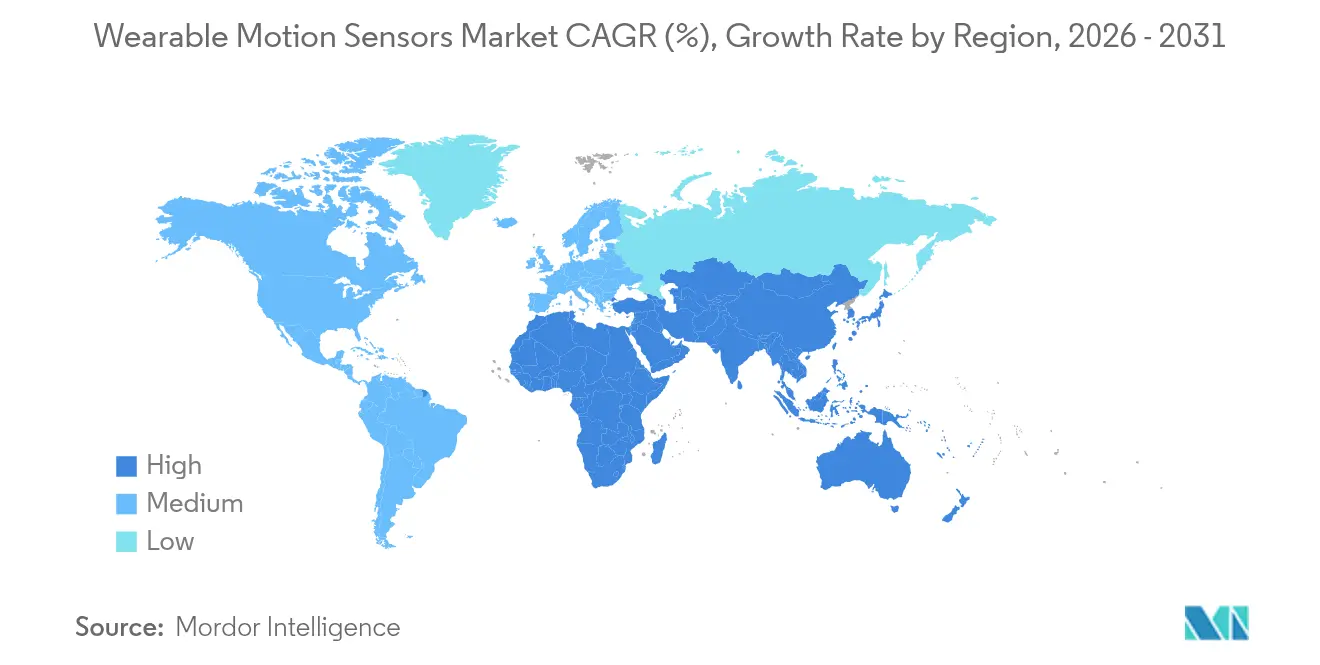
- By geography, North America commanded 42.15% revenue share in 2025, whereas Asia Pacific is projected to grow fastest at 16.32% between 2026 and 2031.
Note: Market size and forecast figures in this report are generated using Mordor Intelligence’s proprietary estimation framework, updated with the latest available data and insights as of 2026.
Market Trends and Insights
Drivers Impact Analysis of Wearable Motion Sensors Market*
| DRIVER | (~) % IMPACT ON CAGR FORECAST | GEOGRAPHIC RELEVANCE | IMPACT TIMELINE |
|---|---|---|---|
| AI-enabled sensor fusion driving medical-grade wearables | +2.8% | Global, early in North America | Medium term (2-4 years) |
| Sub-milliwatt MEMS for eldercare in Japan & Korea | +1.5% | Japan, South Korea, spillover China | Medium term (2-4 years) |
| U.S. RPM reimbursement boost | +2.1% | United States | Short term (≤ 2 years) |
| EU Digital Product Passport-linked usage analytics | +1.2% | European Union | Medium term (2-4 years) |
| Micro energy-harvesting modules in China | +1.7% | China, spillover Asia Pacific | Medium term (2-4 years) |
| NATO soldier modernisation demand | +1.1% | North America, Europe | Long term (≥ 4 years) |
| Source: Mordor Intelligence | |||
AI-enabled Sensor Fusion Driving Medical-Grade Wearables
Integrating on-sensor AI with multi-axis inertial data is converting consumer devices into clinical-grade monitors, enabling reliable detection of subtle gait or tremor changes linked to Parkinson’s and other neuro-motor disorders. Studies report 84% accuracy in differentiating early Parkinson’s tremor from essential tremor, an achievement that expands home-based, continuous care models and reduces reliance on episodic clinical evaluations. Growing payer acceptance of algorithm-supported diagnostics accelerates hospital adoption, while consumer brands add medical features to retain users within ecosystem subscriptions.[1]D. Perera et al., “AI-Enhanced IMU Classification of Parkinsonian Tremor,” frontiersin.org
Sub-milliwatt MEMS for Eldercare in Japan & Korea
Sensors consuming below 1 mW allow multi-week operation without charging, a prerequisite for elderly users who may forget to maintain devices. Japan’s national long-term care system saw 23% fewer hospitalisations when such sensors enabled automatic fall alerts and daily activity profiling. Korean public-private pilots demonstrate similar savings, encouraging scale-up across community health networks and driving regional demand spillover into China’s ageing-at-home initiatives.
U.S. RPM Reimbursement Boost
New CPT codes effective January 2026 pay clinicians for remote patient monitoring hardware and daily reviews, transforming economic incentives for continuous motion tracking in post-acute rehabilitation and fall prevention. The American Medical Association’s code-set expansion, coupled with CMS goals for value-based care penetration, lowers procurement risk for hospitals that deploy sensor-equipped wearables. Vendor pipelines now prioritise FDA-cleared motion algorithms to meet audit requirements.
EU Digital Product Passport-Linked Usage Analytics
From July 2024, every smart wearable entering the EU must carry a digital identifier linking to origin, material composition and repair information. Progressive manufacturers upload anonymised usage statistics to the same portal, leveraging compliance infrastructure to refine product design, battery management and predictive maintenance strategies. Premium buyers reward brands that prove longevity and sustainability, nudging the market toward data-rich lifecycle services.
Restraints Impact Analysis of Wearable Motion Sensors Market*
| RESTRAINTS | (~) % IMPACT ON CAGR FORECAST | GEOGRAPHIC RELEVANCE | IMPACT TIMELINE |
|---|---|---|---|
| Algorithmic limits on tremor differentiation | -1.2% | Global, higher in North America & Europe | Medium term (2-4 years) |
| MEMS foundry capacity crunch | -1.8% | Global, peak Asia Pacific | Short term (≤ 2 years) |
| Data-sovereignty compliance costs | -1.4% | EU, North America | Medium term (2-4 years) |
| Smart-textile interconnect failures | -1.0% | Global | Short term (≤ 2 years) |
| Source: Mordor Intelligence | |||
Algorithmic Limits on Tremor Differentiation
Current unsupervised models reach only 57.1% accuracy in multi-class tremor severity classification, well below clinical thresholds, limiting reimbursement for neurological wearables. Small, diverse data sets and noisy real-world environments hinder progress, slowing hospital uptake despite promising research prototypes.[2]R. Patel, “Accuracy Limits in Tremor Classification,” mdpi.com
MEMS Foundry Capacity Crunch
Automotive ADAS, 5G handsets and IoT modules collectively outpace the 15% yearly wafer expansion at leading MEMS fabs, leaving a 7% shortfall for wearables. Brands without captive facilities face bid-up prices or allocation cuts as vertically integrated suppliers like Bosch prioritise in-house demand.
*Our forecasts treat driver/restraint impacts as directional, not additive. The impact forecasts reflect baseline growth, mix effects, and variable interactions.
Wearable Motion Sensors Market Segment Analysis
By Type:
MEMS Combo Sensors Redefine Power–Performance ParadigmThe wearable motion sensors market saw accelerometers retain 31.65% share in 2025, underpinning activity trackers, gesture interfaces and basic fall detection. That dominance reflects mature cost curves and micro-amp sleep currents. In contrast, MEMS combo sensors post a 14.12% CAGR by fusing accelerometer, gyroscope and magnetometer functions within a single ASIC that off-loads board-level integration. STMicroelectronics’ LSM6DSV16BX, for instance, embeds a 6-axis IMU plus an audio accelerometer for bone-conduction-based commands in hearables. Combo adoption narrows the performance gap with discrete IMUs while lowering power draw, ideal for tiny rings and medical patches.
Gyroscopes support sub-degree orientation fidelity in AR/VR headsets and advanced biomechanics analysis yet carry higher milliwatt budgets, so vendors pair duty-cycled modes with predictive algorithms to stretch per-charge runtime. Magnetometers deliver absolute heading, essential for outdoor sports watches navigating GPS multipath. Pressure sensors, a smaller but vital niche, calibrate altitude change for stair-climb counting and swimming lap depth. Forward-looking roadmaps integrate bio-potential or chemical channels alongside motion axes, signalling a future where inertial and physiological data converge inside unified sensor nodes, further strengthening the wearable motion sensors market.



By Application:
Smart Clothing Weaves Sensing into Everyday WearFitness bands led 23.35% of application revenues in 2025, benefiting from established brand ecosystems, low entry price and cross-selling of subscription analytics. However, textile-embedded sensor threads shift monitoring from gadget to garment, supporting a 14.37% CAGR through 2031. Conductive yarns and printed stretch sensors enable shirts that track joint kinematics, posture and respiratory rates during daily routines, freeing users from dedicated devices.
AR/VR headsets remain a high-growth enclave, demanding sub-millisecond latency orientation updates for immersive simulation. Ear-wear integrates head-gesture sensing for hands-free calls, while smart rings deliver sleep staging in tiny form factors. The convergence of motion and electrochemical sensing within fabrics widens health dashboards to hydration, electrolyte loss and thermal stress parameters, underscoring how seamless experiences keep the wearable motion sensors market expanding beyond novelty phases.
By End-user Industry:
Consumer Electronics Drives Volume, Healthcare Demands PrecisionConsumer electronics & lifestyle captured 30.35% revenue in 2025 and will compound at 14.58% through 2031 as mainstream brands integrate fall detection and basic ECG into watches, lowering barriers to preventative health engagement. Gamified dashboards, wellness challenges and insurer incentives extend replacement cycles, solidifying the wearable motion sensors market foundation.
Healthcare & medical devices deliver higher margins but demand rigorous ISO13485 controls and FDA validation. Rehabilitation clinics deploy inertial modules on knees and hips to score gait recovery, while cardiology groups pilot arrhythmia prediction from combined motion and optical signals. Industrial safety kits rely on rugged IMUs for slip detection and man-down alerts, whereas soldier systems layer over-the-air encryption and high-g tolerance ratings. Technology cross-pollination among these domains accelerates features migration, reinforcing the competitive yet symbiotic ecosystem that underpins the wearable motion sensors industry.
By Power Consumption:
Ultra-Low Power Catalyses Continuous MonitoringUltra-low-power devices below 1 mW form the fastest-growing slice, enabling multi-week unattended deployment on disposable batteries or energy harvesters. Japan’s eldercare pilots prove that sensors drawing 0.9 mW extend patch wear time to 21 days, raising data continuity and clinical insight. Low-power units (1–10 mW) occupy mass-market wearables such as sports watches where daily charging is acceptable, balancing sample rate and battery size.
Standard-power sensors (10–50 mW) dominate AR/VR controllers and enterprise safety helmets that off-load energy to swappable battery packs. High-power modules above 50 mW, typically integrating radar or active haptic feedback, cater to specialized training rigs and defense wearables but face scrutiny for thermal output. A progressive shift down the power ladder is evident as fabs migrate to 0.8-µm piezo-MEMS and on-chip deep-sleep orchestrators. Energy autonomy remains a differentiator, strengthening brand claims of sustainability and reinforcing growth prospects for the wearable motion sensors market size attached to sub-milliwatt categories.
Geography Analysis
North America Wearable Motion Sensors Market
North America generated 42.15% of 2025 revenue, anchored by Medicare reimbursement reform that locks remote motion monitoring into mainstream care pathways. The region’s venture ecosystem funnels capital into edge-AI silicon, while privacy statutes push vendors toward on-device inference, preserving user trust. Supply constraints are mitigated by near-shoring policies and Defense Production Act incentives that favour domestic MEMS lines.
APAC Wearable Motion Sensors Market
Asia Pacific registers the fastest 16.32% CAGR through 2031, reflecting China’s tier-2 fabs embracing energy-harvesting architectures and Korea’s smart-city pilots embedding motion tags in elder apartments. Government grants offset initial higher BOM costs, while consumer appetite for feature-rich wearables remains unabated. Japan’s insurers reimburse smart-shirt-based risk scoring for seniors, spurring textile sensor investment.
Europe Wearable Motion Sensors Market
Europe maintains methodical expansion, its Digital Product Passport mandate pushing life-cycle transparency and fostering premium after-sales analytics. GDPR compliance elevates spend on secure edge firmware and sovereign cloud bridges.
LATAM and MEA Wearable Motion Sensors Market
Latin America and the Middle East & Africa trail in volumes yet notch double-digit growth where urban private hospitals adopt fall-detection watches. Cross-border e-commerce and multinational OEM assembly lines stitch regions into a globally interdependent wearable motion sensors market.

Regulatory Landscape
Wearable motion sensors used in healthcare and medical-device pathways must meet device and software requirements, with the US Food and Drug Administration (FDA) serving as a key gatekeeper for products that move beyond wellness claims. In January 2026, the FDA finalized updated guidance for General Wellness: Policy for Low Risk Devices, clarifying enforcement discretion for certain non-invasive wearable sensors when positioned for wellness use rather than diagnosis or treatment, which affects go-to-market labeling and feature-locking strategies for consumer OEMs.
Quality and software lifecycle compliance also influence supplier selection and documentation practices across the market. The FDA Quality Management System Regulation (QMSR) became effective in February 2026 and incorporates ISO 13485:2016 by reference, strengthening alignment with common international quality expectations for medical-grade wearables and their motion-sensing subsystems. Standards such as IEC 62304 remain central for software-based medical-device development and validation when motion algorithms are part of regulated functionality.
Value Chain Analysis
The wearable motion sensors value chain begins with upstream materials and components (silicon wafers, MEMS process materials, and in some end devices rare earth magnets used in haptics assemblies), then moves into MEMS design and fabrication, which is often concentrated in East Asian foundry clusters. From there, packaging, calibration, and module integration with MCUs or ASICs and firmware translate components into application-ready subsystems.
Midstream suppliers (for example, STMicroelectronics, Bosch Sensortec, TDK InvenSense, and Analog Devices) provide accelerometers, gyroscopes, IMUs, and combo sensors to wearable OEMs and ODM/EMS partners, where sensor fusion stacks and power-management tuning add system-level capability. Downstream value capture is increasingly tied to integration and data workflows, including device OEM platforms, clinical or enterprise software, and telemetry ingestion into existing operational systems, such as deployments that connect worker-wearable motion signals into warehouse or logistics execution platforms like SAP EWM. The chain remains exposed to bottlenecks highlighted in the report context, including MEMS foundry capacity constraints and single-source dependencies for certain packages, and it also carries adjacent supply risk such as China export restrictions on rare earth magnets reported in June 2025, which can ripple into smartwatch and TWS device builds via haptics and actuation component availability.
Competitive Landscape
The top five suppliers account for roughly 55–60% of unit shipments, rendering the field moderately concentrated. STMicroelectronics, Bosch Sensortec, TDK InvenSense, Analog Devices and NXP scale through captive fabs and broad portfolios, but face agile specialists exploiting underserved niches. Tech differentiation centres on embedded MCU cores, sensor fusion IP and wafer-level 3-D packaging that slashes z-height for jewelry formats.
Patent races intensify: STMicroelectronics alone lists over 18,000 active filings with MEMS claims in machine-learning-the-edge use cases. Concurrently, consumer OEMs like Apple and Samsung invest in proprietary inertial modules, heightening vertical integration and bargaining power over merchant vendors. Fab-capacity scarcity further motivates long-term silicon supply agreements, creating barriers for late entrants yet opening alliances with alternative piezoelectric MEMS developers that promise simpler tooling.
Disruptors harness printable nanomaterials for textile sensors and leverage cloudless AI to skirt privacy hurdles. Meanwhile, established incumbents acquire boutique design houses—Analog Devices’ USD 280 million purchase of Tronic Microsystems expands piezo-MEMS and vacuum packaging know-how—to pre-empt gaps in next-gen roadmaps. The result is dynamic competition that continually redefines value pools within the wearable motion sensors market.
Wearable Motion Sensors Industry Leaders
Analog Devices Inc.
Bosch Sensortec GmbH
TDK InvenSense
STMicroelectronics N.V.
Texas Instruments Incorporated
- *Disclaimer: Major Players sorted in no particular order
Wearable Motion Sensors Market Companies Covered in this Report
- Bosch Sensortec GmbH
- TDK InvenSense
- STMicroelectronics N.V.
- Analog Devices, Inc.
- Texas Instruments Incorporated
- Panasonic Industry Co., Ltd.
- Infineon Technologies AG
- NXP Semiconductors N.V.
- Samsung Electronics Co. Ltd.
- Robert Bosch GmbH (Sensors)
- TE Connectivity
- Qualcomm Technologies Inc.
- Sensirion AG
- Xsens (Movella)
- Valencell Inc.
- OMRON Corporation
- Garmin Ltd.
- Polar Electro Oy
- Fitbit LLC (Google)
- Apple Inc.
- Oura Health Oy
- Xiaomi Corporation
- Goertek Inc.
- Huami (Zepp Health)
- Withings SA

Market Opportunities and Future Outlook
Industrial safety and enterprise wearables create a clear whitespace for motion-sensor vendors that can combine rugged IMUs with validated incident-detection models and low-latency telemetry. In April 2026, IIIT Hyderabad unveiled the GoldAid smart wearable system using accelerometers, gyroscopes, and machine learning to detect industrial accidents and trigger real-time alerts, supported by field validation at a thermal power plant. That deployment highlights demand for purpose-built motion sensing that can function in noisy, high-risk environments. In June 2026, Telefónica Tech and Halotech partnered to deploy AI-powered smart safety wearables (HALO I, III, III+) across US industrial sectors, using Telefónica Kite IoT for real-time telemetry. This reinforces a pathway where motion and worker-state signals become inputs for EHS programs rather than standalone gadget features.
A second opportunity track is tighter integration between human telemetry and mainstream IIoT and cloud-edge stacks to reduce friction for scale deployments and recurring software attachment. In June 2026, VOORMI and Microsoft integrated garment-based human telemetry sensors with Azure IoT Operations using MQTT and Kubernetes-based edge infrastructure, positioning worker health and motion-related indicators alongside machine data within a unified data estate. Separately, continued miniaturization and higher-grade inertial performance expand addressable use cases into defense and autonomy-adjacent wearables and compact platforms, illustrated by the July 2026 launch of SBG Systems Pulse-40 OEM IMU with high dynamic range and improved bias stability, along with ongoing IMU performance upgrades from named suppliers pushing higher performance into smaller packages.
Recent Industry Developments in Wearable Motion Sensors Market
- July 2026: SBG Systems launched the Pulse-40 OEM IMU, a miniature tactical-grade inertial sensor with improved gyroscope bias stability and a +/-4000 deg/s dynamic range. The release expands access to higher-performance motion sensing in space-constrained platforms and accelerates design-in activity when high dynamics and vibration tolerance are priorities.
- June 2025: China implemented export restrictions on rare earth magnets, a key input for vibration motors used in smartwatches and true wireless stereo devices. This elevated supply-risk awareness for wearable hardware BOMs and reinforced multi-sourcing and redesign efforts to reduce exposure to single-country magnet supply.
- July 2024: The European Union began enforcing Digital Product Passport-related identifier requirements for smart wearables entering the EU, linking products to origin, composition, and repair information. This compliance layer pushed OEMs and suppliers to strengthen traceability and lifecycle data practices that can also be leveraged for usage analytics and after-sales services.


Wearable Motion Sensors Market Report Scope and Research Methodology
Market Definition and Coverage
This market covers revenue earned from motion sensing components used inside wearable devices to detect movement and orientation, including accelerometers and gyroscopes. The value is counted at the component level, so the sensor revenue is the unit of measure rather than the wearable end-product price.
Scope exclusions: This sizing excludes the full price of the wearable device itself and excludes software-only analytics and service subscriptions.
Segments Covered in This Report
- By Type
- Accelerometers
- Gyroscopes
- Magnetometers
- Inertial Measurement Units (IMUs)
- MEMS Combo Sensors
- Pressure Sensors
- By Application
- Fitness Bands
- Activity Monitors
- Smart Clothing
- AR/VR Headsets
- Smart Rings and Jewelry
- Ear-wear and Hearing Aids
- By End-user Industry
- Healthcare and Medical Devices
- Consumer Electronics and Lifestyle
- Industrial and Enterprise Safety
- Military and Defense
- Government and Public Utilities
- By Power Consumption
- Ultra-Low Power (Less than1mW)
- Low Power (1-10mW)
- Standard Power (10-50mW)
- High Power (Greater than 50mW)
- By Geography
- North America
- United States
- Canada
- Mexico
- Europe
- United Kingdom
- Germany
- France
- Italy
- Rest of Europe
- Asia-Pacific
- China
- Japan
- India
- South Korea
- Rest of Asia-Pacific
- Middle East
- Israel
- Saudi Arabia
- United Arab Emirates
- Turkey
- Rest of Middle East
- Africa
- South Africa
- Egypt
- Rest of Africa
- South America
- Brazil
- Argentina
- Rest of South America
- North America
Data Sources, Market Sizing, and Validation
Desk Research
Desk research was used to set the market boundaries, map the supply chain, and build first-pass assumptions around shipment trends and pricing ranges before they were stress-tested. For this, we referenced public sources such as the US International Trade Commission (for trade and tariff context), UN Comtrade (for trade flows in relevant electronics categories), IEEE and other peer-reviewed journals (for sensor performance and adoption patterns), and patent databases (for filing intensity around MEMS motion sensing and wearables).
To avoid anchoring on a single data series, we also reviewed company annual reports, investor presentations, earnings call transcripts, and credible tech press for signals on wearable unit momentum and sensor integration shifts. Where needed, paid subscriptions that cover company financials and intelligence, patent landscaping, and shipment-level import export records were used to cross-check revenues, manufacturing footprints, and channel movement. These are illustrative examples, and many other public sources were also used for data collection, validation, and clarification.
Primary Interviews and Surveys
Primary interviews and survey inputs were used to validate attach rates, typical sensor counts per wearable, and ASP movement across low power tiers and device categories, since these items can change quickly and swing totals. We spoke with a mix of component suppliers, device OEM and ODM contacts, distribution participants, and domain experts across APAC, EMEA, and the Americas, and then used the feedback to close data gaps and confirm that modeled demand signals align with what is being seen in real procurement cycles.
Distribution of primary research fieldwork respondents
| Company type | Respondent position | Region |
|---|---|---|
| Top tier: 27% | CXOs: 12% | APAC: 47% |
| Mid tier: 58% | Functional/Unit leaders: 28% | EMEA: 32% |
| Smaller Players: 15% | Managers: 60% | Americas: 21% |
Market-Sizing & Forecasting
Sizing starts with a top-down reconstruction of the wearable demand pool by region, where device shipments and replacement cycles are translated into motion sensor demand using penetration assumptions and typical sensor content per device. Once that demand base is built, revenue is derived using modeled ASP bands that differ by sensor type and by power consumption class (for example, ultra-low power versus standard power), then reconciled with what industry participants describe as realistic price corridors.
To keep the model grounded, selective bottom-up checks were run using supplier revenue directionality, sampled ASP x estimated unit volumes, and channel feedback on mix changes, which were then used to adjust outliers. Key inputs used in the model include wearable shipment momentum by device category, sensor content per wearable, power consumption mix shifts, MEMS cost curves and packaging effects on ASP, regional adoption of health and fitness monitoring, and currency conversion timing for non-USD reported financials. Forecasting is based on scenario analysis supported by driver assumptions from primary conversations, and those scenarios are tied back to expected wearable shipment growth, mix upgrades, and steady ASP erosion trends.
When bottom-up signals were incomplete for smaller suppliers or private entities, gaps were handled using normalized revenue ranges per shipment band and then validated through distributor and OEM checks so the final total remained consistent with the demand pool logic.
Data Validation & Update Cycle
Validation is done through cross-checks that compare modeled outputs with independent signals, including region-level wearable shipment trends, observed sensor mix shifts, and realistic ASP corridors discussed in interviews. Any large variance is reviewed, assumptions are revisited, and follow-up calls are triggered when a single input, such as a change in power tier mix, creates a visible step change in the output.
Before sign-off, the model and write-up go through multi-step internal reviews so that input definitions, unit handling, and currency conversions are consistent across sections. The report is refreshed annually, and interim updates are made when material events occur, such as major product cycle changes or macro shifts that alter demand. Right before delivery, an analyst runs a fresh pass to ensure the numbers reflect the latest available signals.
Mordor Intelligence's Global Wearable Motion Sensors Market Market Sizing Compared With Other Published Estimates
Published market numbers for wearable motion sensors often do not align because the market boundary is drawn differently and timing assumptions are not consistent. Differences also show up when one estimate relies heavily on device-level revenue proxies, while another tries to isolate only component-level sensor value, which is a narrower pool.
In this study, the refresh cadence and currency conversion timing were kept consistent around the 2026 base, and ASP logic was checked against power-tier mix feedback from interviews, which is why Mordor Intelligence lands closer to a component-level view rather than a full wearable value proxy.
Benchmark comparison
| Source | Market Size | Gaps in Research Methodology |
|---|---|---|
| Mordor Intelligence | USD 2.82 B (2026) | |
| Global Distributor Brief A | USD 2.50 B (2025) | Uses an earlier base year and can understate the 2026 step-up if device shipment rebound and mix upgrades are not rolled forward with updated ASP bands. |
| Industry Publisher B | USD 7.69 B (2024) | Appears to include broader wearable value proxies and adjacent categories beyond component-level motion sensors, which inflates totals even before forecast assumptions are applied. |
The spread in the table mainly comes from what gets counted and when it gets refreshed, rather than from arithmetic differences. By keeping the scope tied to motion sensor components inside wearables and by rechecking ASP and currency timing around the base year, the model stays traceable to a clear demand pool and can be repeated with the same inputs next cycle.


Key Questions Answered in the Report
What is the current value of the wearable motion sensors market?
The market is worth USD 2.82 billion in 2026 and is on track to reach USD 5.16 billion by 2031 at a 12.81% CAGR.
Which region grows fastest through 2031?
Asia Pacific leads growth with a 16.32% CAGR, propelled by rising electronics manufacturing and healthcare spending.
How large is the accelerometers segment?
Accelerometers account for 31.65% of wearable motion sensors market share in 2025, maintaining leadership due to versatility.
What powers ultra-low-power wearables?
Devices consuming under 1 mW often pair sub-milliwatt MEMS with energy harvesters, enabling weeks of operation without charging.
Why is AI sensor fusion important?
Embedded AI improves motion pattern recognition and clinical accuracy, driving adoption in medical-grade wearables and contributing a +2.8% uplift to market CAGR.
What challenges limit smart clothing adoption?
Reliability issues in textile interconnects reduce product lifetimes, shaving an estimated 1.0% from overall market CAGR until materials advances resolve failures.
Page last updated on:





