Float Glass Market Size and Share
Market Overview
| Study Period | 2025 - 2031 |
|---|---|
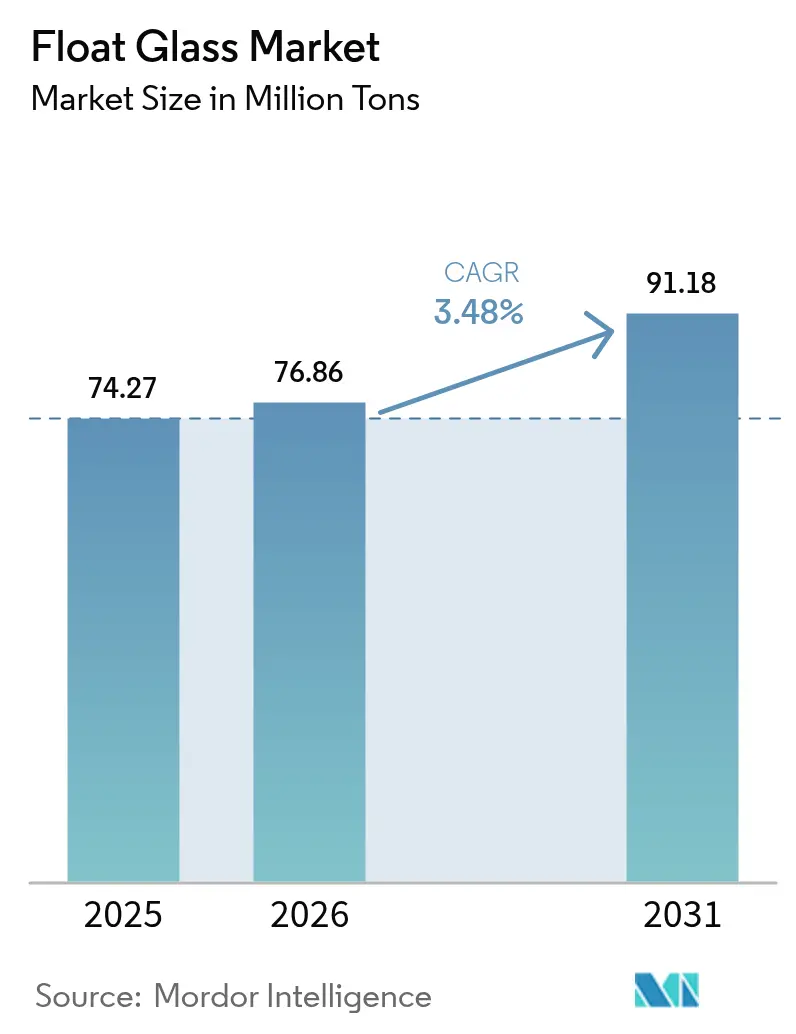
| Market Volume (2026) | 76.86 Million tons |
| Market Volume (2031) | 91.18 Million tons |
| Growth Rate (2026 - 2031) | 3.48% CAGR |
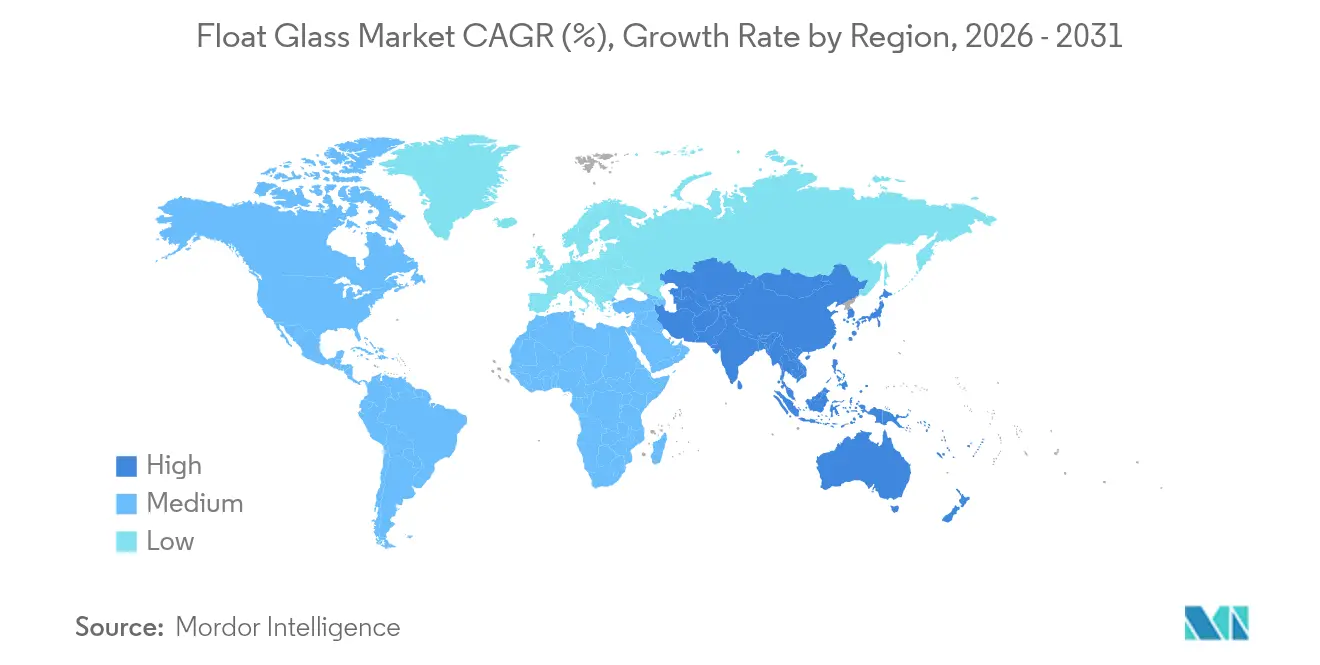
| Fastest Growing Market | Asia-Pacific |
| Largest Market | Asia-Pacific |
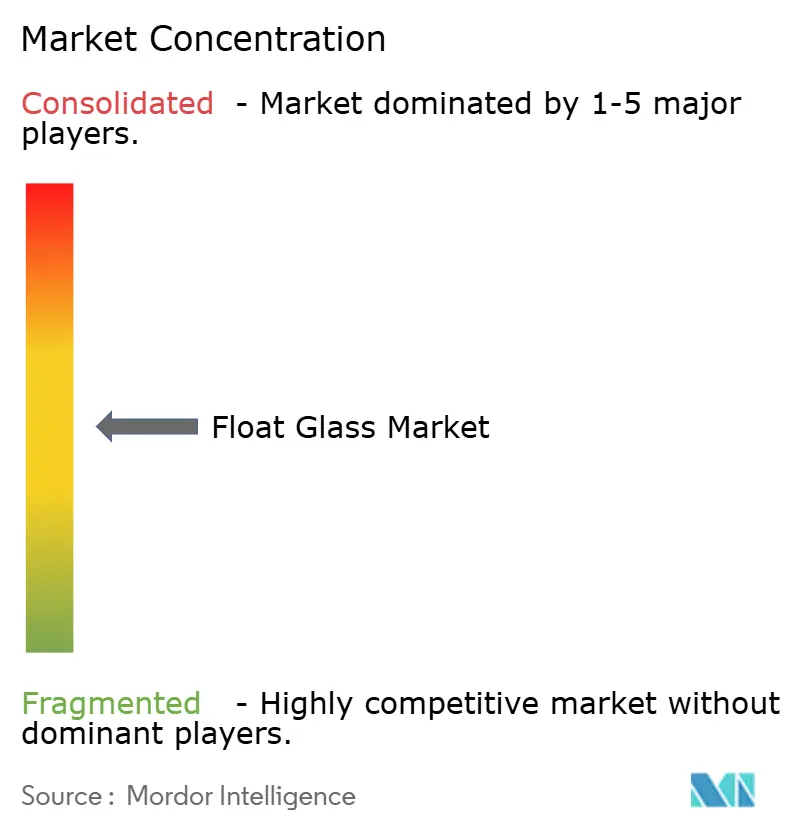
| Market Concentration | Medium |
Major Players *Disclaimer: Major Players sorted in no particular order Image © Mordor Intelligence. Reuse requires attribution under CC BY 4.0. | |
Float Glass Market Analysis by Mordor Intelligence
Float Glass Market size in 2026 is estimated at 76.86 million tons, growing from 2025 value of 74.27 million tons with 2031 projections showing 91.18 million tons, growing at 3.48% CAGR over 2026-2031. Surging demand for high-performance substrates in solar, automotive, and energy-efficient façades supports steady volume gains even as traditional construction end-uses mature. Manufacturers leverage process automation and furnace upgrades to curb the volatility stemming from soda-ash and natural-gas input costs, while decarbonization investments safeguard access to export markets facing carbon-based trade barriers. Competitive differentiation now rests less on throughput and more on precision, reliability, and the capacity to deliver ultra-clear, thin, or multi-functional sheets that command premium margins. Rapid installations of utility-scale solar arrays in North America and the shift toward low-carbon building envelopes in Europe are reshaping global procurement models, forcing Asian suppliers to accelerate emission-reduction roadmaps to maintain share. With multibillion-dollar capacity additions scheduled in both China and the United States, the float glass market continues to rebalance toward regionalized supply chains that prioritize resilience and carbon efficiency.
Key Report Takeaways
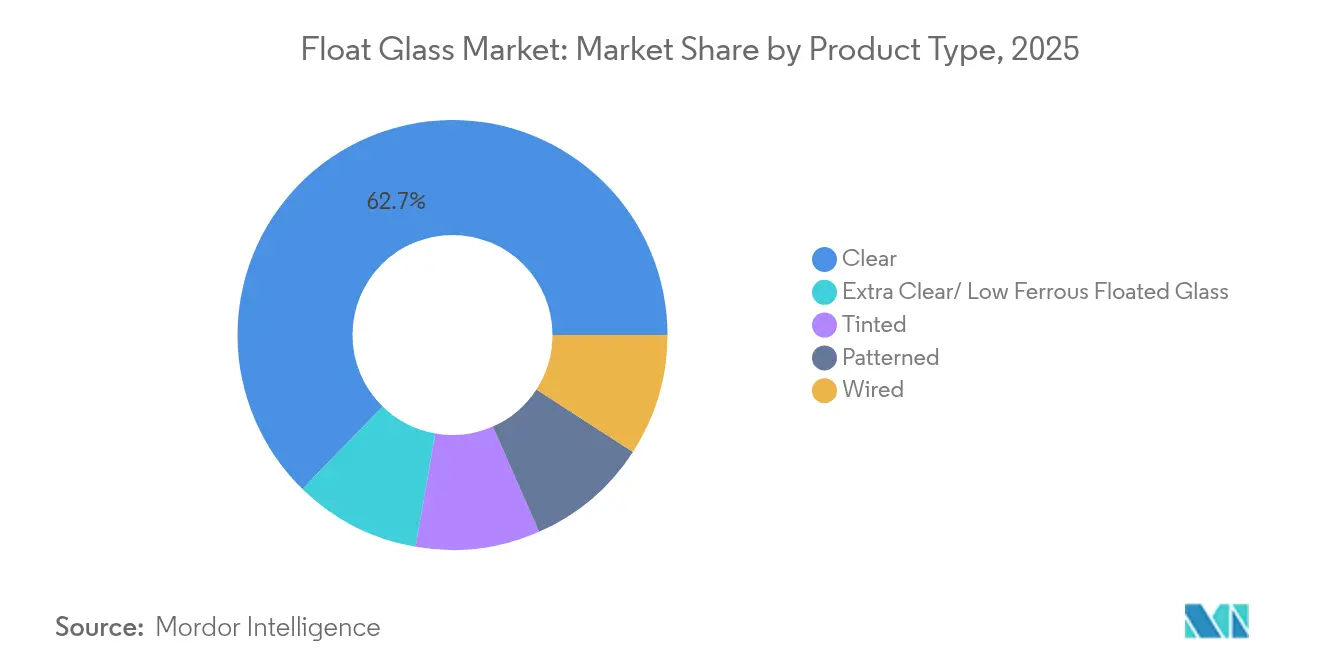
- By product type, clear glass led with 62.70% of the float glass market share in 2025, growing at a CAGR of 3.79% through 2031.
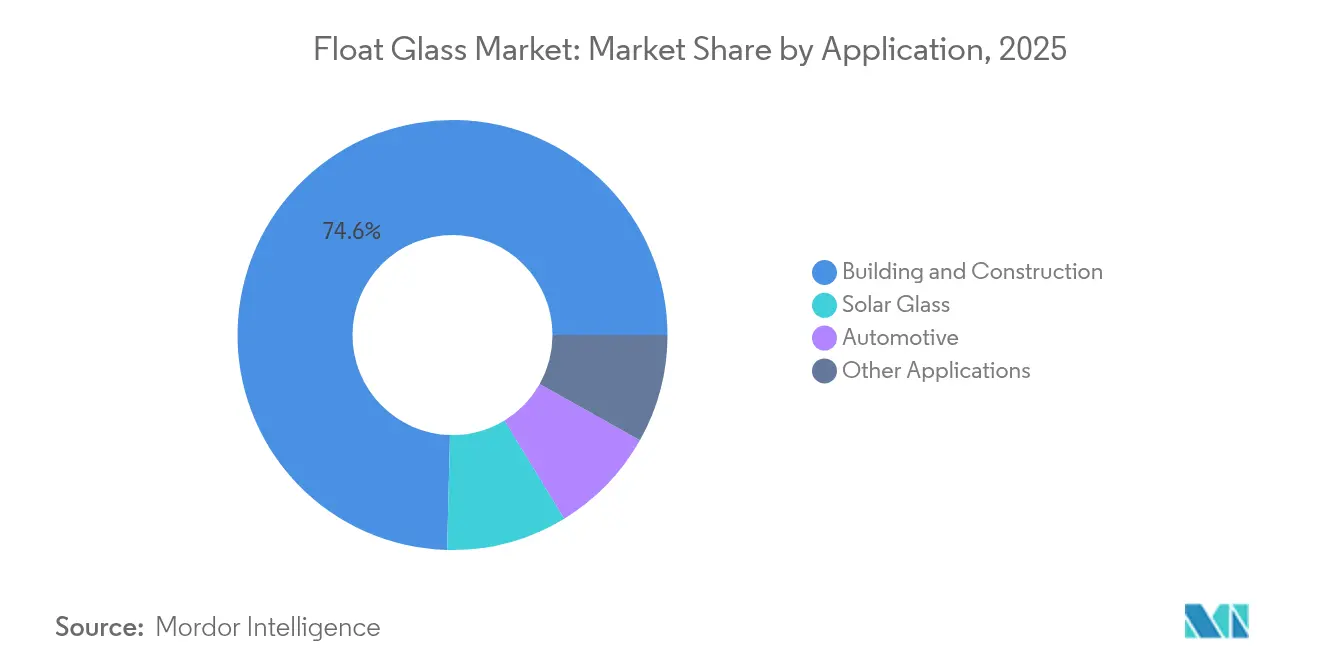
- By application, building and construction led with a share of 74.60% in 2025, while solar glass advanced at an 8.01% CAGR through 2031, the highest rate among all segments.
- By geography, Asia-Pacific accounted for 62.65% of the float glass market size in 2025 and is projected to expand at 3.92% CAGR to 2031.
Note: Market size and forecast figures in this report are generated using Mordor Intelligence’s proprietary estimation framework, updated with the latest available data and insights as of 2026.
Global Float Glass Market Trends and Insights
Driver Impact Analysis*
| Drivers | (~) % Impact on CAGR Forecast | Geographic Relevance | Impact Timeline |
|---|---|---|---|
| Construction-sector expansion in emerging economies | +0.8% | Asia-Pacific core, spill-over to MEA | Medium term (2-4 years) |
| Automotive lightweighting raises glazing m² per vehicle | +1.2% | Global, with concentration in APAC and North America | Long term (≥4 years) |
| Utility-scale solar buildouts boost demand for low-iron float glass | +0.9% | Global, led by North America and APAC | Short term (≤2 years) |
| Urban regeneration mandates energy-efficient façades | +0.4% | Europe and North America, expanding to APAC urban centers | Medium term (2-4 years) |
| BIPV façade regulations spur ultra-clear low-iron substrates | +0.3% | Europe core, early adoption in North America and APAC | Long term (≥4 years) |
| Source: Mordor Intelligence | |||


Construction-Sector Expansion in Emerging Economies
Decisive public-sector outlays on transport, housing, and industrial corridors are fueling sustained purchases of architectural glass across South and Southeast Asia. India’s construction pipeline equals 3.5 times the sector’s annual operating revenue. Thailand’s Eastern Economic Corridor continues to absorb large sheet volumes even as labor shortages slow project execution. With regional float lines already running at utilization rates below 80%, producers situated near these demand hubs can ramp shipments swiftly without green-field investments. As a result, the float glass market will rely on fast-growing emerging economies to offset plateauing consumption in mature Western countries.
Automotive Lightweighting Raises Glazing M² Per Vehicle
Electrification mandates have made weight a premium KPI for automakers, yet advanced driver-assistance systems, panoramic roofs, and immersive infotainment screens are simultaneously expanding the glass surface area per car. This paradox underpins a structural upswing for the float glass market, as OEMs specify thinner yet larger laminated or tempered panes that integrate antennas, heaters, and head-up-display coatings. Fuyao’s decision to inject CNY 5.8 billion (USD 804 million) into new float lines dedicated to electrified vehicle platforms illustrates the scale of the opportunity. The resulting requirement for optical clarity and electromagnetic transparency supports premium pricing, ensuring that volume growth feeds directly into revenue and margin expansion for technologically capable suppliers.
Utility-Scale Solar Build-Outs Boost Demand for Low-Iron Float Glass
Record-low levelized costs of USD 31/MWh for U.S. utility solar installations have removed subsidy dependencies, setting off a multi-gigawatt development wave that leans heavily on 2.0 mm ultra-clear sheets to maximize cell efficiency[1]Joachim Seel, “Utility-Scale Solar, 2024 Edition,” Lawrence Berkeley National Laboratory, lbl.gov. China’s acceleration in N-type module output has raised silica purity requirements and pushed specialized sand prices to USD 55 per ton, underscoring how the float glass market derives fresh value from tailored mineral supply chains. Although thinner substrates use less glass per pane, higher rejection rates and tighter tolerances mean volume shipped per installed megawatt actually climbs, magnifying tonnage demand despite the down-gauging trend.
BIPV Façade Regulations Spur Ultra-Clear Low-Iron Substrates
The European Union’s industrial carbon plan positions building-integrated photovoltaics as an instrument for meeting net-zero targets, mandating ultra-clear substrates that optimize electrical output. Yet only 1-3% of PV systems in Sweden today are integrated into envelopes, highlighting significant headroom for adoption. As architects in hot climates refine climate-responsive façade designs that reduce thermal loads without sacrificing aesthetics, demand tilts toward float sheets with both high solar transmission and selective infrared control. Each regulatory ratchet effectively cements high-clarity float glass as an indispensable input for distributed renewable generation.
Restraint Impact Analysis*
| Restraints | (~) % Impact on CAGR Forecast | Geographic Relevance | Impact Timeline |
|---|---|---|---|
| Volatile soda-ash and natural-gas prices | -0.6% | Global, with acute impact in Europe and North America | Short term (≤2 years) |
| Polymer and polycarbonate substitutes in safety glazing | -0.4% | North America and Europe core, expanding to APAC | Medium term (2-4 years) |
| EU Carbon Border Adjustment Mechanism compliance costs | -0.3% | Asia-Pacific exporters to EU, secondary impact on global pricing | Medium term (2-4 years) |
| Source: Mordor Intelligence | |||
Polymer and Polycarbonate Substitutes in Safety Glazing
Automotive and architectural standards permit polycarbonate solutions that weigh 40-50% less than laminated glass while matching impact resistance. Weight-sensitive OEMs therefore experiment with polymer roofs and rear windows; however, scratch performance, UV stability, and optical distortion issues still confine usage to niche placements. Glass makers answer with thinner, lighter laminates using advanced PVB interlayers, as evidenced by Eastman’s European capacity expansion. The resulting material joust moderates the float glass market CAGR but also catalyzes innovation, widening the product envelope and raising entry barriers.
EU Carbon Border Adjustment Mechanism Compliance Costs
Beginning in 2026, importers must remit certificates reflecting embedded CO₂, eroding the historic cost edge enjoyed by Asian float lines fired by coal or fuel oil. Analyses show U.S. suppliers will pay markedly less under CBAM, improving their price parity in Europe[2]Daniel Hoenig, “Projecting CBAM Impacts,” Climate Leadership Council, clcouncil.org . Saint-Gobain and AGC have responded with a hybrid oxy-fuel/electric furnace prototype targeting 75% emission cuts. The policy reframes decarbonization as a market access fee rather than a voluntary ESG pursuit, accelerating capital rotation into low-carbon plants across the float glass market.
*Our forecasts treat driver/restraint impacts as directional, not additive. The impact forecasts reflect baseline growth, mix effects, and variable interactions.
Segment Analysis
By Product Type: Clear Glass Sustains Leadership Through Premium Applications
Clear sheet controlled 62.70% of the float glass market share in 2025 and will register the highest 3.79% CAGR through 2031. This dominance reflects unrivaled versatility: façade glazing, automotive windscreens, and low-iron solar covers all demand transparency levels unattainable by tinted or patterned variants. Manufacturers channel research and development budgets into purification and melt-homogeneity technologies that suppress bubble content and iron residue, securing margins that offset commodity headwinds. Tinted and patterned sheets persist as design-driven niches, yet their uptake follows cyclical architectural trends rather than structural technology shifts.
Extra-clear low-ferrous grades sit at the premium apex, powered by solar boom economics and luxury façade aesthetics. NSG’s Pilkington Mirai™ and Xinyi’s 2.0 mm glass lines exemplify the emphasis on both embodied-carbon cuts and extreme thinness. As N-type solar modules cascade through production lines, sheet rejection rates rise, paradoxically lifting clear-glass tonnage per installed gigawatt. Integrated sand quarries and real-time impurity scanners thus become critical competitive assets across the float glass market.


By Application: Solar Glass Disrupts Building-Construction Dominance
Building and construction accounted for 74.60% of float glass market size in 2025, supported by emerging-economy housing programs and Western retrofit mandates. Yet the solar glass sub-segment, propelled by an 8.01% CAGR. Grid-parity economics place ultra-clear float sheets at the core of megawatt-class PV arrays, enabling suppliers to lock in multiyear offtake contracts with module makers eager for quality consistency. Automotive demand delivers incremental tonnage via expanded glass-to-metal ratios in EV cabins, while electronic and industrial niches contribute high-margin but low-volume revenues.
Circularity initiatives further tighten application linkages. AGC’s tie-up with ROSI recycles end-of-life solar cover glass back into the float batch, trimming virgin silica usage and easing CBAM risk. As downstream users embed scope-3 scrutiny into supplier scorecards, product passports confirming recycled content and energy provenance become decisive bid factors, steering the float glass market toward vertically integrated ecosystems.
Geography Analysis
Asia-Pacific dominates the float glass market, supplying 62.65% of global output in 2025 and advancing at a 3.92% CAGR to 2031. China anchors the base with mega-scale kiln clusters, while India rides an unprecedented USD 1.5 trillion construction upcycle that absorbs large sheets for residential towers and logistics parks. Thailand’s infrastructure spend around the Eastern Economic Corridor cushions regional demand dips tied to residential slowdowns. Yet Asian exporters must navigate rising freight charges and looming CBAM levies, prompting pilot investments in hybrid furnaces and rooftop solar to reduce shipped-ton CO₂.
Europe, historically the cradle of float innovation, is now the crucible for low-carbon manufacturing. Saint-Gobain’s ORAÉ series combines high recycled content with cradle-to-cradle certification, while AGC Interpane’s upgrades in Germany and Austria elevate line efficiencies despite weak housing starts.
North America capitalizes on nearshoring dynamics and clean-energy incentives. Fuyao’s USD 400 million boost to its Illinois float facility ensures just-in-time supply for Midwest EV plants. Combined with the Inflation Reduction Act’s manufacturing tax credits, these moves shift import reliance toward domestically melted sheets, narrowing latency and carbon footprints. South America and the Middle East and Africa deliver incremental tonnage via stadium builds, desalination projects, and smart-city launches, but limited local capacity keeps per-capita consumption below mature-market norms.

Competitive Landscape
The market is moderately fragmented. Competitive positioning hinges on process automation, sustainability roadmaps, and access to captive silica or soda-ash assets rather than sheer furnace count. Sustainability is now a price-of-entry metric. NSG’s 100% biofuel trial in the U.K. and AGC’s hydrogen-assisted melts in Belgium cut kiln CO₂ by up to 50%, winning OEM procurement points in Europe’s decarbonizing automotive supply chain. Smaller regional specialists survive by tailoring colors, patterns, or service bundles, often under OEM contract manufacturing models. As CBAM and other carbon tariffs proliferate, the premium attached to verifiable low-emission sheets will likely widen, conferring first-mover advantage to innovators and reinforcing a technology-centric pecking order within the float glass market.
Float Glass Industry Leaders
AGC Inc.
Nippon Sheet Glass Co., Ltd.
Saint-Gobain
Guardian Industries Holdings
Xinyi Glass Holdings Limited
- *Disclaimer: Major Players sorted in no particular order

Recent Industry Developments
- March 2025: Fuyao Glass confirmed a USD 400 million expansion at its Decatur, Illinois float plant, adding capacity aimed at EV glazing modules.
- January 2024: Fuyao Glass approved a CNY 5.8 billion (USD 804 million) investment for two float lines in Hefei, China focused on next-generation vehicle platforms.


Global Float Glass Market Report Scope
Float glass is a type of flat glass produced by the float glass process. It is a smooth, distortion-free glass used in designing other glass items such as laminated glass and heat-toughened glass. With a natural greenish hue and translucent nature, it can transmit about 87% of the incident light, and unlike sheet glass, float glass provides users with a crystal-clear view.
The float glass market is segmented by raw material, type, application, and geography. By type, the market is segmented into clear, tinted, patterned, wired, and extra clear or low ferrous floated glass. By application, the market is segmented into building and construction, automotive, solar glass, and other applications (display cases, etc.). The report also covers the market size and forecasts for the float glass market in 28 countries across major regions. For each segment, the market sizing and forecasts have been done on the basis of volume (tons).
| Clear |
| Tinted |
| Patterned |
| Wired |
| Extra Clear/Low Ferrous Floated Glass |
| Building and Construction |
| Automotive |
| Solar Glass |
| Other Applications |
| Asia-Pacific | China |
| India | |
| Japan | |
| South Korea | |
| Vietnam | |
| Thailand | |
| Indonesia | |
| Malaysia | |
| Rest of Asia-Pacific | |
| North America | United States |
| Canada | |
| Mexico | |
| Europe | Germany |
| United Kingdom | |
| France | |
| Italy | |
| Spain | |
| Russia | |
| Nordic Countries | |
| Rest of Europe | |
| South America | Brazil |
| Argentina | |
| Colombia | |
| Rest of South America | |
| Middle-East and Africa | Saudi Arabia |
| Nigeria | |
| Qatar | |
| United Arab Emirates | |
| Egypt | |
| South Africa | |
| Rest of Middle-East and Africa |
| By Product Type | Clear | |
| Tinted | ||
| Patterned | ||
| Wired | ||
| Extra Clear/Low Ferrous Floated Glass | ||
| By Application | Building and Construction | |
| Automotive | ||
| Solar Glass | ||
| Other Applications | ||
| By Geography | Asia-Pacific | China |
| India | ||
| Japan | ||
| South Korea | ||
| Vietnam | ||
| Thailand | ||
| Indonesia | ||
| Malaysia | ||
| Rest of Asia-Pacific | ||
| North America | United States | |
| Canada | ||
| Mexico | ||
| Europe | Germany | |
| United Kingdom | ||
| France | ||
| Italy | ||
| Spain | ||
| Russia | ||
| Nordic Countries | ||
| Rest of Europe | ||
| South America | Brazil | |
| Argentina | ||
| Colombia | ||
| Rest of South America | ||
| Middle-East and Africa | Saudi Arabia | |
| Nigeria | ||
| Qatar | ||
| United Arab Emirates | ||
| Egypt | ||
| South Africa | ||
| Rest of Middle-East and Africa | ||


Key Questions Answered in the Report
What is the projected global demand for float glass in 2031?
The float glass market size will reach 91.18 million tons by 2031, rising from 76.86 million tons in 2026.
How fast is solar-grade float sheet demand growing?
Solar glass is expanding at an 8.01% CAGR to 2031 on the back of utility-scale installations.
Which region drives most float glass production today?
Asia-Pacific supplies 62.65% of global volume, with China and India as primary hubs.
How does CBAM affect Asian float exporters?
Starting 2026, shipments into the EU will carry carbon fees, reducing prior cost advantages and incentivizing low-carbon furnaces.
Why are automakers important for glass makers’ future orders?
Electrification and larger glazing areas lift per-vehicle glass use, while thinner, high-clarity sheets fetch premium prices.
Page last updated on:


