
Ultra-Thin Glass Market Size and Share
Market Overview
| Study Period | 2021 - 2031 |
|---|---|
| Market Size (2026) | USD 15.71 Billion |
| Market Size (2031) | USD 26.87 Billion |
| Growth Rate (2026 - 2031) | 11.34 % |
| Fastest Growing Market | North America |
| Largest Market | Asia Pacific |
| Market Concentration | Medium |
Major Players *Disclaimer: Major Players sorted in no particular order Image © Mordor Intelligence. Reuse requires attribution under CC BY 4.0. | |
Ultra-Thin Glass Market Analysis by Mordor Intelligence
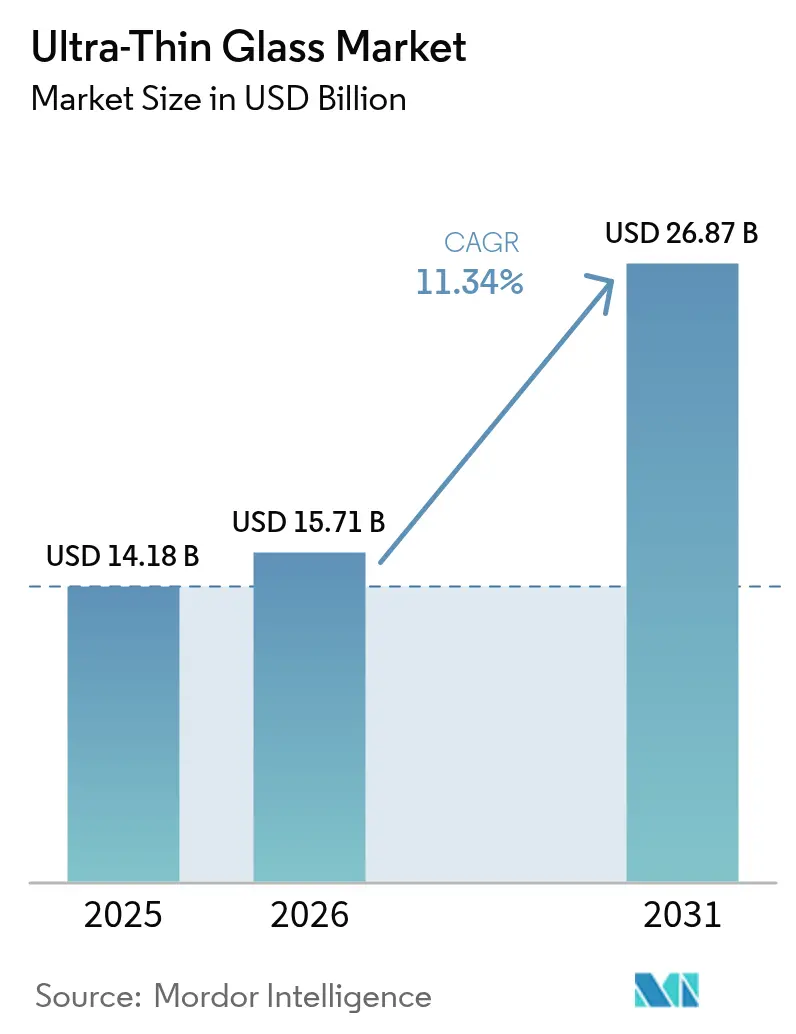
The Ultra-Thin Glass Market size is projected to be USD 14.18 billion in 2025, USD 15.71 billion in 2026, and reach USD 26.87 billion by 2031, growing at a CAGR of 11.34% from 2026 to 2031. Demand is accelerating as foldable smartphones, chiplet-based semiconductors, and weight-sensitive automotive glazing converge on substrates thinner than 0.5 millimeters. Touch-panel displays continue to anchor volume, yet next-generation glass interposers for advanced packaging and curved head-up displays (HUDs) are unlocking higher-margin outlets. Material selection is also widening: soda-lime variants dominate cost-focused devices, while aluminosilicate, borosilicate, and lithium-aluminosilicate chemistries secure premium niches that mandate low thermal expansion or extreme surface compression. Regionally, Asia-Pacific retains a scale advantage on the back of Chinese microfloat retrofits and Korean OLED investments, but North America is emerging as the fastest-growing node as the CHIPS Act localizes semiconductor supply chains.
Key Report Takeaways
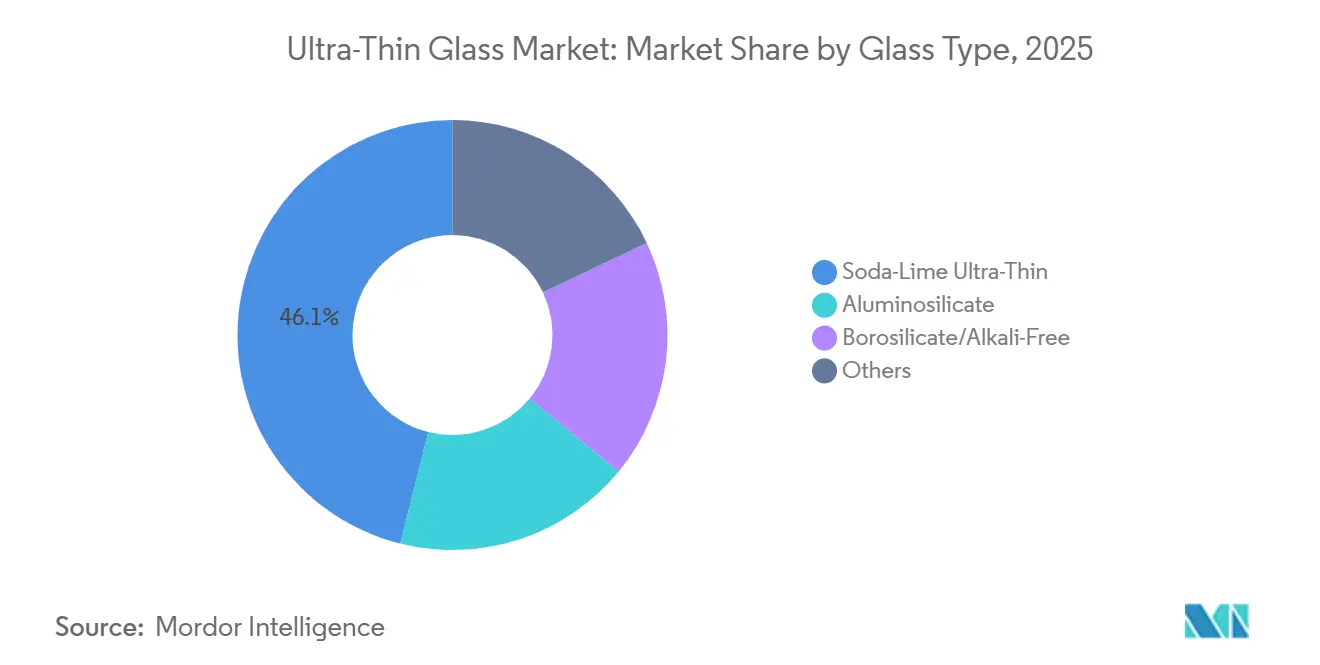
- By glass type, soda-lime commanded 46.09% of the ultra-thin glass market share in 2025, and the segment is projected to post a 12.10% CAGR to 2031.
- By manufacturing process, float and microfloat lines held 50.68% share of the ultra-thin glass market size in 2025 and are forecast to expand at a 12.89% CAGR between 2026-2031.
- By application, touch-panel displays led with 29.50% of the ultra-thin glass market share in 2025, while semiconductor substrates are projected to register the fastest 12.20% CAGR through 2031.
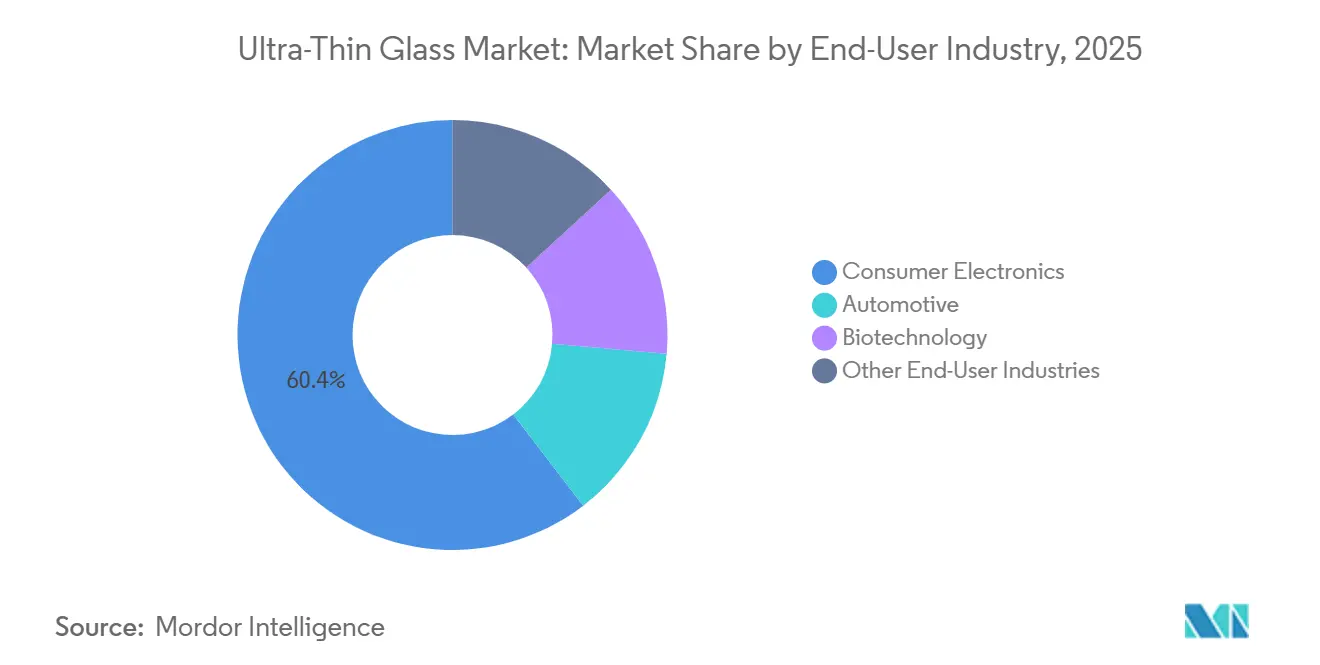
- By end-user industry, consumer electronics represented 60.41% of 2025 revenue, but automotive glazing is expected to grow at an 11.99% CAGR to 2031.
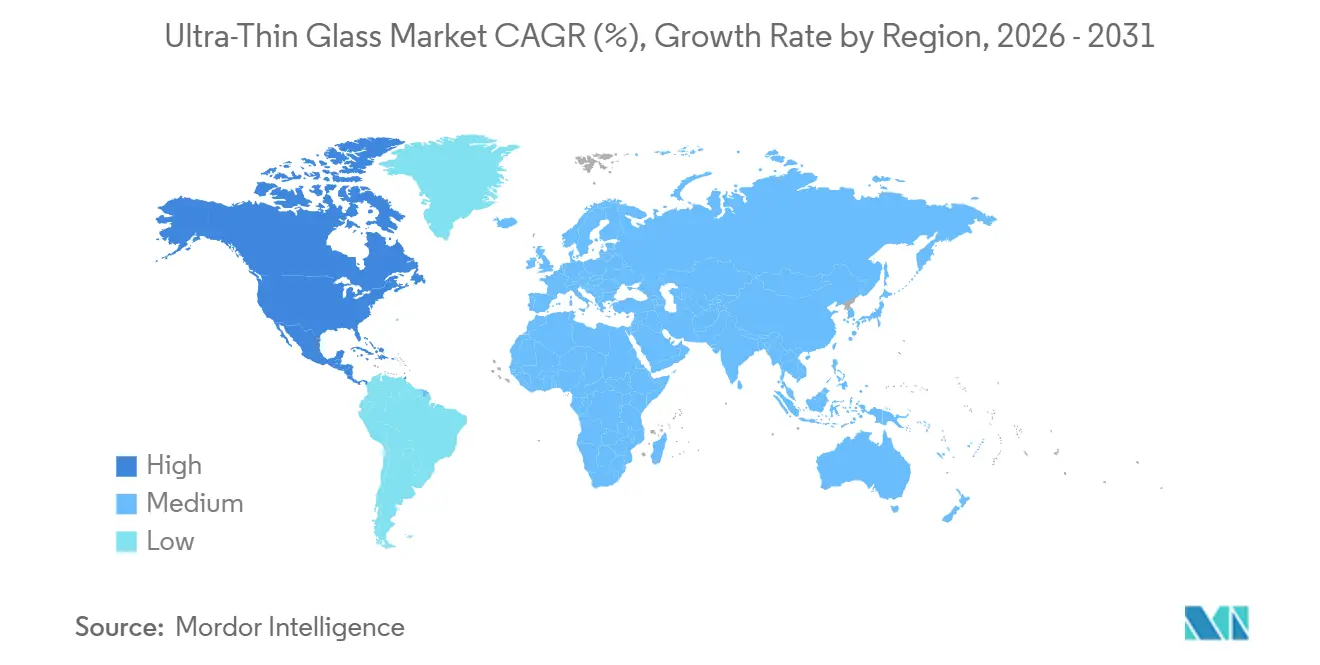
- By geography, Asia-Pacific contributed 49.59% of the 2025 value, whereas North America will record the highest regional CAGR of 11.91% over 2026-2031.
Note: Market size and forecast figures in this report are generated using Mordor Intelligence’s proprietary estimation framework, updated with the latest available data and insights as of 2026.
Market Trends and Insights
Drivers Impact Analysis of Ultra-Thin Glass Market*
| Drivers | (~) % Impact on CAGR Forecast | Geographic Relevance | Impact Timeline |
|---|---|---|---|
| Growing demand from consumer electronics | +2.8% | Global, with APAC core accounting for 49.59% share | Medium term (2-4 years) |
| Rapid adoption in foldable smartphones and notebooks | +2.5% | APAC (South Korea, China), North America (Apple supply chain) | Short term (≤ 2 years) |
| Advancements in flexible OLED and micro-LED display lines | +2.1% | South Korea, China, Taiwan (display-panel hubs) | Medium term (2-4 years) |
| Weight-reduction needs in automotive glazing and HUDs | +1.6% | North America, Europe (automotive OEM clusters) | Long term (≥ 4 years) |
| Glass interposers for chiplet packaging | +1.4% | North America, Japan, South Korea (advanced-packaging nodes) | Long term (≥ 4 years) |
| Source: Mordor Intelligence | |||
Growing Demand from Consumer Electronics
In 2025, consumer electronics accounted for a significant portion of the market volume, driven by a robust upgrade cycle towards under-display sensors and edge-to-edge touch modules, fueling double-digit growth. Samsung's Galaxy S25 Ultra, featuring the new Corning Gorilla Armor 2, achieved a notable reduction in surface reflectance[1]Corning Incorporated, “Corning Gorilla Armor 2,” corning.com. This innovation has led rival OEMs to pursue similar 0.4-millimeter substrates. Following suit, notebook vendors are now adopting ultra-thin glass panels, moving away from the previously used yellow-prone polyimide films. However, the segment's dynamics are evolving, with semiconductor substrates for AI accelerators beginning to capture a larger market share. These advanced packaging applications not only command higher average selling prices but also utilize alkali-free chemistries. This ensures the protection of 112 Gbps SerDes lanes, subtly shifting the revenue focus towards these performance-critical grades.
Rapid Adoption in Foldable Smartphones and Notebooks
Ultra-thin glass economics have been revolutionized by the advent of foldable form factors. Samsung Display is rolling out its 8.6-generation OLED line, set to deliver crease-free panels tailored for Apple's anticipated foldable iPhone debuting in 2026. In a bid to mitigate risks, Chinese panel manufacturers are collaborating on microfloat soda-lime covers. These innovative covers boast impressive endurance and come at a significant cost advantage. Meanwhile, Corning has struck a deal, licensing its Willow roll-to-roll borosilicate, specifically designed for 180-degree notebook hinges. As a result, the industry's spotlight has shifted from merely ensuring hinge durability to mastering yield management. Notably, both float and microfloat lines are nearing the pivotal threshold, a sweet spot that harmonizes price and reliability for the mass-market foldable segment.
Advancements in Flexible OLED and Micro-LED Display Lines
Display fabs are now embedding ultra-thin glass directly into their backplane stacks. LG Display's CoE program is depositing RGB filters onto glass encapsulation layers, achieving a reduction in panel thickness and a cut in power consumption. Additionally, as micro-LED initiatives gain momentum, there's a demand for glass with a thermal expansion below 3.5 ppm/°C. SCHOTT's newly released low-loss glass in 2024 not only meets this requirement but also boasts high blue-light transmittance. As a result, while soda-lime continues to serve as the budget-friendly choice for OLED smartphones, borosilicate and lithium-aluminosilicate are stepping up for thermally sensitive micro-LED and automotive applications.
Weight-Reduction Needs in Automotive Glazing and HUDs
Electric-vehicle platforms are relentlessly chasing every kilogram of weight savings. Laminated ultra-thin windshields can reduce a car's weight, translating to an increase in range for a vehicle powered by a 75 kWh battery. AGC's Leoflex glass, set to be qualified in 2025, not only adheres to ISO-mandated thermal-shock durability standards but also boasts a significant weight reduction for curved HUD combiners. Procurement data reveals a significant uptick: European Tier-1s issued multiple RFQs for ultra-thin panoramic roofs in 2025, a notable increase from 2023, indicating a surge in design wins. Furthermore, EU recyclability regulations are amplifying this trend, incentivizing the use of lighter materials that are easier to document.
Restraints Impact Analysis of Ultra-Thin Glass Market*
| Restraints | (~) % Impact on CAGR Forecast | Geographic Relevance | Impact Timeline |
|---|---|---|---|
| High cost of high-purity raw materials and precision processing | -1.8% | Global, acute in North America and Europe due to energy costs | Medium term (2-4 years) |
| Brittleness and yield loss during large-area handling | -1.5% | APAC manufacturing hubs (China, South Korea, Japan) | Short term (≤ 2 years) |
| Limited recycling streams for greater than 0.3 mm glass waste | -0.9% | Europe (End-of-Life Vehicles Directive), North America | Long term (≥ 4 years) |
| Source: Mordor Intelligence | |||
High Cost of High-Purity Raw Materials and Precision Processing
Costs rise as electronic-grade silica, with iron content less than 50 ppm, high-purity alumina powder, and platinum-rhodium furnace hardware see price hikes. In 2025, spot silica prices surged, impacting float-line margins, especially for those without hedged contracts. Fusion-draw furnaces, operating at high temperatures, necessitate crucible replacements periodically. Additionally, ion-exchange and laser patterning techniques command a significant premium for aluminosilicate covers compared to soda-lime. European manufacturers grapple with heightened pressures from soaring natural-gas tariffs. While SCHOTT's electric-melting retrofit in Mainz offers some relief, it doesn't fully shield against energy price fluctuations.
Brittleness and Yield Loss During Large-Area Handling
Substrates thinner than 0.3 mm fracture under a stress of 20 MPa, a threshold frequently exceeded during vacuum-chuck transfers. In 2025, Chinese float operators reported a scrap rate for Gen 8-plus panels, diminishing their cost advantage[2]CSG Holding, “Display Glass Production,” csgglass.com. While Corning’s ion-levitation handlers boost yields, their high price tag per tool limits their use to semiconductor lines. However, roll-to-roll coating shows potential at Fraunhofer’s Glass4Flex pilot; its inability to accommodate ion-exchange confines its applications to non-structural sensors.
*Our forecasts treat driver/restraint impacts as directional, not additive. The impact forecasts reflect baseline growth, mix effects, and variable interactions.
Ultra-Thin Glass Market Segment Analysis
By Glass Type:
Soda-Lime Dominates Cost-Sensitive VolumeSoda-lime ultra-thin products captured 46.09% of 2025 revenue and are forecast to grow at a 12.10% CAGR, underpinned by microfloat lines that hit sub-100 μm thickness at high yield. Aluminosilicate commands foldable-device covers where surface compression above 800 MPa secures 200,000 folds without cracks. Borosilicate and alkali-free glass underpin semiconductor substrates; their sub-3.5 ppm/°C expansion protects high-speed interconnects. Lithium-aluminosilicate remains a niche in HUD optics for its near-zero expansion. ISO 12543-4 durability tests favor borosilicate in automotive laminates, nudging premium OEMs upscale despite higher costs. Chinese float operators are therefore scaling soda-lime to significant production levels for mid-tier electronics, while patent-rich incumbents retain high-margin aluminosilicate and borosilicate tiers.



By Manufacturing Process:
Float Lines Scale, Fusion Draw Safeguards QualityFloat and microfloat technologies delivered 50.68% of 2025 production, and capacity expansions point to a 12.89% CAGR through 2031. The cost of a microfloat line is significantly lower than that of a fusion draw, allowing for a shorter payback period, assuming an optimal utilization rate. However, certain zero-defect applications, such as glass interposers and foldable covers, remain reliant on fusion and down-draw methods. This preference is due to the fact that in these methods, the melt never comes into contact with refractory surfaces. For instance, SCHOTT’s down-draw borosilicate achieves a thickness of 20 μm with a roughness of less than 0.5 nm. These metrics are beyond reach in the tin-bath float method, where contact results in asperities of approximately 2 nm. Meanwhile, slit-draw and roll-to-roll processes are catering to the burgeoning flexible electronics market. Notably, Corning Willow is pioneering curved OLED lighting, and Fraunhofer is coating reels for photovoltaic modules. Consequently, the choice of process has evolved into a balancing act between acceptable inclusion density and capital expenditure, leading to a segmentation in the supply base.
By Application:
Semiconductor Substrates AccelerateTouch panels represented 29.50% of 2025 revenue, but semiconductor substrates will clock a 12.20% CAGR to 2031, driven by the shift of chiplet packaging to glass. Intel's borosilicate interposers, capable of supporting TSVs and an impressive I/O density, are now replacing organic laminates, which were limited to much lower densities. With alkali-free compositions, sodium migration is effectively prevented at specific voltage biases. Additionally, SCHOTT's low-loss glass boasts a dielectric loss at high frequencies. In the automotive sector, glazing plays a pivotal role in both weight reduction and augmented reality heads-up display (AR-HUD) optics. For instance, laminated ultra-thin windshields can reduce vehicle weight, and optical combiners can enhance the field of view by doubling it. While flexible OLED lighting, microfluidics, and solar cover sheets currently represent a small portion of the market, they are poised for significant growth as roll-to-roll techniques advance.
By End-User Industry:
Automotive Gains MomentumConsumer electronics contributed 60.41% of the 2025 value, driven by the sale of smartphones and notebooks, both featuring cutting-edge ultra-thin covers, touch panels, and innovative under-display sensors. Automotive glazing is the up-and-comer, growing at an 11.99% CAGR as EV range targets push lightweight materials and EU recyclability mandates favor traceable substrates. Additionally, HUD combiners, utilizing 0.3 mm glass, not only minimize ghost images but also facilitate AR overlays. This innovation has led to orders projected to surpass millions of units annually by 2028. On a more niche front, biomedical cartridges and energy modules, though smaller in scale, are strategically significant. They harness the unique properties of glass—its impermeability and biocompatibility—to meet stringent FDA and IEC standards.
Geography Analysis
The Americas, EMEA and APAC Ultra-Thin Glass Market
Asia-Pacific delivered 49.59% of 2025 revenue, buoyed by Korean OLED investments and Chinese float retrofits that bolster economies of scale. North America’s 11.91% CAGR through 2031, fueled by the CHIPS Act's fabs and mandates for vehicle lightweighting. Major players are driving the demand for advanced packaging, while AGC’s Tlaxcala plant in Mexico supplies U.S. OEMs. Europe, holding a notable market share, is influenced by automotive glazing needs and stringent ecodesign regulations. SCHOTT’s retrofit of electric melting not only mitigates energy volatility but also reduces CO₂ emissions. Meanwhile, OEMs like BMW are adopting ultra-thin roofs to achieve a fleet target by 2027. Although South America and the MEA regions are still emerging, they stand to benefit from solar-energy initiatives, especially with a focus on 100 μm borosilicate covers post-2028.

Value Chain Analysis
The upstream chain begins with high-purity raw materials (silica sand, soda ash, limestone, alumina, and boron compounds) and extends into energy- and hardware-intensive melting assets, including platinum-rhodium furnace components for high-end chemistries. Primary ultra-thin sheet formation splits across proprietary, contact-free fusion draw and down-draw/overflow routes (used for premium foldable covers and semiconductor-grade surfaces) versus scaled float and microfloat lines that can be paired with downstream chemical thinning or etching for cost-driven volumes.
Value is created midstream through finishing and conversion steps such as precision cutting, cleaning, coating or lamination, and chemical strengthening, commonly ion exchange in molten potassium nitrate. These processes convert thin sheet into foldable covers, touch or display stacks, or optical components. Yield management and handling, particularly below 0.3 mm, remain practical bottlenecks, which pushes converters toward specialized equipment and automation. On the demand side, consumer electronics OEM and display-module ecosystems lead volume, with semiconductor packaging and automotive glazing or HUD supply chains gaining share, where qualification standards, traceability, and accelerated durability data influence supplier selection and route-to-market.
Competitive Landscape
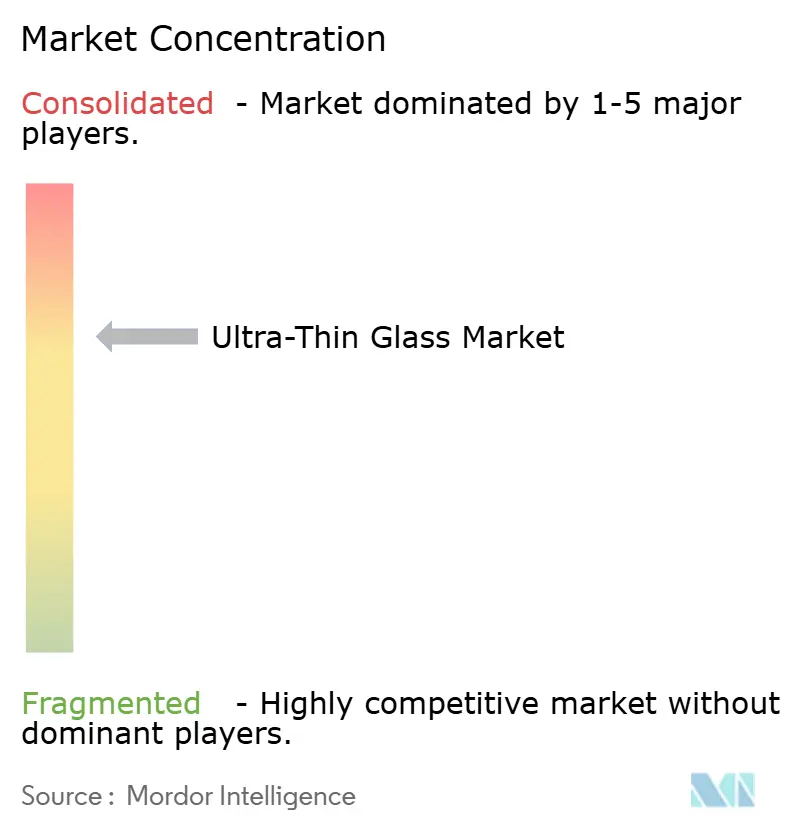
The ultra-thin glass market is consolidated. Corning’s Gorilla Armor 2 underpins an annual contract with Samsung’s flagship phones, blocking rivals from the high-visibility Android segment. Chinese firms scale microfloat capacity for cost-driven smartphones and side glazing. Compliance adds a new barrier; ISO 12543-4 durability tests and EU digital-passport rules threaten the disqualification of suppliers lacking traceability or accelerated-aging data.
Ultra-Thin Glass Industry Leaders
Corning Incorporated
AGC Inc.
SCHOTT AG
Nippon Electric Glass Co., Ltd.
CSG Holding Co., Ltd.
- *Disclaimer: Major Players sorted in no particular order
Ultra-Thin Glass Market Companies Covered in this Report
- AGC Inc.
- Central Glass Co., Ltd.
- Changzhou Almaden Co., Ltd.
- Corning Incorporated
- CSG Holding Co., Ltd.
- Emerge Glass
- Fraunhofer
- Irico Group New Energy Company Limited
- Nippon Electric Glass Co., Ltd.
- Nippon Sheet Glass Co., Ltd.
- Nitto Denko Corporation.
- OFILM
- Samsung
- SCHOTT AG
- Taiwan Glass Ind. Corp.
- Tunghsu Optoelectronic Technology
- Xinyi Glass Holdings Limited.

Market Opportunities and Future Outlook
Near-term whitespace is concentrated in scaling localized UTG supply and conversion capacity closer to display-module clusters, with the goal of reducing lead times and minimizing yield losses linked to fragile logistics and large-area handling. This is reflected in plant activity in Vietnam targeting foldable UTG supply for smartphone ecosystems, and in China where smart-factory production of ~0.12 mm flexible glass has been highlighted as a way to raise throughput through robotics-enabled processing. Together, these moves reinforce the split between high-volume, cost-focused microfloat-derived glass and premium, defect-sensitive substrates that depend on contact-free formation and advanced finishing.
Beyond foldable covers, additional opportunity pockets emerge where ultra-thin glass competes on stiffness-to-thickness, acoustic response, thermal stability, and impermeability. Nippon Electric Glass introduced the Sonarion brand (25 micrometers to 200 micrometers) for speaker diaphragms in collaboration with Glass Acoustic Innovations Co., signaling commercialization of non-display uses that still require tight thickness control and downstream shaping. On the process side, large-area formats in architectural applications depend on improved vibration-free handling and lower breakage during cutting, transport, and assembly, creating openings for equipment suppliers and converters that can evidence yields and reliability at sub-1 mm thickness.
Recent Industry Developments in Ultra-Thin Glass Market
- May 2026: Corning and BOE Technology Group signed a three-year memorandum of understanding covering collaboration areas including glass-based packaging substrates, foldable glass, perovskite glass substrates, and optical interconnect applications. The scope links ultra-thin glass to both foldable device roadmaps and emerging glass-core and substrate needs in advanced packaging, tightening ties between material suppliers and high-volume device ecosystems.
- April 2026: Nippon Electric Glass announced Sonarion as the brand for its ultra-thin glass for speaker diaphragms, spanning 25 micrometers to 200 micrometers, developed with Glass Acoustic Innovations Co. The launch broadens the commercialization pathway for ultra-thin glass beyond displays into audio components that depend on high-precision processing and consistent mechanical response. It expands NEGs product family into acoustic applications and creates potential cross-selling opportunities tied to NEGs display glass capabilities, while indicating continued diversification of ultra-thin glass applications.
- December 2024: Nippon Electric Glass began development of glass core substrates compatible with CO2 laser processing. This work supports manufacturability of glass-core approaches by aligning substrate material design with scalable laser-based processing flows used in electronics and packaging.


Ultra-Thin Glass Market Report Scope and Research Methodology
Market Definition and Coverage
This market covers revenue generated from ultra-thin glass sold for industrial and commercial use, where the glass thickness typically falls between 0.1 mm and 1 mm, and demand is tied to applications such as displays, semiconductor substrates, sensors, and automotive glazing.
Scope exclusions: regular flat glass outside the 0.1 mm to 1 mm thickness range is excluded, and downstream device retail value is excluded to avoid double counting the glass content.
Segments Covered in This Report
- By Glass Type
- Aluminosilicate (e.g., Gorilla, Dragontrail)
- Borosilicate/Alkali-Free
- Soda-Lime Ultra-Thin
- Others (Lithium-Aluminosilicate, etc.)
- By Manufacturing Process
- Fusion Draw
- Down-Draw/Overflow
- Float and Microfloat
- Slit Draw/Roll-to-Roll
- By Application
- Semiconductor Substrate
- Touch Panel Displays
- Fingerprint Sensors
- Automotive Glazing
- Other Applications (Automotive Displays and Glazing, etc.)
- By End-User Industry
- Consumer Electronics
- Automotive
- Biotechnology
- Other End-User Industries (Energy and Power, etc.)
- By Geography
- Asia-Pacific
- China
- India
- Japan
- South Korea
- Rest of Asia-Pacific
- North America
- United States
- Canada
- Mexico
- Europe
- Germany
- United Kingdom
- France
- Italy
- Rest of Europe
- South America
- Brazil
- Argentina
- Rest of South America
- Middle-East and Africa
- Saudi Arabia
- South Africa
- Rest of Middle-East and Africa
- Asia-Pacific
Data Sources, Market Sizing, and Validation
Desk Research
Desk work starts by grounding the model in measurable signals that can be checked year after year. We rely on public references such as national statistics offices for industrial production series, customs import and export data for glass and related product codes, and energy or manufacturing surveys that indicate output trends.
To keep definitions consistent, we also review sources such as International Trade Centre trade statistics, World Bank macro indicators (inflation, exchange rates, and manufacturing value add), and open technical literature and patents that describe ultra-thin glass processing routes and thickness standards. Company annual reports, investor presentations, and credible press are then used to validate capacity additions, demand cycles in electronics, and regional shipment direction. Where needed, paid subscriptions for company financials and intelligence, patent databases, and shipment-level trade records are used to close gaps without relying on single-point claims. The sources listed here are illustrative only, and many other public references were also consulted for collection, validation, and clarification.
Primary Interviews and Surveys
Primary inputs were collected through expert interviews and structured surveys across the value chain, including glass manufacturers, processors, equipment participants, and large end users in electronics and automotive. We used these interviews to confirm the thickness range applied in contracts, typical pricing movement, utilization levels, and how quickly new applications shift from pilot to volume production across APAC, EMEA, and the Americas.
Distribution of primary research fieldwork respondents
| Company type | Respondent position | Region |
|---|---|---|
| Top tier: 30% | CXOs: 14% | APAC: 42% |
| Mid tier: 51% | Functional/Unit leaders: 35% | EMEA: 31% |
| Smaller Players: 19% | Managers: 51% | Americas: 27% |
Market-Sizing & Forecasting
The sizing starts with a top-down build where production and trade signals are used to reconstruct the addressable ultra-thin glass demand pool by region, and then it is filtered by the thickness definition and the main application pull. After this structure is set, we corroborate it with selective bottom-up approximations, such as sampled price per square meter multiplied by estimated area demand for key use cases, followed by channel checks with processors and distributors.
To keep the model practical, we track a few market fingerprints closely, including average selling price by thickness band, display and touch-panel shipment trends, semiconductor packaging activity that uses glass substrates, capacity additions and utilization at fusion draw and down-draw lines, and automotive glazing adoption in premium models. When some inputs are not available consistently for a country, we bridge the gap using regional peers with a similar electronics output mix, then adjust based on interview feedback.
For forecasting, we use scenario analysis supported by short-cycle demand indicators, since consumer electronics and automotive programs can shift faster than raw material supply. Growth assumptions are stress-tested using inflation and currency timing, expected utilization normalization, and the pace at which new foldable and advanced display programs scale from early ramp to steady volumes.
Data Validation & Update Cycle
Outputs are checked against independent signals before sign-off. This includes verifying implied pricing and implied volumes do not drift away from what processors and end users describe as realistic. Variances are reviewed in multiple steps, and when a region shows an abnormal jump, we re-check the input chain for one-off capacity events, currency conversion timing, or a misapplied thickness definition.
The model is reviewed internally, and re-contact is triggered when primary inputs conflict with public capacity announcements or when trade data changes the direction of a regional flow. Reports are refreshed annually, and interim updates are made when major events occur, such as a new production line ramp, a demand shock in electronics, or a large change in input costs. Before delivery, a final pass is performed to reflect the latest available information.
Mordor Intelligence's Ultra Thin Glass Market Sizing Compared With Other Published Estimates
Different published market sizes for ultra-thin glass can appear far apart even when studies refer to the same general material, because the year, thickness cutoffs, and what gets counted as value vary from one approach to another.
The main gap comes from thickness and end-use coverage, where Mordor Intelligence treats ultra-thin glass as 0.1 mm to 1 mm and limits the value to glass revenue rather than full device value. This reduces double counting versus estimates that blend broader thin glass or downstream electronics value.
Benchmark comparison
| Source | Market Size | Gaps in Research Methodology |
|---|---|---|
| Mordor Intelligence | USD 15.71 B (2026) | |
| Global Consultancy A | USD 21.70 B (2024) | Uses a different base year and may apply a broader market construct that mixes revenue and volume reporting, which can inflate the comparable value when thickness cutoffs and application mapping are not held constant. |
| Industry Publisher B | USD 16.12 B (2025) | Uses a shorter-range application-only view with a different base year, and the slower growth path suggests a more conservative adoption curve for displays and semiconductor substrates, which shifts the mid-period market value. |
The table shows that the spread is mostly explained by definition choices and timing, rather than a disagreement that demand exists. When thickness rules, currency timing, and pricing logic are kept consistent, the resulting market value becomes easier to trace back to clear drivers like utilization, electronics output, and application adoption.


Key Questions Answered in the Report
What is the forecast revenue for ultra-thin glass by 2031?
Global consumption is USD 15.71 billion in 2026 and is projected to reach USD 26.87 billion by 2031, reflecting a 11.34% CAGR.
Which region will expand the fastest by 2031?
North America is expected to post the highest regional CAGR of 11.91% on the back of CHIPS Act semiconductor fabs and lightweight automotive glazing demand.
Which application segment is growing quickest?
Semiconductor substrates are forecast to grow at a 12.20% CAGR as chiplet packaging migrates to glass interposers.
Why is soda-lime glass still dominant despite premium chemistries?
Soda-lime maintains a 46.09% revenue share because microfloat retrofits achieve sub-100 μm thickness at lower capital intensity, keeping unit costs attractive for high-volume consumer devices.
How are recyclability rules influencing supplier choices?
EU digital-passport and end-of-life mandates are pushing OEMs toward traceable ultra-thin glass grades and suppliers that can document take-back pathways.
Page last updated on:


 Your data is secure and never sold or shared.


