Market Overview
| Study Period | 2021 - 2031 |
|---|---|
| Forecast Data Period | 2026 - 2031 |
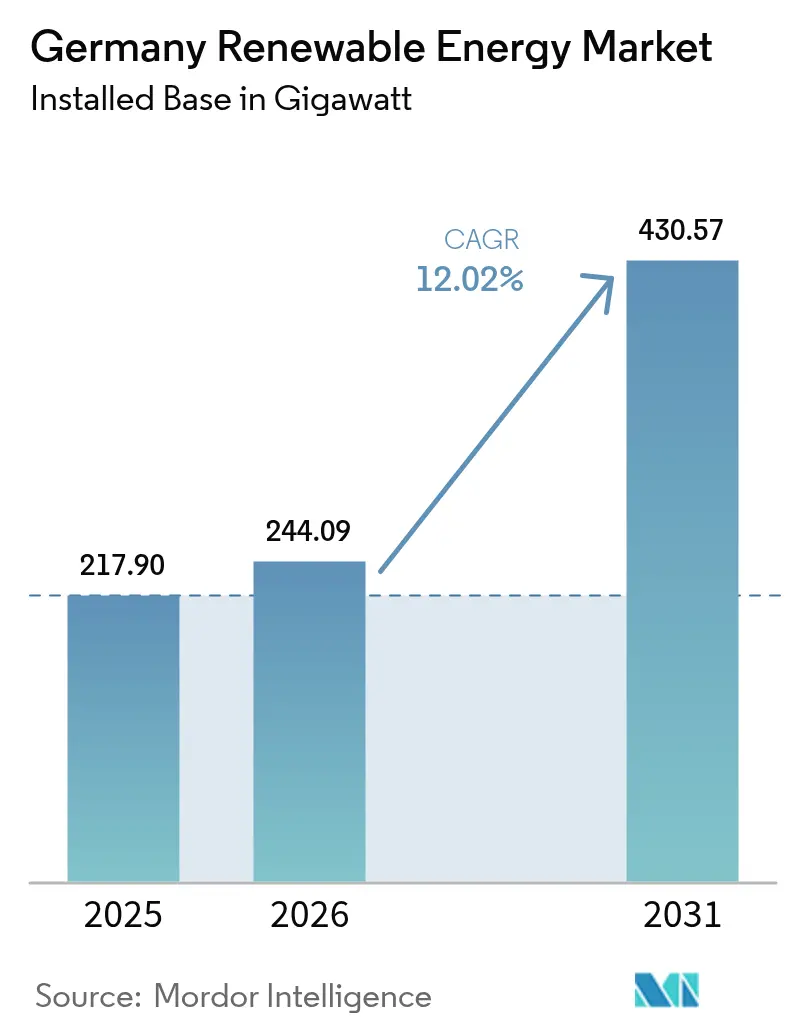
| Base Year Market Size (2025) | 217.90 gigawatt |
| Market Volume (2026) | 244.09 gigawatt |
| Market Volume (2031) | 430.57 gigawatt |
| Growth Rate (2026 - 2031) | 12.02% CAGR |
| Market Concentration | Medium |
Major Players *Disclaimer: Major Players sorted in no particular order Image © Mordor Intelligence. Reuse requires attribution under CC BY 4.0. | |
Germany Renewable Energy Market Analysis by Mordor Intelligence
The Germany Renewable Energy Market size was valued at 217.90 gigawatt in 2025 and estimated to grow from 244.09 gigawatt in 2026 to reach 430.57 gigawatt by 2031, at a CAGR of 12.02% during the forecast period (2026-2031).
Sustained policy ambition under the Renewable Energy Act (EEG 2023), lower levelized costs of solar and onshore wind, and an expanding pipeline of hybrid projects are accelerating capacity additions. Binding EU requirements under the Fit-for-55 package, together with Germany’s target of sourcing 80% of electricity from renewables by 2030, are reinforcing investor confidence and incentivizing utilities to retire lignite units ahead of schedule. Companies are scaling larger-rotor turbines and bifacial photovoltaic designs to capture economies of scale, while deep-drilling consortia unlock baseload geothermal potential in the Upper Rhine Graben. Capital is also migrating toward agrivoltaics and co-located storage, which relieve land scarcity and grid congestion. Fierce competition for grid connection slots, lingering import dependence for modules and magnets, and regional permitting hurdles remain the chief brakes on near-term build-out.
Key Report Takeaways
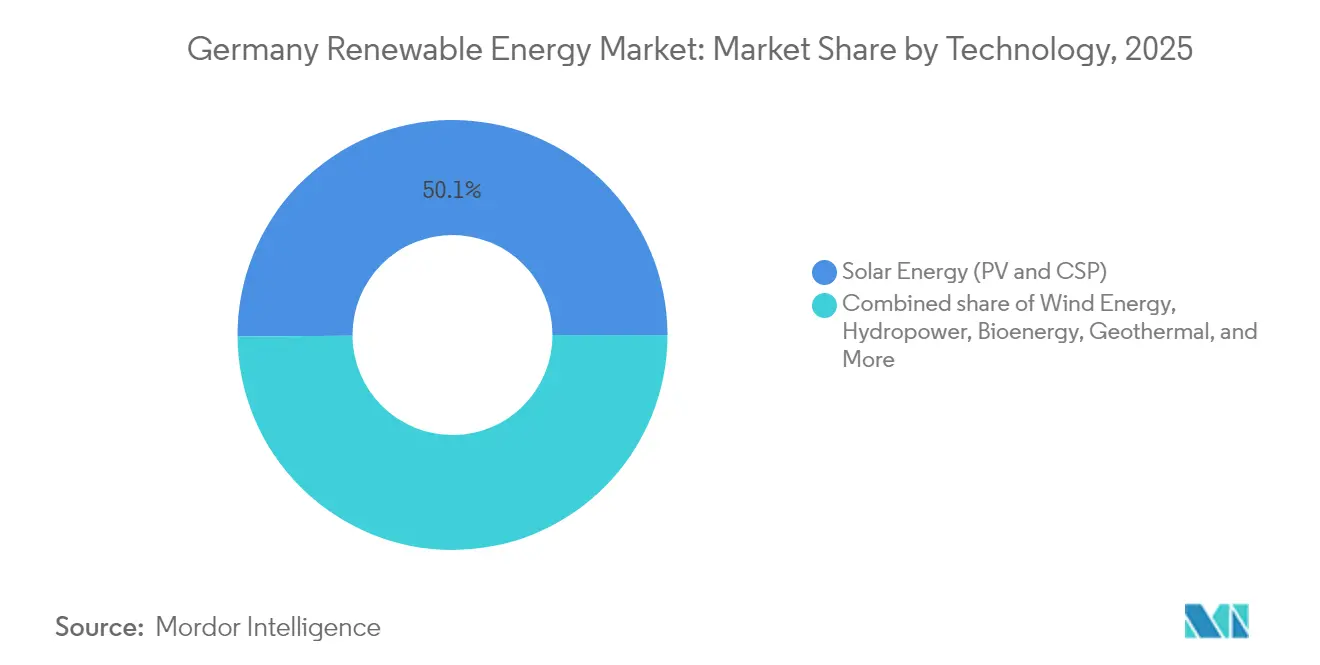
- By technology, solar energy held 50.12% of Germany's renewable energy market share in 2025 and continues to dominate installed capacity, while geothermal energy is forecast to expand at an 18.25% CAGR and leads segment growth through 2031.
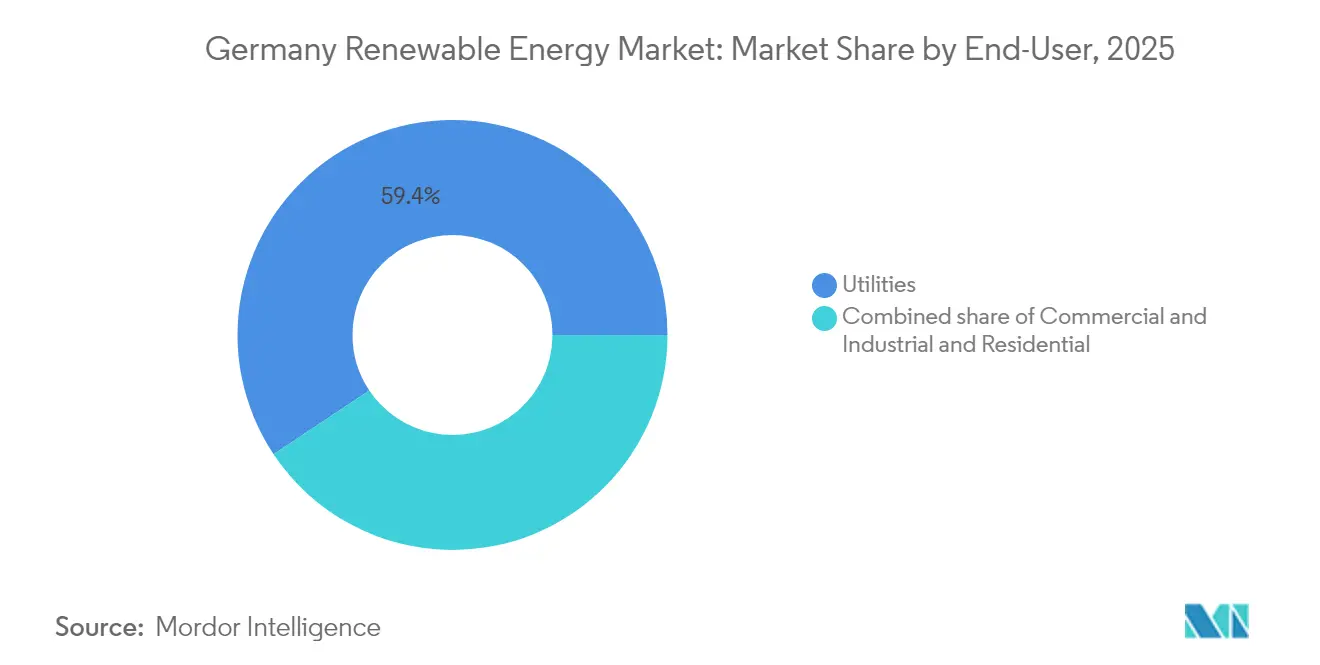
- By end-user, utilities controlled 59.35% of end-user capacity in 2025, and the segment is poised to advance at a 12.55% CAGR through 2031.
Note: Market size and forecast figures in this report are generated using Mordor Intelligence’s proprietary estimation framework, updated with the latest available data and insights as of 2026.
Germany Renewable Energy Market Trends and Insights
Drivers Impact Analysis*
| Driver | (~) % Impact on CAGR Forecast | Geographic Relevance | Impact Timeline |
|---|---|---|---|
| Federal Renewable Energy Act (EEG 2023) feed-in & auction incentives | 2.30% | Nationwide, higher uptake in Lower Saxony, Schleswig-Holstein, Brandenburg | Medium term (2-4 years) |
| EU Fit-for-55 & 80% by 2030 target | 2.10% | Nationwide, aligned with EU mandates | Long term (≥4 years) |
| Declining LCOE of solar PV & onshore wind | 1.80% | South (high irradiance) and North (high wind) | Short term (≤2 years) |
| Corporate PPAs from Mittelstand manufacturers | 1.40% | Industrial hubs in North Rhine-Westphalia, Bavaria | Medium term (2-4 years) |
| Hybrid solar-wind-storage easing congestion | 1.20% | Grid-constrained eastern regions | Medium term (2-4 years) |
| Growth of agrivoltaics programs | 0.90% | Early adoption in Baden-Württemberg, Bavaria, Rhineland-Palatinate | Long term (≥4 years) |
| Source: Mordor Intelligence | |||
Federal Renewable Energy Act (EEG 2023) Feed-in & Auction Incentives
EEG 2023 increased the solar bid ceiling to EUR 58.80 per MWh and introduced technology-neutral tenders for projects above 50 MW, channeling EUR 3.2 billion of annual investment into new capacity. [1]Bundesverband der Energie- und Wasserwirtschaft, “Ausschreibungsergebnisse 2024,” bdew.deAverage clearing prices of EUR 52.30 per MWh for solar and EUR 61.20 per MWh for wind in early-2024 auctions underscored ongoing cost deflation. Indexed rooftop feed-in premiums now float with wholesale prices, stabilizing small-scale project returns while capping public expenditure. The dual mechanism of competitive utility-scale tenders and indexed tariffs for distributed assets broadens market participation, thereby increasing market access. However, permitting backlogs delayed 2.1 GW of solar projects in 2024, highlighting execution risk. Adequate staffing of regional authorities and streamlined digital workflows remain prerequisites for translating awards into commissioned capacity.
EU “Fit-for-55” & Germany’s 80% by 2030 target
Fit-for-55 requires a 55% emissions reduction by 2030 compared to 1990, compelling Germany to shutter coal plants eight years earlier than planned and install approximately 170 GW of additional wind and solar capacity. The national Climate Protection Act, revised in 2024, incorporates the 80% renewable electricity mandate and accelerates the grid expansion of high-voltage direct-current corridors connecting North Sea wind farms to southern load centers. A EUR 20 billion DC build-out is underway, though full capacity will not be available until 2028. Carbon border adjustment tariffs taking effect in 2026 will nudge manufacturers toward domestic renewables, further boosting demand for clean power. Compliance with ISO 14064 greenhouse-gas accounting is becoming critical for exporters bidding into decarbonizing supply chains.
Declining LCOE of solar PV & on-shore wind
Utility-scale solar LCOE fell to EUR 38 per MWh in 2024, as bifacial modules and single-axis trackers increased yields by up to 20% without proportionate capital expenditure. Onshore wind dropped to EUR 42 per MWh thanks to 5.5 MW turbines sporting 170-meter rotors that enhance capacity factors in moderate-wind sites. A 150 MW merchant solar park in Brandenburg has signed a 15-year PPA at EUR 45 per MWh, which is well below the cost of gas-fired generation, illustrating the viability of subsidy-free solar energy. Converging cost curves incentivize co-located solar-wind builds that share grid connections and smooth output. Engineering firms, pressured by margin compression, are aggregating procurement to preserve scale economies.
Surge in Corporate PPAs from Mittelstand Manufacturers
Industrial buyers contracted 4.8 GW of PPAs in 2024, a 65% year-over-year increase, driven by price hedging needs and upcoming Scope 2 disclosure rules under the Corporate Sustainability Reporting Directive. Automotive, chemical, and machinery firms accounted for more than 70% of contracted volumes. Ten- to 15-year agreements transfer price risk to project sponsors, unlocking bank debt for assets outside federal auctions. A 200 MW solar portfolio in North Rhine-Westphalia reached financial close on a single-offtaker PPA, signaling growing confidence among lenders. Behind-the-meter rooftop arrays at industrial plants are increasingly complementing grid-supplied PPAs, securing renewable energy certificates and reducing transmission fees.
Restraints Impact Analysis*
| Restraint | (~) % Impact on CAGR Forecast | Geographic Relevance | Impact Timeline |
|---|---|---|---|
| Slow grid expansion & lengthy permitting | -1.90% | Nationwide, acute in Bavaria and eastern Brandenburg | Medium term (2-4 years) |
| Import dependence for PV modules & turbine components | -1.30% | Nationwide, affecting all developers | Short term (≤2 years) |
| Local wind opposition plebiscites | -0.80% | Bavaria, Baden-Württemberg, Hesse | Long term (≥4 years) |
| Land-use competition with data centers & hydrogen hubs | -0.60% | Industrial clusters in North Rhine-Westphalia, Lower Saxony | Medium term (2-4 years) |
| Source: Mordor Intelligence | |||
Slow grid expansion & lengthy permitting
Transmission operators reported a 12 GW interconnection backlog in 2024 and average lead times of 22 months for new renewable projects. The SuedLink HVDC corridor, critical for transporting North Sea wind southward, has been pushed back to a late-2028 completion date, delaying the evacuation of 4 GW of offshore capacity. Understaffed regional agencies processed only 60% of wind permits within statutory deadlines, inflating financing costs as developers carried idle capital. Developers now price in 150- to 200-basis-point risk premiums, rendering marginal projects uneconomic. Digital permitting portals and uniform federal standards remain essential to shorten approval cycles.
Import Dependence for PV Modules & Turbine Components
More than 90% of PV modules installed in 2024 originated from Asia, exposing projects to prospective EU anti-subsidy duties that could increase capital expenditure by EUR 80-120 per kW.[2]European Commission, “Fit-for-55 Package,” ec.europa.eu Rare-earth magnet quotas tightened in 2024, raising prices for turbine nacelles and heightening supply risk. Efforts to localize production, including a 1.5 GW module plant in Saxony, are expected to meet less than 15% of demand by 2026. Currency fluctuations and high freight rates further erode margins for unsubsidized projects. Diversified sourcing strategies and secondary supply contracts are becoming standard in project finance term sheets.
*Our forecasts treat driver/restraint impacts as directional, not additive. The impact forecasts reflect baseline growth, mix effects, and variable interactions.
Segment Analysis
By Technology: Solar Dominance Meets Geothermal Surge
Solar Energy accounted for 50.12% of installed capacity in 2025, confirming its central role in the German renewable energy market. Strong module supply, falling balance-of-system costs, and plentiful corporate PPAs underpin solar’s leadership. Bifacial panels on single-axis trackers enhance yields while leveraging economies of scale at utility plants above 100 MW. Co-location with storage mitigates curtailment risk and secures access to grid nodes, elevating investment returns. The segment also benefits from EEG-indexed rooftop tariffs that shield small investors from price volatility.
Geothermal, although representing a small base, is expected to post the fastest growth at an 18.25% CAGR to 2031 and increase its contribution to the German renewable energy market share as deep-drilling consortia commercialize high-enthalpy reservoirs. Cost declines in directional drilling and reservoir stimulation are compressing payback periods from five to three years. Developers target the Upper Rhine Graben and the North German Basin, areas with favorable geological gradients exceeding 120 °C at a depth of 3,000 m. Baseload heat and electricity from these resources align with district heating decarbonization and industrial steam demand, making geothermal an attractive diversification option for utilities.


By End-User: Utilities Lead As Industrial Demand Accelerates
Utilities controlled 59.35% of capacity in 2025, anchoring the Germany renewable energy market size at the asset-owner level. Their 12.55% CAGR outlook is buoyed by gigawatt-scale offshore wind, hybrid solar-storage, and expedited coal retirements. Scale advantages in procurement, financing, and grid negotiation strengthen their competitive position. Utilities are increasingly bundling renewable supply with ancillary services, such as black-start and frequency response, generating incremental revenue of EUR 15-20 per kW-year and improving project bankability. Joint ventures with industrial offtakers further diversify cash flows.
Commercial and Industrial buyers are rapidly adopting on-site solar and signing long-term PPAs to hedge against volatile power prices and satisfy Scope 2 reporting requirements. A 10 MW rooftop array at a Bavarian automotive supplier delivers electricity at EUR 50 per MWh, undercutting grid tariffs by EUR 60 per MWh. Sleeved PPAs enable corporates to contract large volumes without asset ownership, while still securing price certainty. Residential uptake is accelerating on zero-upfront leasing and virtual power plant aggregation platforms that optimize self-consumption and remunerate exported surplus. The EU Energy Performance of Buildings Directive, which mandates solar-ready roofs on new homes from 2025, is expected to add an estimated 1.5 GW per year of distributed capacity through 2030.
Geography Analysis
Germany’s northern Länder, Lower Saxony, Schleswig-Holstein, and Mecklenburg-Vorpommern, host the majority of wind and new offshore capacity, reinforcing their prominence in the German renewable energy market. High wind speeds, permissive siting laws, and proximity to North Sea lease zones attract large-scale developers. Floating foundation technologies under pilot will unlock deeper Baltic Sea sites, adding 20 GW of developable resource, balance agriculture and power production beyond 50 m depth.
Southern states, notably Bavaria and Baden-Württemberg, lag in wind deployment owing to strict setback rules, yet they rank among the leaders in agrivoltaics and rooftop solar. High irradiance and premium land values incentivize dual-use models that preserve agriculture while producing power. Corporates in these industrial hubs are key offtakers under PPAs, supporting solar-heavy build-outs despite wind limitations. Grid constraints necessitate local generation as long-distance transmission remains bottlenecked.
Eastern regions, such as Saxony-Anhalt and Brandenburg, are emerging hubs for hybrid solar-wind-storage projects that repurpose former lignite sites. Existing substations, brownfield land, and political support for structural transition ease the permitting process. Transmission upgrades under the 2024 Grid Development Plan will enhance export capacity to demand centers, integrating surplus renewable output and stabilizing wholesale prices nationwide.
Regulatory Landscape
Germanys renewable energy build-out is anchored by the Renewable Energy Act (EEG 2023). It sets statutory capacity targets for onshore wind at 84 GW by 2026 and 115 GW by 2030, alongside auction and tariff mechanisms that continue to steer utility-scale and distributed investment. The Bundesnetzagentur (BNetzA) remains central to market execution signals. In January 2026, it reported that onshore wind planning permission in 2025 reached nearly 20.8 GW, highlighting that the permitting pipeline is advancing even as project lead times remain long.
A key policy watchpoint for developers and financiers is state-aid continuity. The European Commission authorization underpinning the current EEG 2023 support system expires on December 31, 2026, increasing the need for timely follow-on arrangements to avoid a support gap for projects starting in 2027. Network cost rules are also changing, with BNetzA mandating a phase-out of decentralized generation tariffs (Section 18 StromNEV) in 25% steps from July 1, 2026, through full expiration by December 31, 2028, which shifts locational economics for distributed generation. Separately, EU Directive 2024/1788 and Regulation 2024/1789 (the Gas and Hydrogen Market Package) require implementation into German law by August 5, 2026, shaping permitting and investment conditions for sector coupling and hydrogen-linked renewable demand.
Competitive Landscape
The German renewable energy market displays moderate consolidation: the top five asset owners, RWE Renewables, EnBW, Vattenfall, Ørsted, and E.ON, control about 45% of utility-scale capacity.[4]RWE AG, “Annual Report 2024,” rwe.com Incumbents focus on gigawatt-scale offshore wind and hybrid storage portfolios to maximize grid access and balance-sheet leverage. Independent power producers like BayWa r.e., juwi, and ABO Wind thrive in the distributed and community-scale segments by bundling EPC, O&M, and financing services. White-space opportunities persist in floating offshore wind and geothermal, where installed capacity remains below technical potential.
Technology suppliers are differentiating through larger-rotor turbines and AI-enabled predictive maintenance. Siemens Gamesa’s 15 MW offshore platform, featuring 222-m rotors, cuts levelized costs and secures a 600 MW order from Vattenfall for Baltic Sea deployment.[5]Siemens Gamesa Renewable Energy, “Investor Presentation 2024,” siemensgamesa.com Nordex’s 5.5 MW onshore unit with 170-m rotors targets moderate-wind sites in Brandenburg and Mecklenburg-Vorpommern. Bifacial PV module manufacturing is expanding locally: Meyer Burger’s Saxony plant will supply 1.5 GW per year by 2026, modestly reducing import dependence.
Residential disruptor Enpal captured 12% of the rooftop segment in three years through zero-upfront leasing and bundled storage, installing 180 MW in 2024. Oil majors, such as TotalEnergies, are acquiring multi-hundred-megawatt solar pipelines to diversify their portfolios. Strategic partnerships between utilities and corporates, exemplified by EnBW’s 250 MW PPA with Mittelstand manufacturers, illustrate new financing archetypes that bypass government auctions while meeting investor ESG mandates.
Germany Renewable Energy Industry Leaders
RWE Renewables GmbH
Energie Baden-Württemberg AG (EnBW)
Vattenfall GmbH
Ørsted A/S
E.ON SE
- *Disclaimer: Major Players sorted in no particular order

Market Opportunities and Future Outlook
Opportunities concentrate where policy targets intersect with measurable build momentum and system constraints. Solar offers a near-term scale lever given Germany reached 117 GW of installed solar capacity by end-2025 and recorded PV expansion of 17.6 GW during 2025 (BDEW/EY Fortschrittsmonitor 2026), leaving room to scale toward the 2030 solar target of 215 GW. Corporate procurement also adds a bankability channel beyond federal auctions, supported by the shift toward formalized Scope 2 reporting and the continued use of long-tenor PPAs in industrial hubs such as North Rhine-Westphalia and Bavaria.
Grid and system integration create whitespace for hybridization and flexibility solutions, rather than generation-only plays. The April 2026 publication cycle around the Netzentwicklungsplan (NDP) compact scenarios, alongside ongoing build-out of major HVDC corridors, points to the need for inverter-based resources to carry more of the stability burden. This supports demand for grid-forming inverters, co-located storage, and project designs that reduce curtailment at congested nodes. Electrification is another structural demand tailwind, with official planning ranges citing gross power consumption rising from 518 TWh in 2024 to 866-1,087 TWh/year by 2037, which supports utility-led renewable portfolios serving heat pumps, EV charging, and electrolyzers, and also distributed generation models that reduce exposure to interconnection backlogs and evolving grid charges.
Recent Industry Developments
- July 2026: EnBW secured a EUR 500 million long-term loan supported by Denmarks EIFO to finance its share of the SuedLink HVDC transmission project. The transaction supports balance-sheet capacity for grid build-out that enables higher renewable absorption and reduces congestion-related project risk.
- May 2026: RWE began construction of the Manheimer Bucht solar park within the Hambach opencast mine, and it outlined an 80 MWh battery storage system to follow. Repurposing brownfield lignite assets into solar-plus-storage improves grid-node utilization and accelerates hybrid project templates in structurally transitioning regions.
- May 2024: RWE took an investment decision to build offshore wind farms with a combined capacity of 1.6 GW in Germany. The commitment increased visibility on the near-term offshore construction pipeline and supported supplier demand planning for turbines, foundations, and installation services.


Research Methodology Framework and Report Scope
Market Definition and Coverage
For this methodology, the Germany renewable energy market is defined as installed renewable power generation capacity operating in Germany, tracked in gigawatts across the main renewable technologies.
Scope exclusions: This sizing does not count fossil generation, nuclear generation, or behind the meter energy efficiency measures as part of renewable capacity.
Segmentation Overview
- By Technology
- Solar Energy (PV and CSP)
- Wind Energy (Onshore and Offshore)
- Hydropower (Small, Large, PSH)
- Bioenergy
- Geothermal
- Ocean Energy (Tidal and Wave)
- By End-User
- Utilities
- Commercial and Industrial
- Residential
Data Sources, Market Sizing, and Validation
Desk Research
We start with desk research that sets the official capacity baseline and provides the policy context behind additions and retirements. Public sources used as anchors include publications from Germany's Federal Network Agency, statistical releases from the Federal Statistical Office, energy balances from AG Energiebilanzen, market and installation datasets from IRENA, and scenario documents from the IEA.
Next, capacity build and commissioning patterns are cross checked using grid and auction information, developer and operator disclosures, and utility level filings and presentations where they are publicly available. For items that are harder to compare across technologies, we also reference paid subscriptions for company financials and intelligence, patent databases, and an import export shipment level database for selected equipment flow signals. The desk research sources listed here are not exhaustive, and many other public and paid references were used for data collection, validation, and clarification.
Primary Interviews and Surveys
To validate what is seen in public statistics, we collect direct inputs from industry participants, including renewable developers, EPCs, equipment suppliers, and grid related stakeholders. For this country market, responses were balanced across activity footprints in Germany and across different project sizes, and then used to confirm commissioning timelines, repowering behavior, and realistic build rates by technology.
Distribution of primary research fieldwork respondents
| Company type | Respondent position | Region |
|---|---|---|
| Top tier: 29% | CXOs: 12% | |
| Mid tier: 57% | Functional/Unit leaders: 36% | |
| Smaller Players: 14% | Managers: 52% |
Market-Sizing & Forecasting
Sizing is built using top-down capacity reconstruction, where the official installed base series is the starting point and then adjusted year by year using additions, retirements, and repowering signals. We corroborate totals with selective bottom-up approximations, such as sampled project pipelines, auction award to commissioning conversion checks, and typical MW additions per project type.
Key market fingerprints in this model include annual renewable capacity additions by technology, grid connection and curtailment signals, auction volumes and strike prices, repowering rates for mature wind fleets, and equipment lead times that influence commissioning timing. Where a variable is incomplete in public datasets, the gap is handled by applying conservative ranges agreed during interviews and then testing for sensitivity against the official installed base trend.
For forecasting, we use scenario analysis, because Germany capacity growth is strongly shaped by policy targets, permitting speed, and grid readiness rather than one simple historical pattern. Growth paths are reviewed against expert views on feasible build rates, and then translated into annual capacity levels that stay consistent with observed commissioning constraints.
Data Validation & Update Cycle
Outputs are checked through triangulation across independent signals, including official installed capacity series, announced commissioning schedules, and auction and grid connection indicators. When a variance looks large, we recheck assumptions, revisit units and timing, and, if needed, reconnect with respondents to understand whether a structural shift happened.
Before sign off, results pass through multi step analyst reviews where anomalies are flagged and corrected, and key assumptions are tested under alternative cases. Reports are refreshed annually, with interim updates when major policy changes, supply constraints, or grid events materially shift the outlook. Right before delivery, a fresh pass is done so clients receive the most current view available.
Mordor Intelligence's Germany Renewable Energy Market Size Versus Other Published Estimates
Published market estimates for Germany renewable energy often disagree because the unit of measurement and the scope definition are not consistent. Some studies size revenue flows in USD, while others track physical capacity in GW, and the two do not move in lockstep when prices, subsidy schemes, and project mix change.
The main gap drivers usually come from what is counted as market value, how price paths are assumed, and how often the dataset is refreshed when new auctions and commissioning data arrive. In this study, the sizing stays in installed capacity terms and follows the official installed base and annual additions logic, which keeps the total tied to what is operating on the grid. This modeling choice is applied by Mordor Intelligence.
Benchmark comparison
| Source | Market Size | Gaps in Research Methodology |
|---|---|---|
| Mordor Intelligence | USD 217.90 B (2025) | |
| Industry Publisher A | USD 47.60 B (2025) | This estimate is expressed as revenue value in USD and may include broader value chain spend and pricing assumptions, which can diverge from installed capacity tracking in GW for the same year. |
| Industry Publisher B | USD 32.55 B (2024) | This figure is for a different base year and is likely a revenue based view, so differences can come from year selection, currency conversion timing, and how technology scope and project services are treated. |
The table shows that the spread is largely explained by unit choice, year alignment, and what is treated as market value versus what is treated as operating capacity. When users need a number that can be traced back to commissioning and installed base movements, the capacity approach is easier to reproduce and verify with public series and targeted expert checks.


Key Questions Answered in the Report
How large is the Germany renewable energy market in 2026?
Installed capacity stands at 244.09 GW, on course to reach 430.57 GW by 2031.
What is the expected CAGR for renewables in Germany through 2031?
Capacity is forecast to expand at a 12.02% CAGR over 2026-2031.
Which technology leads in installed capacity?
Solar Energy leads with 50.12% of total capacity in 2025.
Which segment is growing fastest?
Geothermal capacity is projected to rise at an 18.25% CAGR through 2031.
Why are corporate PPAs important in Germany?
PPAs let manufacturers hedge electricity prices and meet scope-2 disclosure rules while enabling developers to secure project finance.
What remains the biggest barrier to faster build-out?
Grid interconnection backlogs and slow permitting add up to 22 months of delay for many projects.
Page last updated on:


