
Germany Organic Waste Collection Services Market Size and Share
Market Overview
| Study Period | 2020 - 2031 |
|---|---|
| Forecast Data Period | 2026 - 2031 |
| Base Year Market Size (2025) | USD 0.79 Billion |
| Market Size (2026) | USD 0.83 Billion |
| Market Size (2031) | USD 1.07 Billion |
| Growth Rate (2026 - 2031) | 5.26% CAGR |
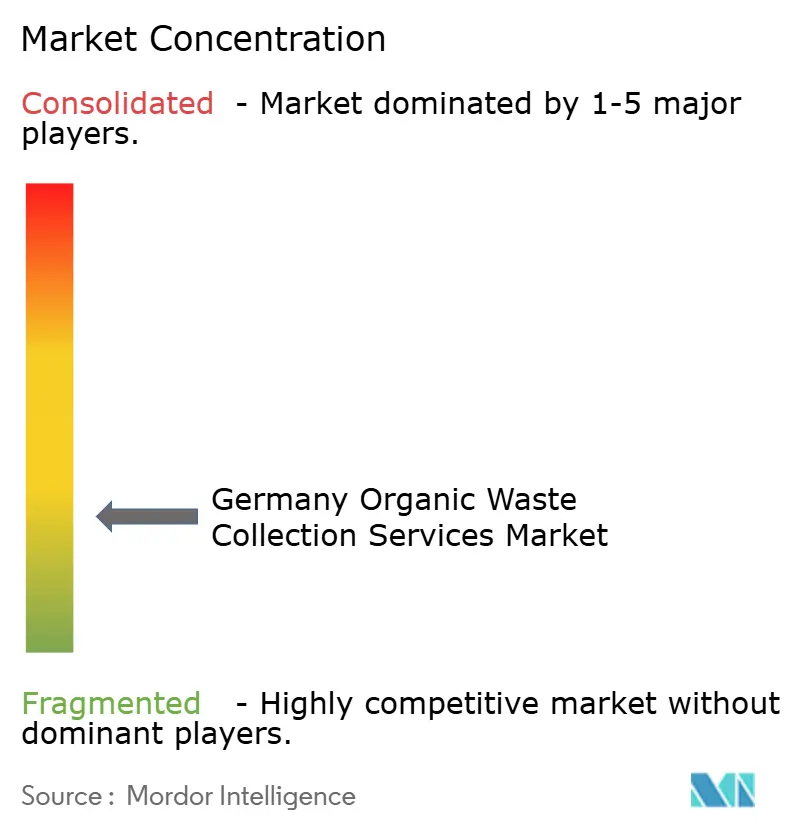
| Market Concentration | Low |
Major Players *Disclaimer: Major Players sorted in no particular order Image © Mordor Intelligence. Reuse requires attribution under CC BY 4.0. | |
Germany Organic Waste Collection Services Market Analysis by Mordor Intelligence
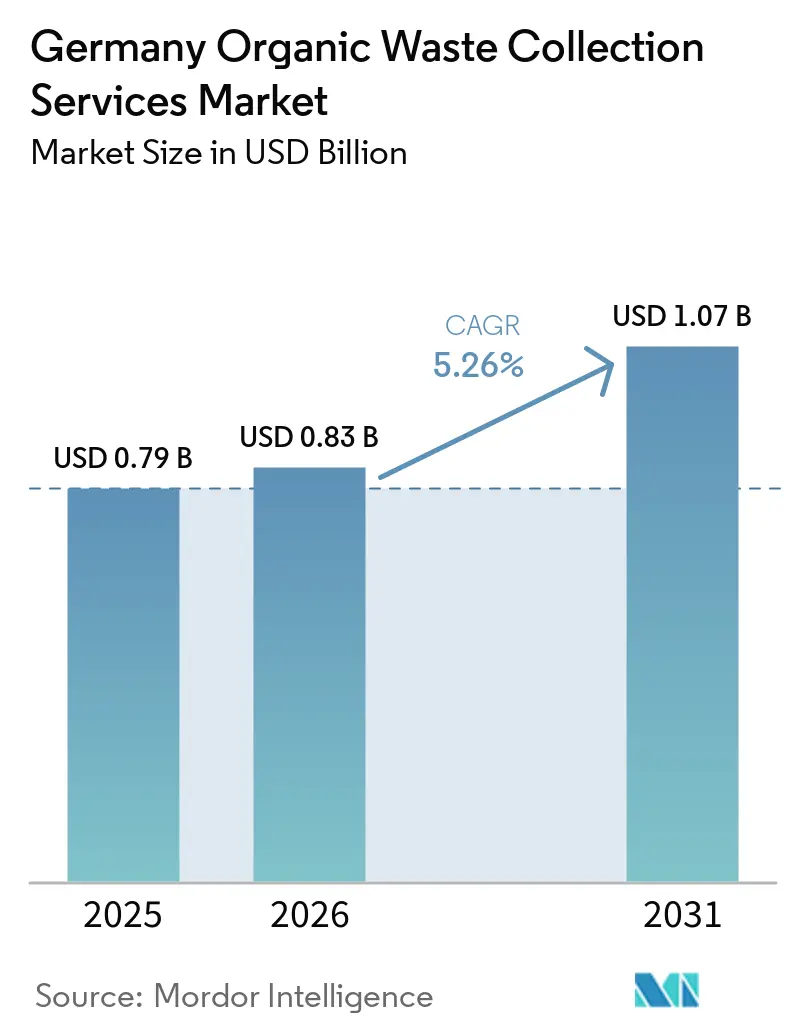
The Germany Organic Waste Collection Services Market size is projected to be USD 0.79 billion in 2025, USD 0.83 billion in 2026, and reach USD 1.07 billion by 2031, growing at a CAGR of 5.26% from 2026 to 2031.
Regulatory tightening under the revised Biowaste Ordinance is reshaping operations. Processors now enforce strict contamination thresholds through load rejections and penalties, pushing collection operators to invest in pre-sorting and depackaging technology to preserve contract value and maintain gate-fee economics. Municipal expansion of brown-bin infrastructure varies across states, creating performance gaps between mandatory and voluntary collection regimes. It is affected by the legacy footprint of incineration plants, which can crowd out separate collections in some districts. Growing biogas and compost capacity increases demand for high-quality feedstock. Collection operators that deliver clean substrates gain stable contracts, while contamination triggers load rejections and penalties from processors. Competitive pressure is strongest where vertically integrated players combine collection with digestion and composting assets. Mid-sized regional firms face margin pressure from quality compliance and rising logistics costs that erode route economics. The market continues to shift from volume-led growth to quality-led performance, driven by policy incentives, municipal tender criteria tied to contamination results, and the broader decarbonization agenda that values biomethane and high-grade compost as strategic outputs.
Key Report Takeaways
- By waste type, yard and landscape waste led with 48.2% of Germany organic waste collection services market share in 2025, while pre- and post-consumer food waste is forecast to expand at a 7.41% CAGR to 2031.
- By end-user, the residential segment accounted for a 73.1% share in Germany organic waste collection services market size 2025, while the commercial segment recorded the highest projected CAGR at 7.92% through 2031.
- By collection method, door-to-door collection held a 76.4% share in 2025 and is projected to be the fastest-growing method at a 6.58% CAGR through 2031.
- By technology and equipment, semi-automated systems commanded a 79.2% share in 2025, while fully automated systems are projected to grow at a 7.62% CAGR through 2031.
Note: Market size and forecast figures in this report are generated using Mordor Intelligence’s proprietary estimation framework, updated with the latest available data and insights as of January 2026.
Germany Organic Waste Collection Services Market Trends and Insights
Drivers Impact Analysis*
| Driver | (~) % Impact on CAGR Forecast | Geographic Relevance | Impact Timeline |
|---|---|---|---|
| Biowaste Ordinance (BioAbfV) Tightening Quality of Input Streams | +1.4% | National, with stricter enforcement in Bavaria, Baden-Württemberg, and North Rhine-Westphalia | Medium term (2-4 years) |
| Circular Economy Act (KrWG) Driving Recycling Over Disposal | +1.2% | National | Long term (≥ 4 years) |
| Municipalities Expand "Brown Bin" Infrastructure for Biowaste | +1.0% | National, spillover gains in Brandenburg, Thuringia, and city-states with below-average coverage | Short term (≤ 2 years) |
| Biogas & Compost Integration into Germany's Renewable Energy Mix | +0.9% | National, concentrated in Baden-Württemberg, Bavaria, and Lower Saxony | Medium term (2-4 years) |
| Strong Municipal Role in Waste Collection | +0.5% | National | Long term (≥ 4 years) |
| High Household Participation in Waste Segregation | +0.3% | National, peak performance in Schleswig-Holstein, Hessen | Medium term (2-4 years) |
| Source: Mordor Intelligence | |||
Biowaste Ordinance (BioAbfV) Tightening Quality of Input Streams
The May 2025 amendment to Germany's Biowaste Ordinance established binding contamination thresholds and gave processors explicit authority to reject non-compliant loads, transferring quality risk upstream to collection operators. This forces operators to deploy optical sorting, depackaging, and bin-screening systems to preserve gate acceptance and avoid costly re-routing to residual streams. Pilot audits show that microplastic contamination in finished compost rises when collection purity slips. This jeopardizes soil-application approvals and triggers rework costs, directly harming collection route profitability through rejected loads and penalty fees. Municipal responses vary by district, with some authorities banning biodegradable plastic bags in brown bins and others implementing bin inspections and staged penalties before non-collection, creating uneven compliance costs across service footprints. Operators that invested early in depackaging systems gained a competitive advantage by meeting stricter processor acceptance standards and avoiding load rejections. The market is therefore moving toward quality assurance as a central performance lever where traceability, inspection, and technology integration decide margins more than tonnage growth. Enforcement heterogeneity will persist as some municipalities tighten inspections faster than others, sustaining regional cost differentials that shape near-term bidding strategies.
Circular Economy Act (KrWG) Driving Recycling Over Disposal
Germany’s Circular Economy Act establishes a five-tier hierarchy that prioritizes prevention and recycling over energy recovery and landfill, and mandates separate collection of organic waste, which continues to push municipalities to expand brown-bin access and improve source separation. The National Circular Economy Strategy, adopted in 2024, reinforced this direction by targeting a 10% per-capita reduction in municipal waste by 2030. Recent balances show household organic waste rose to 10.7 million tonnes in 2024, up 5.9% from 2023, confirming organic separation as a fast-growing municipal fraction by weight. Emissions trading increases the cost of non-segregation for local authorities because residual-waste incineration can require certificates, adding cost to routes that lack effective diversion of organics. Packaging reform is indirectly supportive because higher recycling expectations increase the salience of correct sorting at home, which can reduce foreign-material inflows into organic bins when communication is effective.[1]Zentrale Stelle Verpackungsregister, “Recycling starts with sorting,” verpackungsregister.org Annual municipal reporting also keeps pressure on laggards by publicizing separation rates, nudging investment into container fleets, and promoting public education and route density where returns are visible. The market benefits from this policy alignment over a multi-year horizon because long-lived container and fleet investments lock in capability and scale effects around separation and purity.
Municipalities Expand "Brown Bin" Infrastructure for Biowaste
Brown-bin access remains a decisive factor in performance, with many municipalities enforcing mandatory participation, others offering voluntary systems, and a remaining minority still lacking comprehensive coverage, leaving millions of residents outside formal organic collection and constraining diversion gains in those districts. Where brown bins are mandatory, household connection rates and per-capita capture are materially higher than in voluntary regimes, creating a revenue and tonnage stability gap that influences how operators price municipal tenders and choose deployment models. Incineration plant footprints shape adoption patterns because districts operating waste-to-energy facilities often show lower per-capita organic capture, signaling structural lock-in that municipalities must unwind as carbon pricing increases. Modernization of billing and verification is accelerating through approaches such as transponder-equipped bins for electronic tracking and property-level billing, which can streamline emptying verification and reduce administrative costs. Municipal service agreements increasingly define expectations for contamination limits, may include penalties linked to processor rejections, formalize quality assurance within route economics, and encourage bin inspections to maintain purity. Pay-as-you-throw coverage remains far from universal, so many authorities rely on mandatory-bin rules and communication campaigns to sustain separation gains.
Biogas & Compost Integration into Germany's Renewable Energy Mix
Biogas and compost capacity have deepened their role in Germany’s energy and soil systems as biomass-based electricity remains a significant contributor to the grid, and operators process large volumes of organic substrates under quality controls that condition gate acceptance on low contamination levels. New biomethane projects and expected additional grid injections over the medium term tighten the linkage between collection quality and digester uptime. Policy frameworks that recognize renewable gas in heating and industrial applications support a medium-term demand vector that depends on feedstock reliability and cost, even as electrification technologies remain prominent in new construction. District heating partnerships add another vector by integrating waste heat into municipal networks, supporting decarbonization goals through a stable, local energy supply. Incentive structures have been evolving to reward more flexible and demand-responsive generation, elevating the operational premium for consistent, low-contamination feedstock that limits downtime and curtails penalties at the plant gate. Compost outputs remain large, and quality standards and fertilizer rules effectively exclude plastic contamination, so collection practices that strictly limit foreign material preserve downstream marketability to agriculture. This integration reinforces the market’s role as a feedstock gatekeeper whose quality discipline directly affects revenue continuity in energy and soil outlets.
Restraints Impact Analysis*
| Restraint | (~) % Impact on CAGR Forecast | Geographic Relevance | Impact Timeline |
|---|---|---|---|
| Contamination in Collected Organic Waste Streams | -1.1% | National, acute in urban high-density areas and districts, with voluntary participation | Short term (≤ 2 years) |
| High Collection & Logistics Costs | -0.9% | National, disproportionate burden in rural and low-density regions | Medium term (2-4 years) |
| Limited Economic Viability in Rural Regions | -0.7% | Brandenburg, Mecklenburg-Western Pomerania, Thuringia, Saxony-Anhalt | Long term (≥ 4 years) |
| Limited Standardization of Collection Practices Across Municipalities | -0.5% | National fragmentation across 400 independent districts | Long term (≥ 4 years) |
| Source: Mordor Intelligence | |||
Contamination in Collected Organic Waste Streams
Plastic contamination remains the primary quality constraint for processors, and controls continue to exhibit notable rejection rates, underscoring the need for strict enforcement and improved sorting at source. The ordinance reduced acceptable plastic levels in household biowaste to 1%. It empowered plants to reject loads with more than 3% foreign material, shifting financial risk to operators who must either add pre-treatment or absorb re-routing costs. Jurisdictions have increased enforcement with inspections and penalties that escalate from warnings to non-collection, showing that visible deterrents can improve compliance. Other districts rely on non-collection for contaminated bins and charge residual-waste fees for subsequent disposal, shifting responsibility to households and businesses but potentially raising friction with ratepayers. Removing foreign material often results in a meaningful share of the organic fraction being lost as collateral, worsening value capture for processors and emphasizing curb-side prevention over plant-based remediation. As compostable packaging rules phase in over time, systems must still keep non-accepted materials out of organic bins to protect downstream quality certifications and agricultural acceptance.
High Collection & Logistics Costs
Operators face overlapping cost pressures from carbon pricing on residual-waste incineration, changes to vehicle tolls, fuel inputs, and labor tariffs, amplifying the cost of specialized organic routes that require high participation to reach efficient density. Higher carbon costs increase urgency for municipalities to improve separation so residual streams do not burden budgets.[2]European Environment Agency, “Germany, Waste Management Country Profile,” eea.europa.eu Districts have responded by revising fee schedules and service models that reflect capital intensity and route costs across container sizes and collection frequencies. Route economics are toughest in rural and low-density regions where participation and capture per kilometer are lower. At the same time, urban districts can justify a higher seasonal frequency to minimize odor complaints and contamination risk. Technology mitigations continue, including pilots with electric trucks and alternative fuels, but payload and infrastructure constraints still limit broad deployment on wet organic routes, so most operators pursue incremental upgrades rather than wholesale fleet conversions. Cost relief will remain uneven, with larger vertically integrated players better able to amortize technology across multi-district portfolios compared with smaller contractors serving single-municipality footprints.
*Our forecasts treat driver/restraint impacts as directional, not additive. The impact forecasts reflect baseline growth, mix effects, and variable interactions.
Segment Analysis
By Waste Type: Food Waste Drives Incremental Growth Despite Yard-Waste Dominan
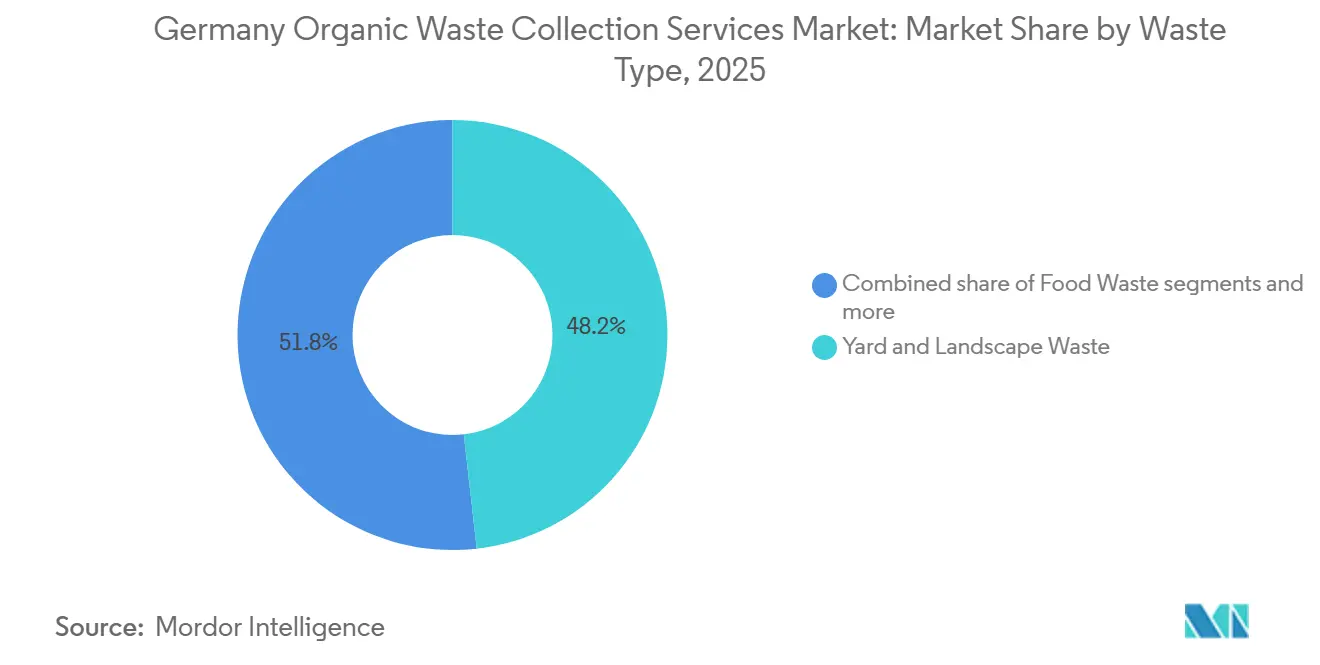
Yard and landscape waste held 48.2% of the market share in 2025, while pre- and post-consumer food waste is projected to grow at a 7.41% CAGR through 2031, outpacing the overall expansion rate and signaling a gradual shift in the composition of collected waste. The market benefits from clearer rules and enforcement around packaged food waste that push more commercial volumes into depackaging lines before digestion, and operators that invest in such capabilities experience fewer rejections and more stable plant acceptance. Household organics have grown in recent balances, but yard-waste seasonality constrains further volume gains relative to food waste. Composters continue to blend green waste with biowaste to maintain stable processing characteristics, and quality controls increasingly police contamination to protect soil outlets that remain essential for market stability. As digester operators demand more consistent, high-energy-density substrates, commercial food waste becomes a more attractive target, provided depackaging performance holds contamination below mandated control values.
Across municipalities, policy still influences composition through brown-bin access, communications, and frequency schedules that support clean capture of both food and yard streams. Agricultural residues represent a smaller but growing segment, driven by commercial collection from urban agriculture projects, peri-urban farms participating in municipal organics programs, and institutional composting partnerships. Large-scale agricultural waste from rural operations typically remains outside municipal tender systems, is processed through on-farm digesters, and is then directly land-applied. The municipal-adjacent agricultural collection is forecast to expand as circular-economy frameworks incentivize the integration of diverse organic feedstocks into regional biogas and composting infrastructure. Food waste will likely continue to outpace yard waste because revenue models at biogas plants favor its methane yield, and expanding biomethane injection capacity pulls in consistent feedstock from commercial accounts that meet strict contamination rules. This shift can also help protect compost quality by steering the most contamination-prone, plastic-laden inputs into pre-treated digestion routes where depackaging is standard, limiting plastic carryover into composted material and maintaining downstream farm acceptance. The market, therefore, aligns its waste-type mix with energy and soil end-markets, using quality controls to allocate volumes where they generate the best value.



By End-User: Commercial Food-Service Acceleration Reshapes Revenue Mix Amid Residential Stability
Residential end-users accounted for 73.1% of 2025 activity, supported by widespread brown-bin programs and generally high connection rates where participation is mandatory. The fastest growth is in the commercial food service segment, projected at a 7.92% CAGR through 2031, driven by tighter separation requirements, stronger compliance oversight, and sustainability targets that formalize previously ad hoc arrangements. The market is seeing more contracts from restaurants, hotels, supermarkets, and institutional kitchens as handling requirements for food waste and transport tracking shift from guidance to enforcement. Industrial food processors contribute steady volumes with relatively reliable composition that digester operators value, and longer-term acceptance arrangements can reduce revenue volatility for collectors who serve these sites. Agricultural and other small categories remain marginal in municipal systems, keeping the commercial food-service vector as the main swing factor, diversifying revenue beyond residential accounts.
Enforcement rigor remains the driver of commercial growth as municipalities pilot technology-enabled bin inspections and collection controls that can extend to business premises, prompting more customers to adopt contracted service under clear quality terms. This approach supports more reliable plant acceptance because commercial sources can adapt faster than dispersed households to separation rules that protect digester uptime and compost quality certifications. The market benefits from predictable volume and stronger contamination control when commercial accounts are onboarded under auditable protocols, improving route economics and stabilizing processor relationships. Residential volumes remain the anchor, but marginal growth shifts to commercial streams where policy and technology reduce non-compliance risk and improve collection efficiency. Over time, mixed municipal-commercial portfolios help operators smooth yard-waste seasonality and rely more on year-round food waste that supports steadier digester operations.
By Collection Method: Door-to-Door Dominance Persists Despite Drop-Off Cost Advantages
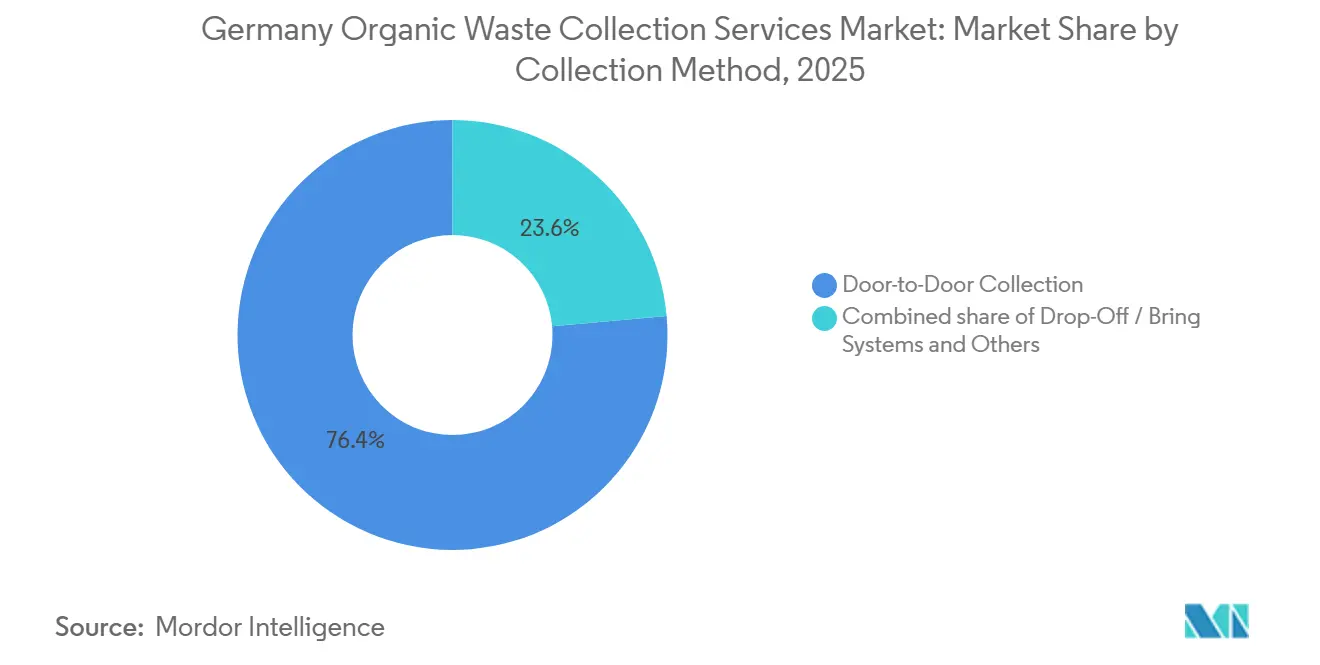
Door-to-door collection commanded 76.4% of the market share in 2025 and is projected to expand at a 6.58% CAGR through 2031 as coverage extends to previously underserved districts and service-level upgrades improve capture and purity. Drop-off or bring systems remain in niche use where curbside routing is uneconomical. Still, they typically underperform on connection and capture rates compared with mandatory curbside service, slowing adoption outside rural exceptions. The market favors door-to-door models because convenience correlates with participation, supporting higher per-capita capture and reducing costs associated with residual disposal and incineration. Urban districts can adjust frequency during peak seasons to reduce odor and contamination risk, while curbside mandates sustain route density to support cost recovery within municipal fee structures.
Collection contracts increasingly link performance to contamination and connection outcomes, aligning incentives with door-to-door systems that can incorporate screening at the bin and inspection at the tipping facility. Consistent curbside purity reduces rejections and preserves gate-fee outcomes at digestion and compost sites. Bring systems do not scale as well for quality control because sporadic deliveries complicate inspection and feedback loops with households, underscoring why many municipalities standardize curbside services once budgets permit. Where route density is low, authorities may combine bring points with targeted curbside routes for population clusters. Still, the long-term trajectory remains toward broader curbside coverage that supports diversion targets and more transparent billing.
By Technology & Equipment: Semi-Automated Systems Retain Share Amid Incremental Automation Gains
Semi-automated systems accounted for 79.2% of 2025 deployments as the installed base of compatible containers and lifts anchors municipal fleets, while fully automated systems are projected to grow at a 7.62% CAGR as new tenders specify labor reduction and sensor integration to control costs and improve quality verification. Manual systems persist in dense historic cores and constrained access areas where vehicle size and maneuvering are limited, but safety and labor economics favor mechanized lifts that reduce crew size and injury risk. The use of electronic transponders is scaling in semi-automated fleets to enable property-level tracking, automated billing, and audit trails of emptying events, improve route data, and discourage unauthorized use. The market is also seeing broader adoption of technology-enabled contamination detection that can overlay on existing lift systems without requiring a full transition to robotic-arm vehicles, making quality improvements more affordable than a complete fleet replacement.
Fully automated systems grow from a smaller base and fit best in newer neighborhoods and greenfield contracts. Still, many municipalities will continue to cycle through semi-automated platforms until container replacement and street-access planning justify the use of arm-based vehicles. Fleet electrification adds complexity to wet organics due to heavier payloads and battery mass, so pilots often prioritize lighter routes, while alternative fuels can bridge heavier-route needs. Market growth provides room for technology refresh, but most operators' time investments are tied to regulatory triggers on contamination and to tender requirements that reward digital verification and quality outcomes. Over the forecast window, semi-automated remains the workhorse, while automation and digital inspection layers shape competitive differentiation in quality control and labor productivity. This pathway keeps capital intensity manageable without sacrificing compliance performance.
Geography Analysis
Regional patterns reflect policy choices and infrastructure legacies, with western and southern states anchoring 2025 volumes and connections while parts of the east grow from lower baselines as mandates and coverage accelerate. Some states show high per-capita capture, indicating mature saturation. At the same time, several eastern regions and city-states remain below national averages due to incomplete rollouts, denser housing stock, and legacy incineration capacity that historically reduced incentives for separate collection. Urban fee schedules and service design choices influence participation and quality, including provisions that encourage correct disposal behavior and reduce contamination in organic bins.
Growth through 2031 will likely concentrate in underserved eastern districts as brown-bin programs expand, with incremental gains also in commercial corridors of western metros where enforcement intensifies. National waste balances indicate household organic waste has been rising year over year, suggesting late adopters are catching up, even if reporting varies by state. The market will remain geographically heterogeneous due to local governance and budget cycles, but statewide policy initiatives and municipal procurement terms tied to contamination metrics are expected to align outcomes gradually. Competitive dynamics differ across regions because incumbents retain depots and relationship capital. Still, districts with low prior coverage offer more room for large operators to establish routes and integrate with nearby digestion facilities. Municipalities that prohibit certain bags and emphasize proper bin use often achieve faster purity gains, supporting expansion into downstream markets where quality standards are strict.
Municipal modernization supports convergence across geographies as authorities deploy bin transponders, technology-enabled inspections, and refined fee models that tie service charges to emptying verification and contamination outcomes. These changes increase predictability by reducing unauthorized use, preventing curb contamination, and supporting data-driven contract management. As district heating networks expand, municipalities and utilities can partner with waste operators to leverage the energy content of organic waste and recover useful heat, embedding organic collection within a broader decarbonization plan beyond waste diversion alone. Over time, these factors can reduce regional gaps in quality, capture, and downstream acceptance that currently characterize the market.
Competitive Landscape
The Germany organic waste collection services market is fragmented across many municipal authorities. Yet, national players with vertical integration exert outsized influence where they align curbside routes with digestion and composting assets. Municipal tendering practices often favor incumbents that maintain depots, container stock, and workforce in place, which can entrench regional oligopolies and raise switching costs for authorities. The enforcement of contamination thresholds shifted competition from pure routing efficiency toward contamination control and digital verification, enabling operators who deploy inspection systems, advanced sorting, and depackaging capabilities to reduce rejection risk and improve plant acceptance outcomes. Technology partnerships are part of differentiation, with some pilots using camera-supported evidence and automated feedback loops to reduce curb contamination. Vertical integration with renewable energy outlets adds another lever, as operators can balance contracting with municipal authorities and energy partners that rely on consistent feedstock quality to maintain uptime and delivery commitments.
Smaller regional firms defend their share in rural and mid-sized districts through local relationships and route know-how. Still, higher compliance burdens on contamination and rising vehicle and labor costs compress margins unless they adopt inspection and electronic verification. Fleet modernization signals divergence as larger players trial low-emission trucks where payload and route design permit. At the same time, alternative fuels can help bridge heavy-duty route needs for wet organics until electric platforms meet payload requirements and depot charging matures.[3]Veolia Holding Deutschland GmbH, “KI-gestützte Biomüll-Kontrolle, Pforzheim,” veolia.de Route expansions through multi-district tenders deepen density advantages for firms that can amortize analytics and inspection technology across portfolios, which risks widening the capability gap where small contractors serve single-district routes without economies of scale. These shifts reward compliance infrastructure and digital audit trails as tender prerequisites, including ISO-aligned environmental and safety management systems.
Strategic moves highlight three themes. First, horizontal growth through contract wins can increase route density and local employment by expanding municipal service scope. Second, vertical integration and energy partnerships, including district heating collaborations, can embed waste operators in municipal decarbonization plans. Third, closed-loop fuel strategies and alternative fuels can lower fossil fuel exposure on heavy routes and create a cost hedge as regulatory prices carbon more steeply, potentially making them a differentiator in future tenders. These moves hinge on quality assurance because contamination penalties and load rejections directly impair revenue realization in the market.
Germany Organic Waste Collection Services Industry Leaders
REMONDIS SE & Co.
PreZero Stiftung & Co. KG
Veolia Environnement S.A.
Landbell Group GmbH
SUEZ Group
- *Disclaimer: Major Players sorted in no particular order

Recent Industry Developments
- February 2026: Veolia initiated an AI-based biowaste control pilot integrating cameras to document bin contents during tipping and automate citizen feedback when contamination is detected.
- January 2026: Stadt Heilbronn approved a collection system reform introducing transponder-equipped bins for electronic tracking and property-based billing.
- November 2025: ALBA Group and Stadtwerke Ludwigslust-Grabow formalized a district heating project to deliver waste heat into the municipal network from 2028.
- September 2025: Veolia expanded services in Landkreis Schweinfurt to include residual, organic, and paper-cardboard collection under a multi-year contract.


Germany Organic Waste Collection Services Market Report Scope
The Germany Organic Waste Collection Services Market is Segmented by Waste Type (Food Waste, Yard & Landscape Waste, and more), by End-User (Residential, Commercial, and more), by Collection Method (Door-to-Door Collection, Drop-Off / Bring Systems, and Others), and by Technology & Equipment (Manual Collection Systems, Semi-Automated Systems, and more). The Market Forecasts are Provided in Terms of Value (USD) and Volume (Tons).
| Food Waste (Pre and Post Consumer) |
| Yard & Landscape Waste |
| Agricultural Residues |
| Others |
| Residential |
| Commercial (HoReCa, Retail) |
| Industrial (Food Processing & Manufacturing) |
| Others (Agri-waste) |
| Door-to-Door Collection |
| Drop-Off / Bring Systems |
| Others |
| Manual Collection Systems |
| Semi-Automated Systems |
| Fully Automated Systems |
| Others |
| By Waste Type | Food Waste (Pre and Post Consumer) |
| Yard & Landscape Waste | |
| Agricultural Residues | |
| Others | |
| By End-User | Residential |
| Commercial (HoReCa, Retail) | |
| Industrial (Food Processing & Manufacturing) | |
| Others (Agri-waste) | |
| By Collection Method | Door-to-Door Collection |
| Drop-Off / Bring Systems | |
| Others | |
| By Technology & Equipment | Manual Collection Systems |
| Semi-Automated Systems | |
| Fully Automated Systems | |
| Others |


Key Questions Answered in the Report
What is the current size and growth outlook of the Germany organic waste collection services market?
The Germany organic waste collection services market size is expected to increase from USD 0.79 billion in 2025 to USD 0.83 billion in 2026 and reach USD 1.07 billion by 2031, at a 5.26% CAGR over 2026-2031.
Which factors most influence demand in Germany’s organic waste collection?
Enforcement of the Biowaste Ordinance, expansion of brown-bin coverage, and integration with biogas and compost end-markets drive demand by linking gate-fee economics to contamination thresholds and reliable feedstock quality.
Which segments are growing the fastest within Germany’s organic waste collection?
Driven by tighter separation rules and digital inspection pilots that formalize service contracts, the commercial segment is set to experience the fastest growth, projected at a 7.92% CAGR.
How do collection methods compare on performance and cost?
Door-to-door collection holds 76.4% share and leads growth at a 6.58% CAGR due to higher participation and capture, while bring systems cost less per stop but lag on tonnage because participation rates are lower.
What technologies are most used in German organic waste collection today?
Semi-automated systems lead with a 79.2% market share, as fully automated arms and AI-driven bin inspections gain traction, enhancing labor productivity and bolstering contamination control.
How do regional differences affect service providers in Germany?
Western and southern states show mature coverage and higher per-capita capture, while parts of the east are growing from lower baselines as mandates expand; city-states lag due to dense housing and historic incineration capacity.
Page last updated on:






