GCC Electric Vehicle Charging Infrastructure Market Size and Share
Market Overview
| Study Period | 2019 - 2030 |
|---|---|
| Forecast Data Period | 2025 - 2030 |
| Historical Data Period | 2019 - 2023 |
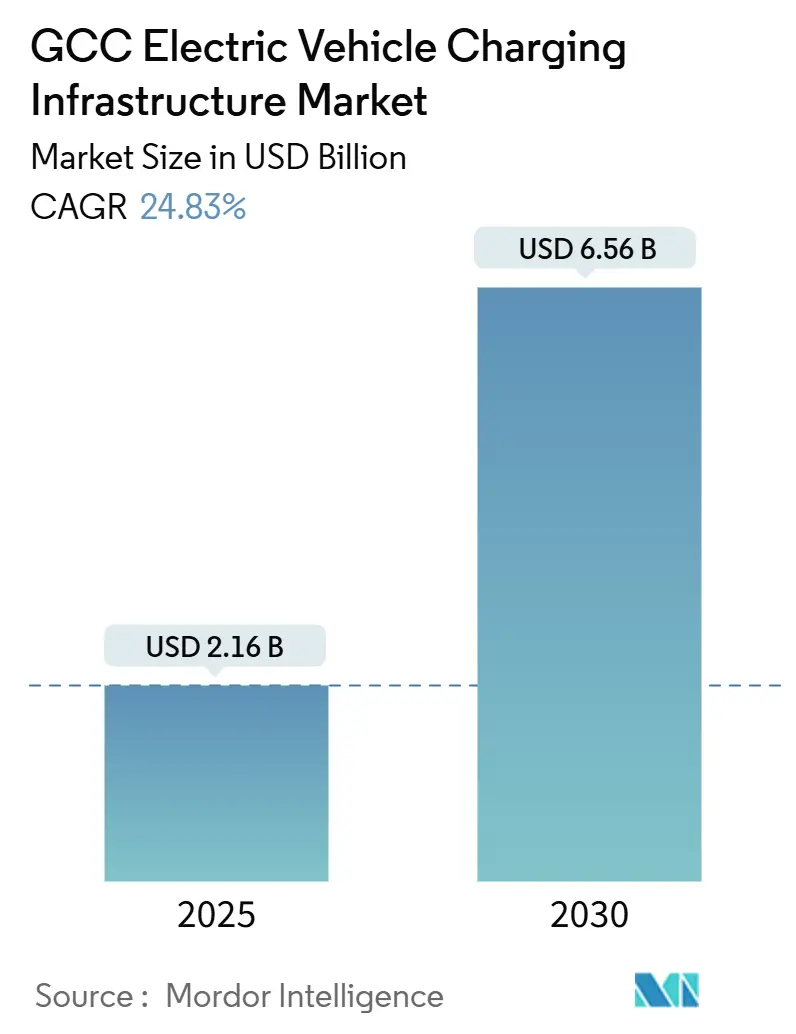
| Market Size (2025) | USD 2.16 Billion |
| Market Size (2030) | USD 6.56 Billion |
| Growth Rate (2025 - 2030) | 24.83% CAGR |
| Market Concentration | Medium |
Major Players
*Disclaimer: Major Players sorted in no particular order Image © Mordor Intelligence. Reuse requires attribution under CC BY 4.0. |
|
GCC Electric Vehicle Charging Infrastructure Market Analysis by Mordor Intelligence
The GCC Electric Vehicle Charging Infrastructure market size reached USD 2.16 billion in 2025 and is on track to attain USD 6.56 billion by 2030, advancing at a 24.83% CAGR during 2025-2030. Aggressive government decarbonization mandates, multi-billion-dollar grid upgrades, and high-profile OEM partnerships underpin this growth trajectory. Saudi Arabia’s Vision 2030 investments anchor regional demand, while Qatar records the fastest national expansion. Passenger cars still dominate installed capacity, yet heavy commercial fleets, propelled by falling battery prices and predictable depot-charging cycles, are reshaping infrastructure design. A structural pivot from home charging toward publicly accessible, utility-run networks is underway, and connected chargers capable of seamless roaming and smart-grid interaction are scaling quickly. Competitive intensity is moderate: global power-electronics majors vie with integrated oil-and-gas incumbents that are repurposing retail fuel forecourts for high-power DC equipment.
Key Report Takeaways
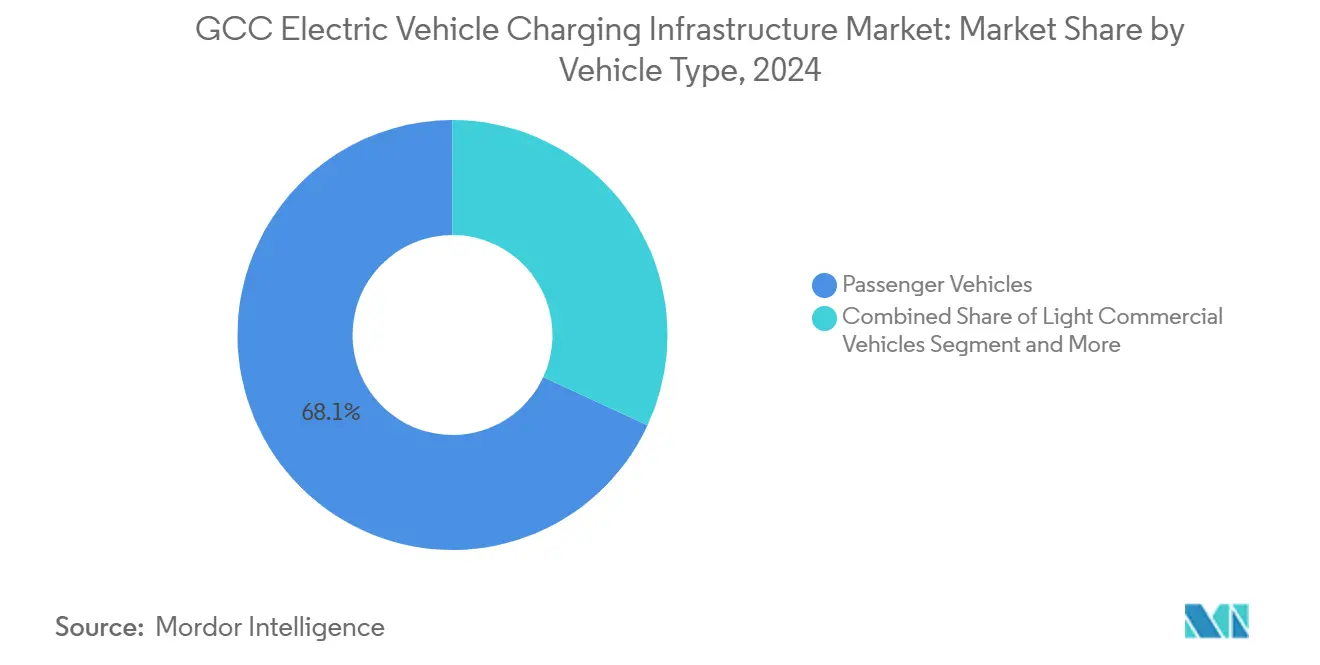
- By vehicle type, passenger cars held 68.12% of the GCC Electric Vehicle Charging Infrastructure market share in 2024, while heavy commercial vehicles are set to accelerate at a 48.07% CAGR through 2030.
- By charger type, AC stations captured 55.19% of the GCC Electric Vehicle Charging Infrastructure market size in 2024; DC stations are forecast to grow at a 42.23% CAGR over the same horizon.
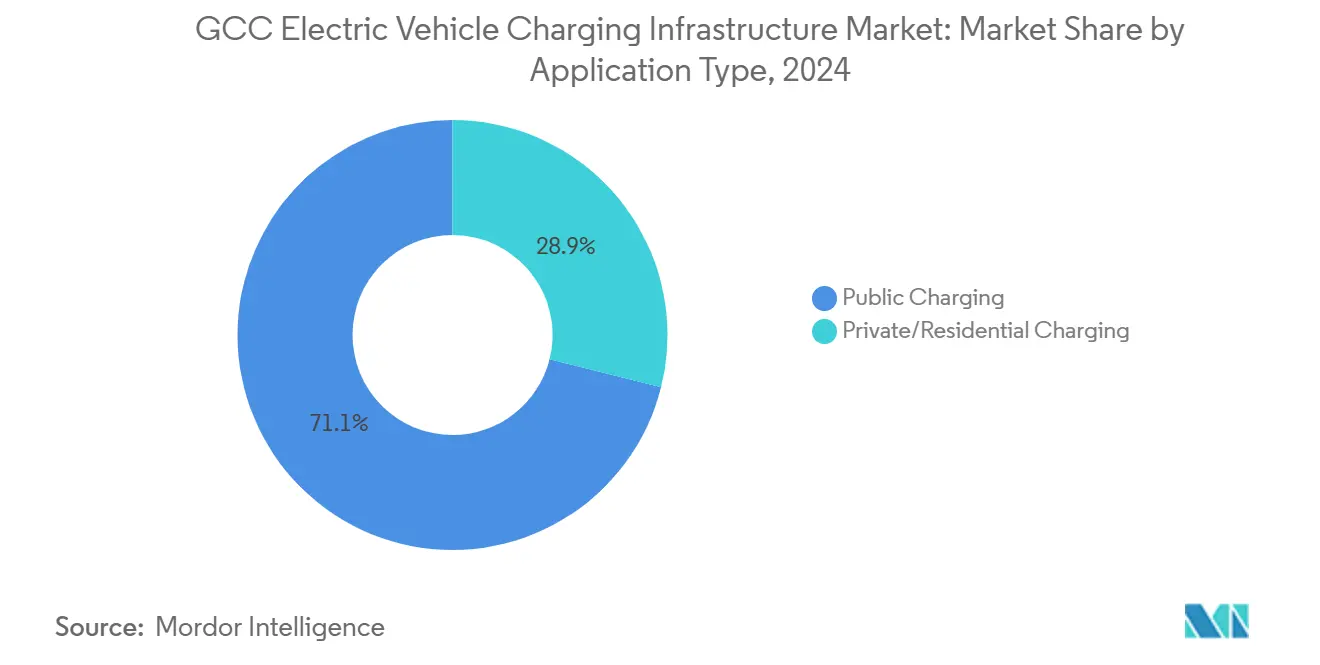
- By application, public charging commanded 71.14% share of the GCC Electric Vehicle Charging Infrastructure market size in 2024 and is projected to expand at a 37.08% CAGR between 2025-2030.
- By connectivity, connected stations accounted for 37.89% of installations in 2024 and are growing at a 44.36% CAGR.
- By country, Saudi Arabia led with 63.22% of the GCC Electric Vehicle Charging Infrastructure market share in 2024; Qatar is the fastest-growing country at a 52.14% CAGR to 2030.
GCC Electric Vehicle Charging Infrastructure Market Trends and Insights
Drivers Impact Analysis*
| Driver | (~) % Impact on CAGR Forecast | Geographic Relevance | Impact Timeline |
|---|---|---|---|
| Government EV Targets and Subsidies | +8.2% | Saudi Arabia; United Arab Emirates; spillover to Qatar, Kuwait | Medium term (2–4 years) |
| Utility-Led Public-Charging Roll-Outs | +6.1% | United Arab Emirates; Saudi Arabia; expanding to Oman, Bahrain | Short term (≤ 2 years) |
| Falling Battery Prices Enabling Fleet Electrification | +4.7% | Region-wide; early gains in Riyadh, Dubai, Doha | Medium term (2–4 years) |
| Solar-Powered Desert DC Hubs | +3.4% | Saudi Arabia; United Arab Emirateshighway corridors; Qatar industrial zones | Long term (≥ 4 years) |
| Luxury Tourism Projects Demanding Premium EV Amenities | +2.1% | United Arab Emirates mega-resorts; Saudi NEOM | Medium term (2–4 years) |
| Smart-City Investments Driving Integrated EV Infrastructure | +1.9% | Saudi NEOM; United Arab Emirates, Smart Dubai; Qatar Lusail City | Long term (≥ 4 years) |
| Source: Mordor Intelligence | |||
Government EV Targets and Subsidies
Unified national roadmaps are accelerating build-out schedules across the region. Saudi Arabia formed EVIQ in late 2023 with a mandate to blanket the kingdom in chargers and facilitate annual domestic EV production of 600,000 units[1]"Saudi Arabia: Global Strategic Partnerships Accelerate Electric Vehicle Industry," Asharq Al-Awsat, english.aawsat.com. . The United Arab Emirates aligns its Net-Zero 2050 pledge with licensing rules that require independent charge-point operators to secure permits from Dubai Electricity and Water Authority by March 2025, creating bankable regulatory clarity[2]"Regulatory Framework for Electric Vehicle Charging Infrastructure in the Emirate of Dubai and Licensing of Independent Charge Point Operators," The Dubai Electricity and Water Authority (DEWA), www.dewa.gov.ae.. Qatar funnels World-Cup legacy funds into a nationwide corridor of ultra-fast chargers, underpinning its projected 52.14% CAGR. Collectively, these policies reduce demand risk, de-bottleneck planning approvals, and unlock public-private partnerships for large-scale deployment.
Utility-Led Public-Charging Roll-Outs
State utilities leverage existing grids, land banks, and billing systems to deploy chargers at speed. DEWA already operates more than 400 public stations and targets 1,000 by the end of 2025. ADNOC has equipped roughly 85% of its forecourts with EV hardware, aiming for full coverage in 2025. Saudi Electricity Company earmarked USD 126 billion through 2030 for transmission upgrades, including 168 new 380 kV substations that enable multi-megawatt charging plazas[3]Edward James, "Saudi Electricity Company reveals 2030 expenditure details," MEED, meed.com.. Utility stewardship accelerates siting, ensures grid resilience, and provides natural gateways for third-party service layers such as roaming and dynamic pricing.
Falling Battery Prices Enabling Fleet Electrification
Total cost of ownership for electric trucks and buses now rivals diesel units, catalyzing depot-based charging investments. Heavy commercial vehicles are poised for a 48.07% CAGR as fleet operators capitalize on predictable duty cycles and bulk electricity tariffs. Dubai-based start-up E Daddy secured USD 15 million in August 2024 to localize two-wheeler production with advanced thermal management systems engineered for 50 °C ambient conditions. Depot installations employing 150-500 kW dispensers achieve high utilization, shortening payback periods and supporting grid-balancing services such as scheduled night-time charging.
Solar-Powered Desert DC Hubs
Ample solar irradiation enables grid-independent charging at remote rest stops and cross-border corridors. Saudi Arabia aims for 50% renewable electricity by 2030, underpinned by large photovoltaic projects that can anchor dedicated DC hubs. Co-located battery storage delivers round-the-clock service despite solar intermittency and curbs transmission losses on long radial feeders. ADNOC’s pilot sites integrating rooftop PV with 175 kW chargers validate commercial feasibility, while future gigawatt-scale renewables will support sub-500 km freight routes across the Empty Quarter.
Restraints Impact Analysis*
| Restraint | (~) % Impact on CAGR Forecast | Geographic Relevance | Impact Timeline |
|---|---|---|---|
| Limited Grid Capacity at Peak-Load Sites | -3.8% | Urban clusters; highway service areas | Short term (≤ 2 years) |
| High Upfront CAPEX for DC Fast Chargers | -2.9% | GCC-wide; acute for small operators | Medium term (2–4 years) |
| Electronics Derating Above 45 °C | -2.1% | Regional; severe in summer months | Long term (≥ 4 years) |
| Slow Harmonization of Roaming/Payment Platforms | -1.7% | Cross-border travel corridors | Medium term (2–4 years) |
| Source: Mordor Intelligence | |||
Limited Grid Capacity at Peak-Load Sites
Air-conditioning can consume 70% of Gulf electricity during summer, coinciding with late-afternoon charging peaks. Multi-dispenser DC plazas require several megawatts of additional capacity that many distribution feeders cannot currently deliver. Utilities now stipulate on-site storage and demand-response controls in interconnection agreements to temper overload risk. Saudi Arabia’s USD 5.33 billion HVDC program will add 7 GW of transfer capability, easing constraints in high-growth corridors.
High Upfront CAPEX for DC Fast Chargers
Turnkey installation of a 350-kW dispenser can exceed USD 500,000 once grid upgrades and civil works are included. Delta Electronics’ UFC 500 provides record 500 kW output but raises site costs for small operators. Next-generation power modules trialed with EVgo in 2024 promise 30% lower capital intensity through dynamic power-sharing and reduced cooling loads. Incentive grants and zero-interest loans from national clean-transport funds are beginning to close the financing gap, yet payback horizons remain sensitive to utilization levels.
*Our forecasts treat driver/restraint impacts as directional, not additive. The impact forecasts reflect baseline growth, mix effects, and variable interactions.
Segment Analysis
By Vehicle Type: Commercial Fleets Drive Infrastructure Demand
Passenger cars held a 68.12% market share. In contrast, Heavy commercial vehicles contributed a modest volume in 2024, yet underpin the fastest-growing slice of the GCC Electric Vehicle Charging Infrastructure market with a 48.07% CAGR. Their share of the GCC Electric Vehicle Charging Infrastructure market size is projected to widen materially by 2030 as logistics operators adopt depot-based megawatt charging that slashes diesel operating costs. Depot economics benefit from predictable duty cycles, enabling high charger utilization and favorable energy tariffs. Passenger cars will still account for the majority of connections, yet their residential charging orientation moderates revenue intensity.
Fleet electrification reshapes hardware specifications. Multi-output systems such as Delta’s new 3 MW array can allocate up to 300 kW per stall across 16 dispensers, meeting tight turnaround schedules for buses and rigid trucks. Integrating rooftop solar and stationary storage further enhances depot resilience, especially where feeder upgrades lag vehicle roll-outs.


By Charger Type: DC Stations Accelerate Despite AC Dominance
AC hardware retained 55.19% regional share in 2024 as home and workplace sockets proliferated. Yet DC equipment is set to compound at 42.23% annually, supported by ambitious corridor electrification targets and rising battery capacities that justify more than 350 kW charge rates. This growth lifts the DC slice of the GCC Electric Vehicle Charging Infrastructure market size and promotes refueling-style user experiences required for mass adoption on intercity routes.
Ruggedization remains paramount. IP55-rated cabinets, silicon-carbide semiconductors, and liquid cooling preserve performance at up to 50 °C. Delta’s 97%-efficient Wallbox and its vandal-resistant IK08 housing exemplify the design adaptations necessary for desert climates.
By Application Type: Public Infrastructure Leads Market Evolution
Public sites captured 71.14% of installations in 2024 and are forecast to post a 37.08% CAGR, reflecting state mandates for ubiquitous access. Utilities dominate roll-out velocity, converting forecourts and car parks into multi-lane charging hubs that leverage existing high-voltage feeders. The GCC Electric Vehicle Charging Infrastructure market size in public domains will increasingly dwarf private installations as tariff frameworks mature.
Home and workplace charging retain strategic relevance for overnight replenishment but attract lower throughput. Residential plugins often remain unconnected to network operators, limiting monetization and smart-grid participation. Policy trends now encourage semi-public chargers in apartment blocks and commercial towers, bridging the gap between private convenience and network visibility.
By Connectivity: Smart Charging Transforms Network Operations
Connected chargers accounted for 37.89% of installed points in 2024, yet are expanding at a 44.36% CAGR. Operators pursue remote diagnostics, load-balancing algorithms, and billing integration to secure revenue and uptime. ISO 15118 Plug-and-Charge is gaining momentum following a 2024 industry agreement to deploy universal PKI certificates by 2025. Connectivity unlocks vehicle-to-grid trials that exploit night-time idle batteries for frequency regulation services, an attractive proposition as renewable penetration climbs.
Non-connected points, while still forming the majority, are losing share as regulators favor chargers that support cybersecurity, roaming, and dynamic price signaling. Retrofit kits offering OCPP-1.6 firmware upgrades are emerging, yet many legacy units lack the compute headroom to meet forthcoming compliance deadlines.
Geography Analysis
Saudi Arabia held 63.22% of the GCC Electric Vehicle Charging Infrastructure market in 2024, underpinned by Vision 2030’s industrial policy and a USD 126 billion grid-modernization plan that includes 48,210 km of new transmission lines. EVIQ is prioritizing high-traffic corridors between Riyadh, Jeddah, and Dammam, while NEOM positions the northwest as a living laboratory for solar-powered ultrafast hubs. Cross-subsidies from oil revenues mitigate early-stage scale disadvantages and accelerate charger density.
The United Arab Emirates combines policy agility with premium tourist demand. Dubai Electricity and Water Authority’s Smart-Grid initiative invests AED 7 billion in distribution automation and advanced metering that allow sub-second demand response. ADNOC’s partnership with bp pulse leverages 450 retail forecourts to anchor 150-350 kW dispensers, integrating payment apps with existing loyalty programs. Coordination between Dubai and Abu Dhabi ensures interoperability across emirates, enabling seamless driver experiences on the Sheikh Zayed and E11 highways.
Qatar posts the region’s steepest growth curve at 52.14% CAGR. Compact geography and post-World-Cup infrastructure produce a favorable base for network densification. Sovereign wealth resources support 100% renewable energy sourcing for flagship charging sites, reinforcing branding as a sustainability front-runner. Smaller markets—Oman, Kuwait, and Bahrain—advance through harmonized technical standards that reduce procurement costs and through cross-border roaming agreements to entice inter-state EV tourism.
Competitive Landscape
Market concentration is moderate as legacy power-electronics manufacturers tussle with national oil companies transitioning into energy-as-a-service. ABB, Schneider Electric, and Siemens exploit decades-long utility relationships to secure turnkey EPC contracts, often bundling transformers, SCADA, and cybersecurity platforms. Integrated oil-and-gas players leverage real-estate footprints: Saudi Aramco’s Electromin and ADNOC’s bp pulse retrofit forecourts with 50-500 kW dispensers to retain fuel-retail footfall.
Strategic alliances dominate product evolution. Delta Electronics and EVgo demonstrated a 30% capex reduction at pilot sites by sharing rectifiers across multiple outlets and cutting ambient cooling demand by 20%. Meanwhile, Hubject’s roaming ledger, adopted by nearly all regional operators, sets performance baselines for session authentication and revenue settlement.
White-space opportunities include mobile charging trucks for event venues, AI-driven charger-site selection, and embedded energy storage that mitigates peak-load penalties in tariff regimes. Start-ups specializing in software-defined power management and predictive maintenance draw investment from both sovereign funds and institutional climate-tech vehicles, raising competitive stakes for incumbent hardware OEMs.
GCC Electric Vehicle Charging Infrastructure Industry Leaders
-
ABB Ltd.
-
Schneider Electric SE
-
Siemens AG
-
Tesla, Inc.
-
Electromin (Saudi Aramco)
- *Disclaimer: Major Players sorted in no particular order


Recent Industry Developments
- July 2025: Dubai Electricity and Water Authority published updated regulatory framework for EV charging infrastructure, requiring immediate licensing compliance for Independent Charge Point Operators following expiration of transitional period in March 2025.
- April 2025: Delta Electronics unveiled scalable MW-level charging solutions capable of delivering up to 3MW across 16 charging outputs, targeting large EV fleets with distributed architecture and renewable energy integration capabilities. The announcement at ACT Expo 2025 includes ultra-slim 50kW DC Wallbox chargers designed for urban deployment with 97% efficiency and simultaneous dual-vehicle charging capability.


GCC Electric Vehicle Charging Infrastructure Market Report Scope
| Passenger Vehicles |
| Light Commercial Vehicles |
| Medium Commercial Vehicles |
| Heavy Commercial Vehicles |
| AC Charging Stations |
| DC Charging Stations |
| Public Charging |
| Private/Residential Charging |
| Connected (Networked) Stations |
| Non-Connected Stations |
| Saudi Arabia |
| United Arab Emirates |
| Qatar |
| Kuwait |
| Oman |
| Bahrain |
| By Vehicle Type | Passenger Vehicles |
| Light Commercial Vehicles | |
| Medium Commercial Vehicles | |
| Heavy Commercial Vehicles | |
| By Charger Type | AC Charging Stations |
| DC Charging Stations | |
| By Application Type | Public Charging |
| Private/Residential Charging | |
| By Connectivity | Connected (Networked) Stations |
| Non-Connected Stations | |
| By Country | Saudi Arabia |
| United Arab Emirates | |
| Qatar | |
| Kuwait | |
| Oman | |
| Bahrain |


Key Questions Answered in the Report
How large is the GCC Electric Vehicle Charging Infrastructure market in 2025?
It stands at USD 2.16 billion and is set to reach USD 6.56 billion by 2030, supported by a 24.83% CAGR.
Which country contributes the most installations?
Saudi Arabia leads with 63.22% of installed capacity, driven by Vision 2030 grid and manufacturing initiatives.
What segment is expanding fastest?
Heavy commercial vehicle depots are scaling at a 48.07% CAGR on the back of fleet electrification economics.
Are DC chargers overtaking AC units?
DC stations are growing at 42.23% annually and will steadily erode AC dominance on intercity and commercial routes.
How are utilities influencing roll-outs?
State utilities such as DEWA and ADNOC leverage existing grids and real estate to deploy public chargers rapidly, ensuring grid resilience and high uptime.
What standards ensure cross-network roaming?
ISO 15118 Plug-and-Charge combined with OCPP ensures seamless authentication and billing among regional operators.
Page last updated on:


